3D virtual representation of drones' flights through Cesium.js and Oculus Rift.
←
→
Page content transcription
If your browser does not render page correctly, please read the page content below
9as JORNADAS DE SIG LIBRE

                    3D virtual representation of drones' flights
                       through Cesium.js and Oculus Rift.
   M. Di Paolantonio, C. González Fernández, M. José Latorre, A. Roldán París y F.
                                  Pedrera García

 Elecnor Deimos, Ronda de Poniente, 19, 28760 Tres Cantos, Madrid, felix.pedrera@deimos-
                                       space.com.

      ABSTRACT
      Nowadays, Unmanned Aerial Vehicles (UAV), known as drones, are tools
      whose use is increasing in the field of earth's surface images capture. Their
      applications range from precision agriculture, infrastructures monitoring to
      geological studies, resulting in an inexpensive alternative to the manned
      aerial vehicles traditionally used in photogrammetry.
      UAV systems can be equipped with different instruments: optical cameras,
      multispectral or infrared ones, that in combination with satellite localization
      tools with accuracy in the order of centimetres, allow to obtain different
      products from a single flight, products like: georeferenced mosaics, digital
      elevation models (DEM), outlines, 3D textures, point clouds, etc.
      This work describes the representation of drone's flights in web browsers
      using 3D globes visualization technology Cesium.js and virtual reality
      headset Oculus Rift.
      Starting from data collected in different flight campaigns, the interactive
      visualization is performed using telemetry data, digital elevation models,
      georeferenced images and mosaics. These data are processed by open
      source software (GDAL) and loaded and served by a geographic data
      server (GeoServer) through OGC web services (WMS, WFS). This
      representation allow users to virtually experience the flight and to visualize
      in an interactive way the images and the flight data captured by the
      onboard instruments, taking advantage of the immersive visual interface
      offered by Oculus Rift and the orientation of the point of view through its
      integrated sensors.
      Keywords: UAV, Cesium, Oculus Rift.

Plaça Ferrater Mora 1, 17071 Girona
Tel. 972 41 80 39, Fax. 972 41 82 30
infojornadas@sigte.org http://www.sigte.udg.edu/jornadassiglibre/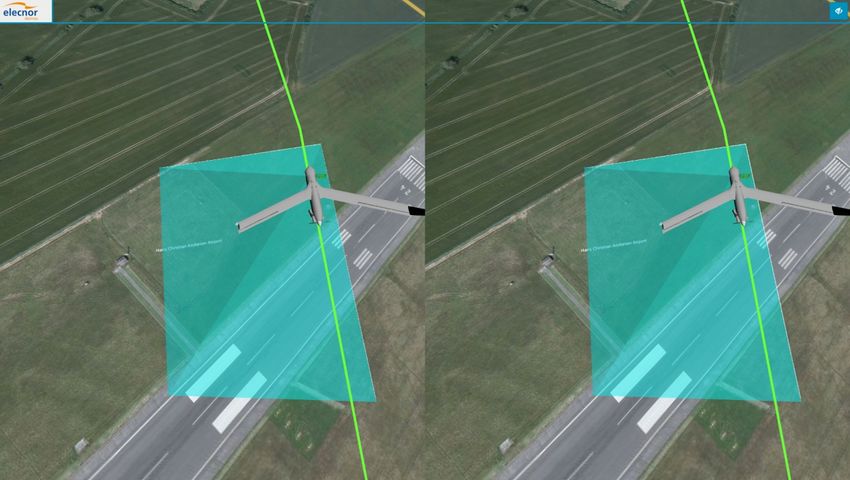
Servicio de Sistemas de Información Geográfica y Teledetección

                                                                     9as Jornadas de SIG Libre

DATA
   Data are the main theme of this work, starting from the initial structure, going
through the back-end processing, till reaching their visualization in the front-end. On
board instruments of UAVs provide us telemetry data as .dat files containing the fields
shown in Table 1. Telemetry formatTable 1.

                                     Table 1. Telemetry format

                         Value                                      unit of measurement
                Relative time elapsed                                     [seconds]
              Stamp time (creation time)                                  [seconds]
              Stamp time (creation time)                                [milliseconds]
                      Update flag                                     [dimensionless]
             Stamp time (application time)                              [milliseconds]
             Stamp time (application time)                              [milliseconds]
                          Roll                                          [SI(degrees)]
                         Pitch                                          [SI(degrees)]
                          Yaw                                           [SI(degrees)]
                   Angular Rate X                                             [SI]
                   Angular Rate Y                                             [SI]
                   Angular Rate Z                                             [SI]
                   Ground Speed X                                             [SI]
                   Ground Speed Y                                             [SI]
                   Ground Speed Z                                             [SI]
                     True Bearing                                             [SI]
                 BFS Acceleration Y                                           [SI]
                       Longitude                                          [degrees]
                        Latitude                                          [degrees]
                       Altitude                                          [SI(meters)]
                    Rate of Climb                                             [SI]
                 Calibrated Air Speed                                         [SI]
                 Indicated Air Speed                                          [SI]
                   Static Pressure                                            [SI]
                     Temperature                                              [SI]

BACK-END
Architecture

   The system, as shown in Figure 1Figure 1. Back-end architecture, is composed by
two main elements: server and data storage. Since telemetry data could come with
associated images the following architecture has been chosen:

Plaça Ferrater Mora 1, 17071 Girona
Tel. 972 41 80 39, Fax. 972 41 82 30
infojornadas@sigte.org http://www.sigte.udg.edu/jornadassiglibre/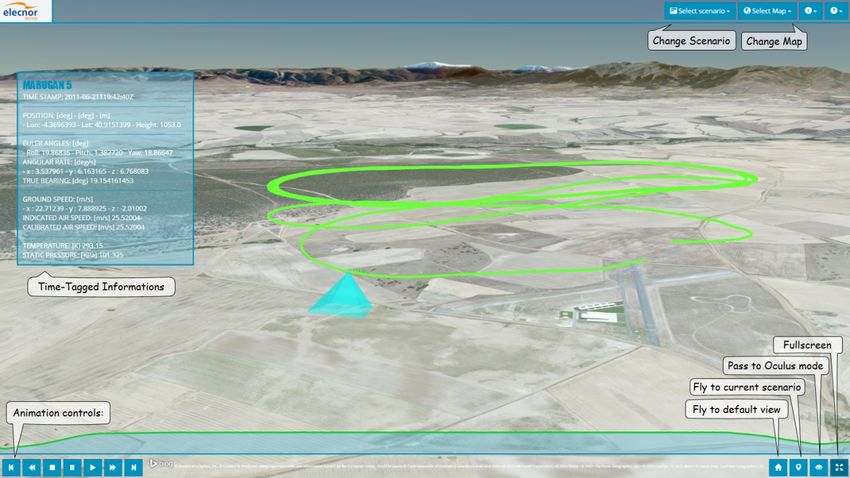
Servicio de Sistemas de Información Geográfica y Teledetección
9as Jornadas de SIG Libre
Figure 1. Back-end architecture
Data storage
Vector Data storage: a geospatial database that handles geometry and
vector features (telemetries) built with PostGIS, an extender for
PostgresSQL object-relational database that comes with support for
geographic object.
Raster Data storage: a file system instance images' storage.
Server
Implemented through a GeoServer instance, an open source server for sharing
geospatial data that comes with a number of open standards implementations such as
Web Feature Service (WFS) and Web Map Service (WMS).
Data distribution
Web Map Service
It is a standard protocol for serving georeferenced map images over the Internet,
since images have a high resolution, in order to achieve an efficient delivery the
following processing has to be done:
Mosaic: starting from a bunch of georeferenced images relative to an area of
interest a new completed and continuous image (mosaic) is generated,
overlapping the original rectified images.
Figure 2. Generic mosaic of UAV's images
Pyramid: collection of multiples mosaics where each mosaic is associated to
a different zoom level.
Plaça Ferrater Mora 1, 17071 Girona
Tel. 972 41 80 39, Fax. 972 41 82 30
infojornadas@sigte.org http://www.sigte.udg.edu/jornadassiglibre/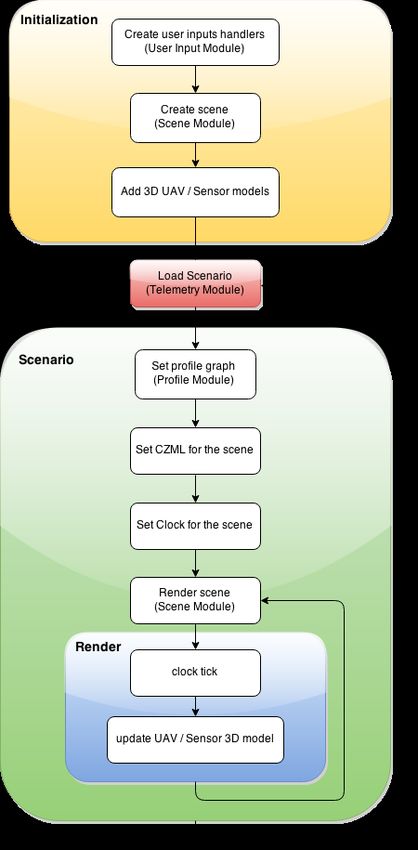
Servicio de Sistemas de Información Geográfica y Teledetección
9as Jornadas de SIG Libre
Web Feature Service
It is a standard that provides an interface allowing requests for geographical
features across the web using platform-independent calls.
Data processing and loading
Telemetry
The following list represents the first processing steps performed on .dat telemetry
files:
shapefile creation: taking advantage of the software QGIS[1]., an open
source Geographic Information System, a new .shp file representing a layer
of points is generated from each telemetry.
PostGIS[2]. database upload: each .shp file is uploaded as a new table to
the Vector Data storage by the following command:
shp2pgsql -W LATIN1 -s 23030 -I fileName.shp name | psql -d
databaseName -U postgres.
database table processing: the table columns are renamed according to
their contents through PostregreSQL[3].[2]. code.
GeoServer[4].: finally the database is exposed to the server as a new data
storage and its layers are published.
FRONT-END
Fundamentals
Cesium.js
Cesium.js is a JavaScript library for creating 3D globes and 2D maps in web
browsers. It uses WebGL for hardware-accelerated graphics, and it is tuned for
dynamic-data visualization. Its stack is composed of four layers[5].:
Core: it processes and performs operations like linear algebra, intersection
tests, and interpolation.
Renderer: a thin abstraction over WebGL.
Scene: globe and map constructs like imagery layers, polylines and cameras.
Dynamic Scene: Time-dynamic visualization constructs including CZML
rendering.
Core
Contains low-level, widely-used functions mostly related to math:
Matrices, vectors and quaternions.
Transformations, such as cartographic to Cartesian.
Map projections, such as Mercator and Equidistant Cylindrical.
Julian dates.
Splines for interpolating position and orientation.
Geometric routines like triangulation, subdivision surfaces, vertex cache
optimization, and computing ellipse boundary points.
Renderer
Abstraction over WebGL that includes built-in GLSL uniforms and functions;
abstractions for shader programs; textures and cube maps; buffers and vertex arrays;
render states; framebuffers.
Plaça Ferrater Mora 1, 17071 Girona
Tel. 972 41 80 39, Fax. 972 41 82 30
infojornadas@sigte.org http://www.sigte.udg.edu/jornadassiglibre/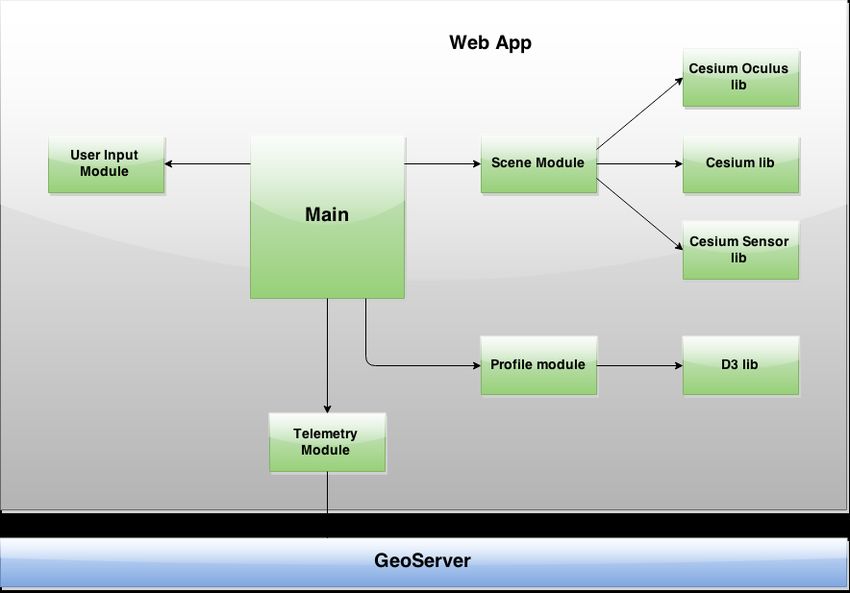
Servicio de Sistemas de Información Geográfica y Teledetección
9as Jornadas de SIG Libre
Scene
It is a representation of all graphical objects and states for canvas and provides
relativity high-level map and globe constructs, including:
3D globe, 2D map, and 2.5D Columbus view.
Streaming high-resolution imagery from multiple sources, including Bing Maps,
ESRI ArcGIS Map Server, OpenStreetMap, and Web Map Service (WMS).
Polylines, polygons, billboards, labels, ellipsoids, and sensors.
Cameras that control the view and respond to input.
Animations that change properties over time.
Dynamic Scene
It enables data-driven visualization, primarily via the processing of CZML, a JSON
based schema for describing a time-dynamic graphical scene.
CZML
It describes lines, points, billboards (markers) and other graphical primitives. It
specifies how they change with time and it has a relation with Cesium similar to the
relationship between Google Earth and KML[6]..
Oculus Rift
It is a virtual reality head-mounted display developed by Oculus VR[7].. Its
characteristics are listed in Table 2.
Table 2. Oculus Rift SDK2
Characteristic Value
Resolution 960 x 1080 per eye
Refresh Rate 75 Hz, 72 Hz, 60 Hz
Persistence 2 ms, 3 ms, full
Field of view 100° Field of View (nominal)
Video in HDMI 1.4b
Sensors Gyroscope, Accelerometer, Magnetometer
Inertial Update Rate 1000 Hz
Architecture
Libraries
Bootstrap[8].: HTML, CSS, and JS framework for developing web applications.
JQuery[9].: JS library for traversing and manipulation of HTML documents.
D3[10].: JS library for manipulating documents based on data, using HTML,
SVG, and CSS.
Cesium[11].[10].: JS library for creating 3D globes and 2D maps in a web
browser.
CesiumSensor[12].: Cesium plugin for visualizing sensor volumes.
CesiumOculus[13].: Cesium plugin to support VR devices using a VR-enabled
browser, for example Mozilla Firefox Nightly.
Modules
As shown in Figure 3, front-end architecture is composed by a Main module that
handles the four modules following described:
Plaça Ferrater Mora 1, 17071 Girona
Tel. 972 41 80 39, Fax. 972 41 82 30
infojornadas@sigte.org http://www.sigte.udg.edu/jornadassiglibre/Servicio de Sistemas de Información Geográfica y Teledetección
9as Jornadas de SIG Libre
User Input module: it processes inputs coming from mouse, keyboard and
interface's buttons.
Profile module: it draws UAV's altitude profile with respect to sea level, taking
advantage of D3's capabilities.
Scene module: it returns to the Main an object scene and a method to renderize
it and its 3D elements according to the mode select by the user (Viewer,
Oculus). This is achieved through libraries Cesium (creation and Viever mode
rendering), CesiumOculus (Oculus mode rendering), CesiumSensor (camera
pyramid sensor creation).
Telemetry module: it requests to GeoServer telemetry data in GeoJSON form,
processes them and passes to the Main a new object composed of:
– data coming from back-end.
– altitude and time data needed by Profile module.
– position, orientation and time data in a CMZL structure needed by Scene
module (actually by render function).
– few others structures for quickly accessing data
Figure 3. Front-end architecture
Workflow and Data Processing
As described in Figure 4, once the application has been initialized is ready to load
the three fundamentals elements (path, sensor, UAV) relatives to the current selected
scenario and to start a render loop that, according to time, displays these elements in
an animated way.
Plaça Ferrater Mora 1, 17071 Girona
Tel. 972 41 80 39, Fax. 972 41 82 30
infojornadas@sigte.org http://www.sigte.udg.edu/jornadassiglibre/Servicio de Sistemas de Información Geográfica y Teledetección
9as Jornadas de SIG Libre
Figure 4. Workflow
Sensor and UAV models
Taking advantage of the Cesium Sensor plugin a pyramidal cone is created with
apex centred in the current-time telemetry point and projection angles X of 50
degrees and Y of 70 degrees. This design is based on the Canon Powershot
S110 camera which is frequently used for these applications[14]..
For the UAV model a previous conversion from .dae to .gITF has been done in
order to serve it to Cesium scene in its own compatible format.
Plaça Ferrater Mora 1, 17071 Girona
Tel. 972 41 80 39, Fax. 972 41 82 30
infojornadas@sigte.org http://www.sigte.udg.edu/jornadassiglibre/Servicio de Sistemas de Información Geográfica y Teledetección
9as Jornadas de SIG Libre
Scenario Data retrieving
As mentioned before data are served by GeoServer through the OGC standard
WFS.
Telemetry
It is received as a GeoJSON object by calling an url with this structure:
"http://geoserverInstance/workspace/ows?
service=WFS&version=1.0.0&request=GetFeature&typeName=
workspace:name&outputFormat=application/json"
Mosaic layer (pyramid of mosaics)
Having images and the related mosaic's pyramid stored in GeoServer, the mosaic
layer could be directly added to the scene as a new layer, lying over the base map,
using the Cesium's feature:
Cesium.WebMapServiceImageryProvider({
url : "http:// geoserverInstance /ows?version=1.1.1&",
layers : "workspace:name",
parameters : {
transparent : true,
format : "image/png"
}
})
CZML set up
The engine of each scenario is the relative CZML. What follows is a simplified
version of the object created by the Telemetry module from the server's GeoJSON
response when the load of a new scenario is requested:
{
"path" : { … },
"position" : {
…,
"cartographicDegrees" : positionsTimeTagged
},
"orientation":{
…,
"unitQuaternion": quaternionsTimeTagged,
},
"clock" : {
…,
"currentTime" :startTime,
}
}
This object is an entity representing the telemetry as a polyline in the scene, thanks
to the property path, with its own lifetime cycle defined by the clock property and with
specific values of position and orientation for each moment of the lifecycle. In details:
position.cartographicDegrees: an array with the following structure [Time,
Longitude, Latitude, Height, Time, Longitude, Latitude, Height, ...], where Time
is an ISO 8601 date and time string, Longitude and Latitude are in degrees and
Height is in meters (WGS84).
orientation.unitQuaternion: array with the following structure [Time, q0, q1, q2,
q3, Time, q0, q1, q2, q3, ...], where Time is an ISO 8601 date and time string,
Plaça Ferrater Mora 1, 17071 Girona
Tel. 972 41 80 39, Fax. 972 41 82 30
infojornadas@sigte.org http://www.sigte.udg.edu/jornadassiglibre/Servicio de Sistemas de Información Geográfica y Teledetección
9as Jornadas de SIG Libre
and q0, q1, q2, q3 are the components of the quaternion Q calculated form roll (
ϕ ), pitch ( ϑ ) and yaw ( ψ ) as follow[15].:
[ ][ ]
qo cos ( ϕ/2 ) ∙cos ( ϑ/2 ) ∙ cos ( ψ /2 )+ sin ( ϕ /2 ) ∙ sin ( ϑ/2 ) ∙ sin (ψ /2 )
sin ( ϕ /2 ) ∙ cos ( ϑ/2 ) ∙ cos (ψ /2 ) +cos ( ϕ /2 ) ∙ sin ( ϑ/2 ) ∙ sin (ψ /2 )
Q= q 1 =
q 2 cos ( ϕ/2 ) ∙sin ( ϑ/2 ) ∙ cos (ψ /2 ) +sin ( ϕ/2 ) ∙ cos ( ϑ/2 ) ∙ sin (ψ /2 )
q 3 cos ( ϕ/2 ) ∙cos ( ϑ/2 ) ∙ sin (ψ /2 ) +sin ( ϕ/2 ) ∙sin ( ϑ /2 ) ∙cos (ψ /2 )
Equation 1. Euler angles to quaternion
Render loop transformations
Once the CZML is fed to the scene, and its clock is set as scene clock, the
interaction between the following Cesium methods ensures the synchronization
between frame rendering and time animation:
Cesium.requestAnimationFrame(callback): a browser-independent function to
request a new animation frame.
Cesium.Clock.tick(): it advances the clock from the currentTime based on the
current configuration options. It should be called at every frame, regardless of
whether animation is taking place or not. The configuration options are indeed
the ones manipulated by user with animation buttons.
Therefore, during the render loop the CZML entity changes its position and orientation
based on clock's current value. Then, with a simple call to:
property.getValue(clock.currentTime)
current position or orientation can be obtained. Next step is the update of the model
matrix of the UAV and Sensor 3D model each time a new frame is drawn:
starting from the position, with the method
Cesium.Transforms.northEastDownToFixedFrame(origin, ellipsoid),
a 4x4 transformation matrix is computed from a North-East-Down (NED)
reference frame centred at the provided position to Earth element ellipsoid's
fixed reference frame.
starting from the orientation a 3x3 transformation matrix is computed using
again Euler's angles in the following way[15].:
[ ]
2 2 2 2
q 0 +q 1 −q 2 −q 3 2∙ ( q 1 ∙q 2−q 0 ∙ q 3 ) 2 ∙ ( q 0∙ q 2+ q 1∙ q 3 )
M = 2∙ ( q 1 ∙q 2+ q 0 ∙ q 3 ) q 02−q 12+ q 22−q 3 2 2∙ ( q 2 ∙ q 3−q 0 ∙q 1 )
2 ∙ ( q 1∙ q 3−q 0 ∙ q 2 ) 2∙ ( q 0 ∙ q 1+q 2 ∙ q 3 ) q 02−q 12−q 22 +q 3 2
Equation 2. Quaternion to Euler's matrix
The final step is a matrix multiplication to obtain a unique transformation from
translation (position) and rotation (orientation), that can be used as the model
matrix for UAV and Sensor elements.
Plaça Ferrater Mora 1, 17071 Girona
Tel. 972 41 80 39, Fax. 972 41 82 30
infojornadas@sigte.org http://www.sigte.udg.edu/jornadassiglibre/Servicio de Sistemas de Información Geográfica y Teledetección
9as Jornadas de SIG Libre
SIMULATOR
As already mentioned the simulator has two visualization modes with different
features and functionalities.
Viewer mode
In addition to the buttons displayed in Figure 5, the user can directly interact with
the scene (actually the globe) in the following way:
Pan view: left click + drag.
Zoom view: Right click + drag, or Mouse wheel scroll
Rotate view: Middle click + drag, or Left click + drag up/down.
Figure 5. Viewer mode - Marugan 5
Figure 6. Viewer mode - Marugan 2
Plaça Ferrater Mora 1, 17071 Girona
Tel. 972 41 80 39, Fax. 972 41 82 30
infojornadas@sigte.org http://www.sigte.udg.edu/jornadassiglibre/Servicio de Sistemas de Información Geográfica y Teledetección
9as Jornadas de SIG Libre
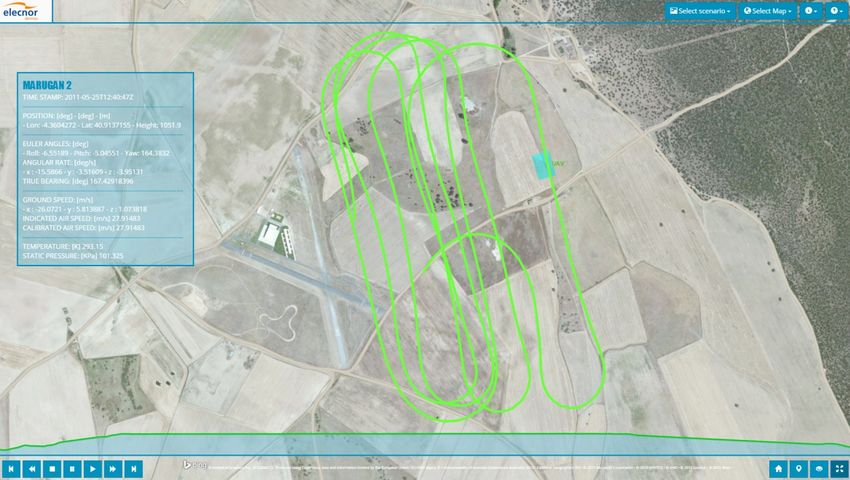
Oculus mode
In this kind of visualization the user interaction is handled by keyboard inputs:
W / S: move camera forward / backward.
D / A: move camera right / left.
Q / E: move camera up / down.
Shift: speed up, duplicate movement's velocity.
Space Bar: level camera with respect to horizon.
J: jump in the UAV, keep updating camera position according to the UAV's one,
user will be in the place of an hypothetical pilot and have a first person view.
Figure 7. Oculus mode (ScanEagle)
CONCLUSIONS AND FUTURE WORKS
The technology described in this paper represents a realistic and immersive way of
UAV's flights representation that can be used by common users to browse catalogues
of flights and their data as well as by drone's operator in order to refine their flight
technique. From this research it would be noteworthy adding a digital elevation model
taking advance of the feature: Cesium.CesiumTerrainProvider({....}) and passing to the
feature heightmap or quantized-mesh tiles directly processed from flights' data[16].. At
the same time it could be interesting to investigate the possibility of adding new
features like flights planning where the user can create his own flying paths and
choose between different models of camera and UAV.
ACKNOWLEDGEMENTS
This work has been partially supported by Spanish Government by the project
ADAM with reference IPT-20111026 under program INNPRONTA and Deimos Space
S.L.U.
Plaça Ferrater Mora 1, 17071 Girona
Tel. 972 41 80 39, Fax. 972 41 82 30
infojornadas@sigte.org http://www.sigte.udg.edu/jornadassiglibre/Servicio de Sistemas de Información Geográfica y Teledetección
9as Jornadas de SIG Libre
REFERENCES
[1]. http://docs.qgis.org/2.6/es/docs/user_manual/working_with_vector/supported_data.
html
[2]. http://postgis.net/docs/using_postgis_dbmanagement.html#shp2pgsql_usage
[3]. http://www.postgresql.org/docs/
[4]. http://geoserver.org/
[5]. Patrick Cozzi. Architecture.
https://github.com/AnalyticalGraphicsInc/cesium/wiki/Architecture
[6]. https://github.com/AnalyticalGraphicsInc/cesium/wiki/CZML-Guide
[7]. https://www.oculus.com/
[8]. http://getbootstrap.com/
[9]. http://jquery.com/
[10]. http://d3js.org/
[11]. http://cesiumjs.org/
[12]. https://github.com/AnalyticalGraphicsInc/cesium-sensors
[13]. https://github.com/NICTA/cesium-vr
[14]. Unger, J., Reich, M., & Heipke, C. (2014). UAV-based photogrammetry:
monitoring of a building zone. ISPRS - International Archives of the
Photogrammetry, Remote Sensing and Spatial Information Sciences, XL-5, 601–
606. doi:10.5194/isprsarchives-XL-5-601-2014
[15]. Diebel, J. (2006). Representing attitude: Euler angles, unit quaternions, and
rotation vectors. Matrix, 58, 1–35. doi:10.1093/jxb/erm298
[16]. http://blog.thematicmapping.org/2014/10/3d-terrains-with-cesium.html
Plaça Ferrater Mora 1, 17071 Girona
Tel. 972 41 80 39, Fax. 972 41 82 30
infojornadas@sigte.org http://www.sigte.udg.edu/jornadassiglibre/You can also read