TOKYO JUNE 19-20, 2019 - Michelin
←
→
Page content transcription
If your browser does not render page correctly, please read the page content below
JUNE 19-20, 2019

TOKYO
MACQUARIE

Leverage on Group’s strengths, in four domains of growth, to
 enhance customers mobility and create value

    Michelin strengths                                             Four domains of growth

               Michelin Brand leadership
             Michelin Man sacred* "Icon of the Millennium"

               High-tech material leadership
           125 years of competencies and innovations in flexible
            composite materials and transformation processes

                 Employees engagement
           In 2018, 80% of employees say they are proud
                   and happy to work at Michelin

*By American magazine advertising week

2    Tokyo – Macquarie – June 19-20, 2019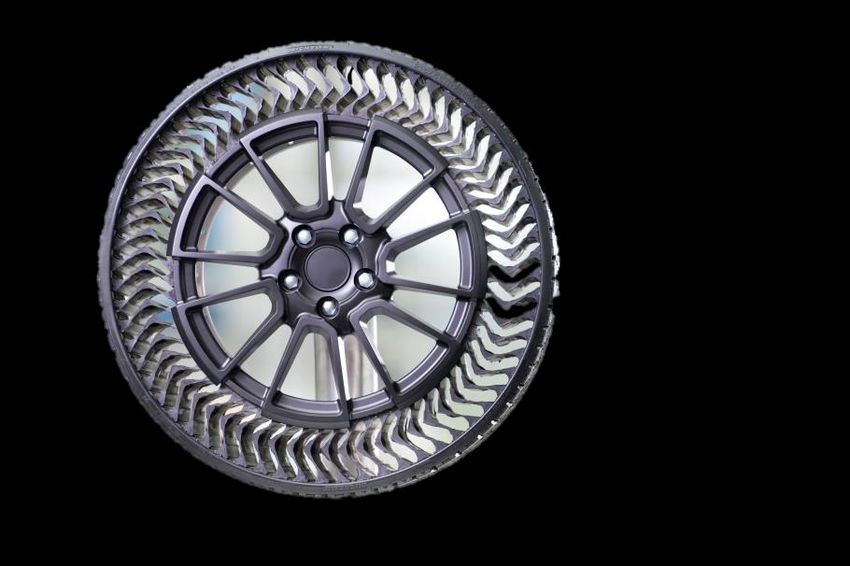
A resilient business thanks to Group’s global geographic
exposure and wide product offering

2018 sales by region                                2018 sales by growth driver

                          39%                                              TC RT
                                                                           PC

    35%                                                                      43%
                                                                                                                             19%
                                                                                                     25%
                                                                          Consomma-                                        Commodités
                                                                                                                           Commodities
                                                                          Consumption
                       26%                                                    tion
                                                     TC OE
                                                     PC OE                                        Manufacturing

                                                    12%
                                                    13
                                                     Auto

             Europe incl. Russia & CIS      PC OE/RT: Passenger car and light truck tires sold as original equipment (PC OE) or in
                                            replacement markets (PC RT)
             Asia and rest of the world

             North America incl. Mexico

3    Tokyo – Macquarie – June 19-20, 2019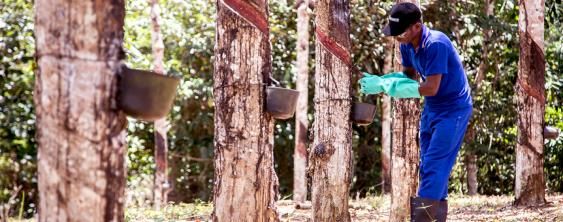
June 19-20, 2019
TOKYO - MACQUARIE

                    Levers of growth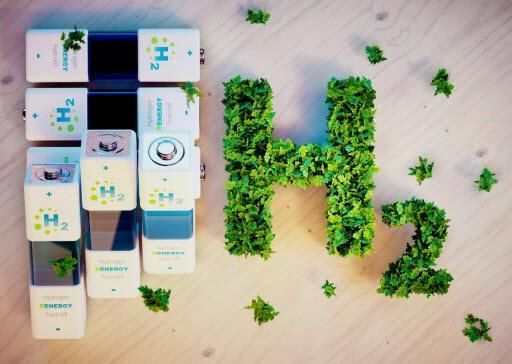
Tires                                  Tires

5   Tokyo – Macquarie – June 19-20, 2019
Tire market growth prospects                                                                      Tires

                                                  2019e      Markets 2020 and   Michelin growth
                         (in millions units)                     beyond            ambitions
                                                                                Growth in line with
                                           SR1   +0% / +1%    ~ +2% CAGR            markets

                                                                                  Value-creating
                                           SR2    ~ -1%        0 to +1% CAGR         growth

                                                                                  Growth above
                                           SR3   +3% / +5%     ~ +3% CAGR           markets

6   Tokyo – Macquarie – June 19-20, 2019
Recognized brand and technical leadership supporting
    pricing power                                                                                                                 Tires

● Recent Tirelines have already been
                                                            Since 1989, Michelin has won 91 of the 112
  acclaimed by some of the most demanding
                                                                  awards for OE tire satisfaction
  German car magazines
  Manufacturer of the year 2019 with

● The two latest additions to the MICHELIN
  Pilot Sport family presented at the Geneva
  International Motor Show
                         MICHELIN              MICHELIN
                        Pilot Sport           Pilot Sport
                        Cup2 R                4 SUV

                                                               Source: 2018 J.D. Power U.S. OE Tire Customer Satisfaction Study

   7   Tokyo – Macquarie – June 19-20, 2019
Uptis: the airless concept, an essential step towards more
sustainable mobility                                                                                Tires

                                          - From ambition to action -

     (Connected, Autonomous,
         Shared, Electric)

                    Benefits for car                                                  Co-developed
                        owner                                                      with General Motors
                   More serenity during
                      the journeys

                                                                        Benefits for all
                                                                        Material savings and
                                                                         waste reduction
                                             Benefits for fleet
                                               owners and
                                              profesionnals
8                                           Productivity optimisation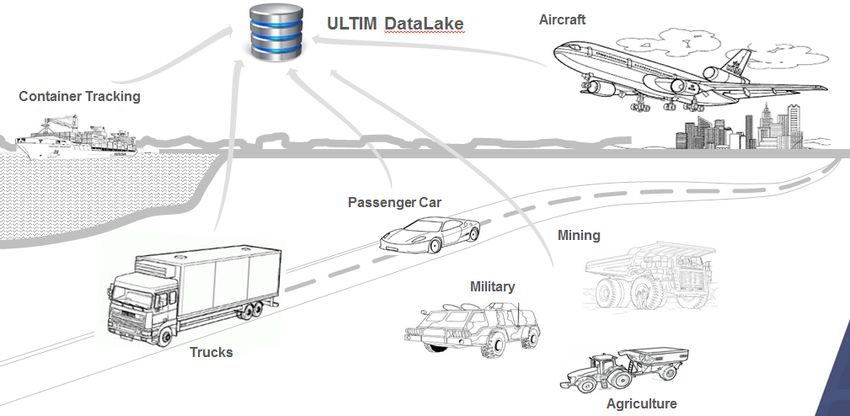
Multistrada: a key asset to capture the worlwide rising
demand in Tier 2 tires                                                                                                  Tires

    Rapidly convert PC Tier 3 capacity into PC Tier 2 capacity
    with very limited investment
                                                                                            ● Global Tier 2 market growth:
    Mu                                                                   Total production     ~+3%
                                                                            2023 - 11 Mu
    12                                                                                            ─ in line with projected
    10                                                                                              global  growth    over
                                                                                                    2017-2023: ~+3%
    8                                                                                             ─ Tier 1 market: ~+3%
    6                                                                                               driven by emerging
                                                                                                    economies
    4
                                                                                            ● Capex required for the
    2                                                        3 Mu for local market            conversion: USD 13 million in
    0                                                                                         2019
     2019                        2020              2021       2022              2023
                                           Tier3    Tier2   Total

9        Tokyo – Macquarie – June 19-20, 2019
Michelin reference partner for premium OEMs                                                                   Tires

                                                  SPORT PASSION                    LUXURY PREMIUM

          OEM
        BRANDS
       (examples)

                                            Extreme emotions & passionate   Premium brands focus on consumer
      Who are they
                                                      drivers                          experience

     Market weight                                         2%                              13%
     (Volumes of tires)                            > in € and image                 > in € and image

10   Tokyo – Macquarie – June 19-20, 2019
Mining: a successful product offering in a growing
market in line with tire consumption Tires
Surface mining tire market: The most efficient tire offer
Sell-in vs tire consumption*, 2012 – 2023e in the marketplace
130 ● XDR250 - 57’’
Sell-In
SM Sell-In Tire Market
120 SM Tire Consumption
Consumption
110 More productive with no
trade-off on tire life
Inventory
build-up
100
● XDR3 - 63’’
Inventory
90
drawdowns
80
More load on
70 the KOMATSU 930-E4
2012 2013 2014 2015 2016 2017 2018 2019 2020 2021 2022 2023 (1) Compared to BRIDGESTONE 46/90 R 57 VRDP and VRPS. Data gathered from 2012 BS
databook. And compared to MICHELIN 40.00 R 57 XDR2
*base 100 in 2012, in tonnes (2) Based on comparisons of maximum load capacity of the MICHELIN® XDR ® 3 Extra Load to the
® ®
MICHELIN XDR 3, size 53 80 R 63, as set forth in the 2018 Michelin Data Book, taking as a
11 Tokyo – Macquarie – June 19-20, 2019 reference the technical data of the Komatsu 930-E4 truck. Actual results may vary, and may be
impacted by many factors, to include road conditions, weather, environment, driving habits, tire size,
equipment and maintenance.Michelin Off-Highway Transportation: to sustainably
contribute to build, and feed & protect people Tires
● OHT customers operate in ● Tires, tracks & related
‒ Agriculture services: a key asset to improve
‒ Construction profitability and sustainability
‒ On-site Logistics
‒ Defense increasing more
● They face challenges to operate yields load
sustainably
‒ Lack of productive land
lasting
‒ Material scarcity, pollution, safety risks going
longer
faster
● In demanding, unpredictable conditions and
constrained timing
optimizing
● Benefitting from long term fundamental uptime
growth
12 Tokyo – Macquarie – June 19-20, 2019Camso: sales up +9% in Q1 2019 Tires
Material handling Agriculture
Tires, wheels and services Tracks and track systems
Sales up Sales up
Sales by segment*
40% 20%
8%
Construction PowerSport
Tires, wheels and tracks Tracks and track systems
Sales up Sales up
32%
* Source: Camso 2018
13 Tokyo – Macquarie – June 19-20, 2019Services &
Solutions
Services & Solutions
14 Tokyo – Macquarie – June 19-20, 2019Services &
Michelin, a trusted partner in mobility, is accelerating its Solutions
expansion in Services & Solutions
Purpose
Support customers’ sustainable mobility
by facilitating efficiency, productivity, security
and safety
What to do?
Understand tire and asset usage
in real-time
to rapidly develop high-value solutions
How to win?
Maximize data collection from all
types of vehicles and assets
Where to play? to build more insightful offers, leveraging
our analytics and ecosystem know-how
Worldwide // all vehicles // all businesses
focusing on three key pillars…
15 Tokyo – Macquarie – June 19-20, 2019Services &
Services & Solutions: a diverse range of offers built Solutions
on three pillars
* including tire maintenance for Trucks and Mining
Pay-per-use
models*
vehicles under contract
Connected
services**
Worldwide Presence
** examples
For transportation industry and beyond
Monetize data Predictive
maintenance
analytics
16 Tokyo – Macquarie – June 19-20, 2019Services &
Our aim: deeply understand our customers to provide Solutions
solutions that create greater value for all
● Data collection: a pre-requisite to build predictive capabilities
● We launch on this journey with a data lake that merges unique historical data sets
● We will go much further, ultimately connecting every single asset
DATALAKE Aircraft with Safran
Container Tracking
- JV with Sigfox & Argon Consulting -
Passenger Car
100% tires with RFID* Trucks & Light Trucks Military Agriculture Mining
*by end of 2019 for MICHELIN branded Trucks tires
17 Tokyo – Macquarie – June 19-20, 2019Experien-
Consumer Experiences
ces
18 Tokyo – Macquarie – June 19-20, 2019Maintain our brand leadership and strengthen
Experien-
ces
our B2C consumers link
Nurturing our
brand premiumness
Developing selection
8th most reputable activities that enable our
company worldwide
1st in automotive sector
customer to enjoy unique
mobility and becoming a
trusted partner
*Reputation Institute
19 Tokyo – Macquarie – June 19-20, 2019Materials High-Technology Materials 20 Tokyo – Macquarie – June 19-20, 2019
Leverage our expertise in high                                                                                                            Services         Materials

      performance materials

 Enriching our portfolio offers in                                                     Developing our tire recycling
 reinforced polymers                                                                   business
                 Seals
                                                                                                                          Micronized Rubber Powder

                                  Belts and
   Flexible hoses           elastomeric solutions           Medical
                                                                                                                          January 21, 2019 : LeHigh
                                                                                                                            wins Circular economy
                                                                                                                               award in Davos*

* This price is awarded by « The Circulars», an initiative of the World Economic Forum and the Forum of Young Global Leaders, run in collaboration with Accenture Strategy.

     21    Tokyo – Macquarie – June 19-20, 2019
Materials
Fenner: +3% growth in Q1 2019
● Q1 growth in each division
● ECS (conveyor belts):
‒ sales growth
‒ major contract wins
‒ a record backlog (mining and manufacturing)
‒ a highly competitive product portfolio
● AEP (technological materials):
‒ growth on strong value-creating niche
markets in line with expectations
22 Tokyo – Macquarie – June 19-20, 2019Michelin, a committed and leading player in the
Materials
Hydrogen sector
● With its expertise in the hydrogen fuel cell, notably with Symbio, Michelin is
accelerating the deployment of zero-emission mobility:
‒ by partnering with Faurecia to create a leading hydrogen fuel cell system
‒ by participating in the Zero Emission Valley project (Hympulsion), in Auvergne Rhône Alpes
Symbio Hympulsion
An OEM who designs and industrialises, A Joint venture created as part of the Zero
based on Michelin’s production strength, Emission Valley project in Auvergne Rhône
hydrogen fuel cell kits Alpes, involving public-private partners and
including Michelin (22.8%). The objective of
+300
first phase is to deploy:
Renault Kangoo
20 15 1000
H2 fuel cell for
ZE H2, Symbio trucks, light
equipped, trucks, buses… H2 stations electrolysers vehicles
circulate in Europe
23 Tokyo – Macquarie – June 19-20, 2019Continuous and consistent deployment of Michelin’s strategy
Tires Services Experiences Materials
2015-2020 Sales Sales Sales Capitalize on our
target +20% doubled tripled leadership
Conveyor belts
Reinforced polymers
Recent partnerships
and acquisitions...
Distribution Experiences:
travel and fine dining
...in line with the
2020 strategy
Capital
expenditure Telematics and High-tech materials
services
24 Tokyo – Macquarie – June 19-20, 2019June 19-20, 2019
TOKYO - MACQUARIE
Levers of
competitivenessImprove our competitiveness
● Deploy « Simplexity » program
● Improve our manufacturing efficiency and pursue industrial footprint
optimization
● Reduce our SG&A
● Optimize capital employed
Operation Empowerment Transformation
26 Tokyo – Macquarie – June 19-20, 2019Competitiveness plan vs inflation 2019-2020 ambitions
Net gain, 2019-2020
Manufacturing - Raw ~€100m
SG&A
Logistics materials
Total ~600
~300 ~300 Total ~500
~250
~200
~50
Competitiveness gains* Inflation 2019-2020 Competitiveness Inflation
2019-2020 plan
* before inflation and including avoided costs
27 Tokyo – Macquarie – June 19-20, 2019Beyond 2020: reinforce our manufacturing efficiency
with competitiveness gains boosted by 35%
● Produce locally and increase flexibility to constantly adapt
to local demand
● Optimise low cost plants loading and ramp-up
● Increase the number of large plants and their loading
(>100ktons)
● Process standardization
● Digital Manufacturing
● Empowerment and Michelin Manufacturing Way deployment
● Simplexity
28 Tokyo – Macquarie – June 19-20, 2019Footprint evolution to answer tire market geo-mix
Production by region in 2018 (in KT) Production by region in 2023 (in KT)
including Camso and Multistrada
Asia
Asia
14% South & Central 26% South & Central
35% 6% America 27% America
Eastern Europe
Eastern Europe
13%
North America 6%
North America
29% 12%
32% Western Europe
Western Europe
2018 2023
29 Tokyo – Macquarie – June 19-20, 2019Digital manufacturing: 50 demonstrators launched
Assets Quality Supply People Automation
Assisted root cause quality
control
AGV, ROBOTS, VISION
End to End integration
1. AUTOMATISATION
FACTORY FLOW
On time inventory / 2. WORKSTATION
Quality data collection (SPC, intelligent lots AUTOMATISATION
Vision)
3. AUTOMATISATION
CONTROL – VISION
30 Tokyo – Macquarie – June 19-20, 2019Beyond 2020: keep on targeting SG&A benchmark levels
2018 SG&A split (in €millions) Zoom SG&A excluding distribution
(in % of sales )
Best Tier1 competitor Michelin
20%
14% M&S
17%
15% 14%
31% R&D
10%
G&A
5%
39%
Distribution 0%
16%
2018 2023
31 Tokyo – Macquarie – June 19-20, 2019Levers to improve our competitiveness 32 Tokyo – Macquarie – June 19-20, 2019
June 19-20, 2019
TOKYO - MACQUARIE

                     2019 guidance
                    confirmed, on track to
                    our 2020 ambitions
2019 market scenario: PC/LT markets slightly up and Truck markets
stable in an uncertain environment; growth in Specialty markets
PC/LT: +0% / +1% TRUCK: ~ -1% SPECIALTIES : +3% / +5%
vs +0,5% / +1% vs -0,5% / +0,5%
● OE: Lower demand, ● Stable demand in Europe ● Mining tires: sustained
especially in China and growth in demand (+4% to
● Stable demand in North +5%), in line with actual tire
Europe America versus very high consumption
● RT: Markets slightly up in prior-year comparatives
mature economies and ● Off-road tires: Stable
● Slight contraction in China Infrastructure tire sales,
gradually improving in China
and the rest of the world Agricultural tires slightly
down
● ≥18” demand up by around
10% ● Growth in the Two-Wheel
Commuting and Aircraft
segments
34 Tokyo – Macquarie – June 19-20, 20192019 Scenario*
2019
Cost impact of raw material prices and customs
duties ~ €(100) million
(primarily in H1)
Slightly positive based on
Currency effect
March 2019 rates**
Effective tax rate Standard ETR reduced to 26%***
Net price-mix/raw materials effect Positive
Competitiveness plan gains vs. inflation Positive
*Based on the following average prices and exchange rates for the year: Natural rubber: $1.43/kg; butadiene (US, Europe and Asia): $1,174/t; Brent: $65/bbl; EUR/USD: 1.14
**See slide 40
***Based on currently available information
35 Tokyo – Macquarie – June 19-20, 20192019 guidance
2019
Growth in line
Volumes
with the markets
Segment operating income
at constant exchange rates
before the estimated €150m additional contribution from Camso >2018
and Fenner
Structural FCF >€1,450m
including the positive €150m accounting impact of IFRS 16
36 Tokyo – Macquarie – June 19-20, 2019On the road to our 2020 objectives
Deliver structural FCF > €1,700m Deliver an after-tax ROCE ≥ 15% excluding goodwill
as from 2020 as from 2020 (in %)
(in € millions) ROCE ≥ 20.3%
>1,700 after taxes
18.9% 18.9%
1,509 >1,450 ROCE 17.2%
before taxes
1,274 >1,300
961
833
13.6% 14.0% ≥15.0%
11.9%
2017 2017 2018* 2020
2015 2016 2017 2018 2019e 2019e 2020 target
Standard
excl. target corporate 31 % 28 % 26 %
tax rate
IFRS16
impact including goodwill, excluding goodwill, acquired intangibles,
acquired intangibles, associates and joint ventures
associates and joint
37 Tokyo – Macquarie – June 19-20, 2019 ventures2018-2020: profitability levers to reach around €3.7bn EBIT
in 2020 at constant forex
2018-2020 EBIT growth (in €millions)
Volume
& Mix ~3,700 -366
D&A
Price offsetting Competitiveness Other Acquisitions
3,141 Raw Material plan beating
FX
costs: inflation:
2017-
neutral +€50m per year
2018
2,692
2016 2018 2020 2020
at 2016 Forex at 2016 Forex
38 Tokyo – Macquarie – June 19-20, 2019June 19-20, 2019
TOKYO - MACQUARIE
AppendicesPC Tire Market: RT demand confirms its rebound in China and keeps on growing in North
America, whereas it remains weak in Europe, notably penalized by Turkey and Germany.
Continuing decline in OE demand in every zone.
April 2019 / 2018
Market Europe including Europe excluding North America South America China
Russia & CIS * Russia & CIS *
Original equipment tires -10% -11% -9% -5% -17%
Replacement tires -1% -3% +1% -2% +6%
YTD (April 2019)
Market Europe including Europe excluding North America South America China
Russia & CIS * Russia & CIS *
Original equipment tires -6% -7% -8% -5% -13%
Replacement tires -2% -1% +4% -6% +3%
* Turkey included
40 Tokyo – Macquarie – June 19-20, 2019TB Tire Market: on very high basis of comparison in every zone, dynamic OE demand in Americas, while declining in
Europe. RT demand still penalized by the Turquish crisis in Europe, whereas in North America, it is still affected, on high basis
of comparison, by the counter effect of Chinese tire pre-buy ahead of additional tariffs implementation in February.
April 2019 / 2018
Market (Radial + Bias) Europe including Europe excluding North America South America
Russia&CIS * Russia&CIS *
Original equipement tires -7% -7% +8% +14%
Replacement tires -2% -4% -9% +2%
YTD (April 2019)
Market (Radial + Bias) Europe including Europe excluding North America South America
Russia&CIS * Russia&CIS *
Original equipment tires -3% -2% +11% +26%
Replacement tires -3% -4% -9% -1%
* Turkey included
41 Tokyo – Macquarie – June 19-20, 2019Sales up 9.3% at constant exchange rates, lifted by the contribution from
acquisitions, strong prices and the sustained improvement in the mix
YoY change
(in € millions and %)
+9.3%
Group growth +7.3 % +103 5,809
+104 5,706
+409 -25 Currency effect
(+2.0 %)
Organic growth Price-mix
Volumes (+2.0 %)
(-0.5 %) o/w mix +0.7%
5,218
External growth
Changes in scope
of consolidation*
(+7.8 %)
Q1 2018 Q1 2019 Sales Q1 2019
Sales at constant Sales
exchange rates
* consolidation of Fenner and Camso, deconsolidation of TCi
42 Tokyo – Macquarie – June 19-20, 2019Q1: Firm prices and sustained mix enrichment; volumes impacted
by declining demand
YoY quarterly change 2018-2019
(in %)
Volumes Price-mix Currency effect
Q1 Q2 Q3 Q4 Q1 Q1 Q2 Q3 Q4 Q1 Q1 Q2 Q3 Q4 Q1
2018 2019 2018 2019 2018 2019
2.6 2.9 3.4
2.6
2.0 2.0
1.5
0.5 0.5
-0.5 -0.3
-2.3 -1.6
-5.6
43 Tokyo – Macquarie – June 19-20, 2019
-7.7Q1 2019: dynamic price-mix in every business, volume growth in Truck,
strong contribution from acquisitions in Specialties
(in € millions) Q1 2018 Q1 2018
Q1 2019 Change
restated * reported
SR1 sales 2,788 2,783 +0 % 2,772
SR2 sales 1,550 1,472 +5 % 1,368
SR3 sales 1,471 963 +53 % 1,078
SR3 excl. Fenner/Camso 1,007 963 +5 %
* Following the acquisition of Camso and the merger of the Off-Road operations, minor adjustments in the scope of the business segments. See the impact on 2018 SOI
by reporting segment on slide 21.
● SR1: stable sales thanks to a solid price-mix; currency effect offsets the deconsolidation of TCi
● SR2: sales lifted by volume growth and a robust price-mix; sustained growth in services and solutions
● SR3: stable volumes and dynamic price-mix effect
44 Tokyo – Macquarie – June 19-20, 20192016-2018: +€200m/year organic EBIT growth
2016-2018 EBITgrowth (in €millions)
+ 393
+779
-896
+632 -596
+597
Price
-22 -101 +56 3,141
Raw Compe- D&A &
Inflation Fenner
materials titiveness start up Others
costs acquisition
2,692
Price vs Raw Competitiveness vs
Volume materials: Inflation:
& Mix -€117m +€36m
2016 2018
45 Tokyo – Macquarie – June 19-20, 2019 at 2016 forexChina: MICHELIN brand leadership on a structurally growing
market driven by ≥ 18’’ demand
China ≥18’’ China
PC ≥ 18’’ tires in China* 193 PC tires in China* CAGR
163 18-21:
133 171 5%
115 156
113 124
100 128 CAGR
113 18-21: 100 100
97
100 16% 100
100 97
94 90
2017 2018 2019e 2020e 2021e 2017 2018 2019e 2020e 2021e
*base 100 in 2017, in units OE RT *base 100 in 2017, in units
OE RT
42,2%
Brand Power Score in China** in % , based on total consumers in 2018
11.8% 11.7% 9.8% 9.0% 7.5%
4.9% 3.2%
Tokyo – Macquarie – June 19-20, 2019
46 Michelin Bridgestone Goodyear Dunlop Pirelli Continental Hankook Kumho
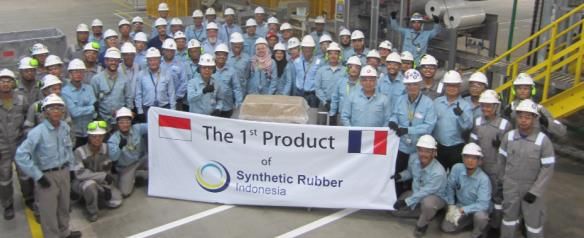
** BCM study conducted by market research institute Millward Brown, based on the reduced brand list of 8 brandsMichelin is boasting a comprehensive manufacturing
base in a fast-growing region, Indonesia
Eco-friendly natural rubber
Joint venture with the Barito Pacific group
Reforestation of 88,000 hectares (o/w ≈45,000 ha. of rubber trees)
Synthetic rubber
Joint venture with the PT Chandra ASRI group
New plant with annual production capacity of 120 KT
Tier 2 and Tier 3 tires
Acquisition of Multistrada
o/w a plant with annual installed production capacity of 180 KT
47 Tokyo – Macquarie – June 19-20, 2019MICHELIN, THE premium brand
Michelin position at Super Sport OEMs
Leader Leader Leader Leader Leader Leader Co-leader Co-leader
representing 98 % of Super Sport OEMs market
Technologies
Acoustic Selfseal Track connect Premium Touch Acorus
MICHELIN Acoustic technology A technology that allows The first connected tire A unique sidewall with a A flexible wheel that eliminates
enhances the driving experience the immediate and available on the market to patented “velvet-effect” flat tires due to potholes and
by significantly reducing vehicle definitive self-repair of the upgrade the performance finish curb-shocks, for a hassle-free
interior noise tire on track driving experience
48 Tokyo – Macquarie – June 19-20, 2019Partner dealership chains* that showcase the Group’s products
● Michelin boasts industry-leading global coverage
North Russia & CIS 125
America
Europe 2,850 China
2,520
1,450
Africa, India,
Middle East
70 Penta
ASEAN
South 261
America 140
● Partner wholesalers: NTW, Ihle, Meyer Lissendorf
● A vast network of strategic retailers* as of late 2018: ~ 7,400 including Penta in Indonesia following the acquisition of
Multistrada
*Proprietary or franchised dealers, plus minority stakes in partners
49 Tokyo – Macquarie – June 19-20, 2019Continuing to adapt Michelin’s manufacturing footprint
Capacity reduction
2016-2020
Europe: closure of three
retreading centers and a semi-
finished products facility
UK: closure of the Ballymena
Truck tire plant (76 kt)
Capacity increases
UK: closure of the ≤16” PC/LT 2016-2020
tire plant in Dundee (52kt) PC/LT, China: +20 %
Capacity raised to 240 KT
PC/LT, Thailand: +10%
Capacity raised to 165 kt
Capacity increases
2018-2020 Truck, Thailand: +24%
Mexique : new PC/LT plant Capacity raised to 75 kt
Capacity raised to 60 KT Capacity increases
2018-2019
Synthetic rubber, Indonesia: start-up
of a new plant
PC, Truck and Two-wheel tires,
Indonesia: acquisition of Multistrada
Capacity up to 180 kt
50 Tokyo – Macquarie – June 19-20, 2019Investing to create value
● Reducing Capex on historical core-business Evolution
Capital Capex et and
expenditure amortissements
depreciation::
towards depreciation level (en€ milliards d’€, à parités courantes)
(in billions, at current exchange rates)
‒ Marginal low cost investments first
‒ MICHELIN brand focused
2.0
‒ Optimized maintenance Capex & molds
~1.9
● Reinforcing Michelin footprint where the growth is 1.8
~1.8
‒ with a Capex/unit now back to best market 1.7
practices ~1.6
~1.5
● Allowing Capex growth in Specialties businesses
(SR3) 1.35 1.35
● Developing new territories: fleet management
solutions & High Tech Materials 1.0
excluding JVs
2012 2017 2018 2019e 2020e
● Speeding up a comprehensive
digitization plan Capex Depreciation and *including Camso and Fenner
amortization
51 Tokyo – Macquarie – June 19-20, 2019Sustained and stronger than expected structural free cash flow,
supported in 2018 by disciplined working capital management
Structural free cash flow 1,509
1,274
(in € millions)
961
833
2015 2016 2017 2018
Free cash flow(1) 653 1,024 662 -2,011
Acquisitions(2) (312) (16) (476) (3,225)
Working capital impact of raw materials costs(3) 132 79 (178) (60)
Capitalized interest on OCEANE bonds, paid upon
(193) -
redemption(4)
Structural free cash flow(1) – (2) – (3) – (4) 833 961 1,509 1,274
52 Tokyo – Macquarie – June 19-20, 2019High free cash flow and a robust financial position
Cash conversion ratio Net debt*/EBITDA*
(in % - structural free cash flow/net income before non-
recurring items)
85 0.90
from 0.4
71 to 0.6
59 60 0.26 0.23 0.18
2015 2016 2017 2018 2015 2016 2017 2018 2020e
● The net debt/EBITDA ratio peaked in 2018 due to cash out for acquisitions during the year, but is expected to
ease to between 0.4 and 0.6 by 2020
● Moody’s, Standard & Poor's and Fitch all confirmed Michelin’s A-/A3 credit rating
● Two successful bond issues in 2018 totaling €2.9bn (of which a 20-year tranche for €750m)
*See the 2018 Registration Document, notes 3.7.2 and 26 to the consolidated financial statements
53 Tokyo – Macquarie – June 19-20, 2019A robust balance sheet after recent acquisitions, confirmed
by the rating agencies
Gearing Long-term ratings confirmed following the
Net debt/equity, in % Multistrada acquisition
31
S&P A-2
Short term
Moody’s P-2
22
S&P A-
Long term
Moody’s A3
12 11
9
7 6 S&P Stable
Outlook
2 Moody’s Stable
2011 2012 2013 2014 2015 2016 2017 2018
54 Tokyo – Macquarie – June 19-20, 2019A confortable cash position
Debt maturities at Dec. 31, 2018 (carrying amount, in € millions)
4 000 Loans from financial institutions
Securitization
3 500
Bond
3 000 CP
Derivatives and leases
2 500
Cash and cash equivalents
2 000 Cash management Financial Assets
Confirmed Back-up Facilities
1 500
1 000
500
0
Treasury 2019 2020 2021 2022 2023 2024 2025 and
and beyond
Back-up lines
55 Tokyo – Macquarie – June 19-20, 2019Sustained shareholder return policy
● 2018 dividend of €3.70 per share, for a payout ratio of 36.4%*
● Share buyback programs
3.70* ─ 2015-2016: €750m in buybacks and
3.55 4.5% of outstanding shares canceled
3.25
2.85 ─ 2017: €101m in buybacks and
2.5 2.5 0.5% of outstanding shares
2.4
2.1 40.6% canceled
37% 36.5% 36.4%
1.78 36.0%
35% ─ 2018: €75m in buybacks and
30% 28.7% Group commitment ≥ 35%* 0.4% of outstanding shares
canceled to offset the dilutive
30% impact of share-based
compensation
─ 2019-2023: €500m share
2010 2011 2012 2013 2014 2015 2016 2017 2018 buyback program over the
next five years
* Of consolidated net income before non-recurring items
56 Tokyo – Macquarie – June 19-20, 20192018 sales by currency and EBIT impact
2018 FY Dropthrough 2018 FY Dropthrough
% of sales € change vs. sales/EBIT* % of sales € change vs. sales/EBIT*
currency currency
ARS 1% +65% 80% - 85% MXN 1% +7% 25% - 30%
AUD 2% +7% 80% - 85% PLN 1% 0% 25% - 30%
BRL 3% +20% -20% / - 30% RUB 1% +12% 25% - 30%
CAD 3% +4% 25% - 30% SEK 1% +6% 80% - 85%
CNY 6% +2% 25% - 30% THB 1% -0% -100% / -130%
EUR 34% NA - TRY 1% +34% 80% - 85%
GBP 3% +1% 25% - 30% USD 35% +5% 25% - 30%
INR 1% +10% 25% - 30% ZAR 1% +3% 80% - 85%
JPY 1% +3% 80% - 85% Other 4% 80% - 85%
*actual dropthrough linked to the export/manufacturing/sales base
57 Tokyo – Macquarie – June 19-20, 2019Raw materials
in USD/kg
Raw material purchases in 2018 (€4.9bn) 300
7% €/$ exchange rate: 250
200 RSS3
Textiles Average Q1 2018: 1.228
150
10 % 25 % -7 % 100
Steel cord Natural rubber 50 TSR20
Average Q1 2019: 1.137
0
2015 2016 2017 2018 2019
15 % indexed
100 300
Chemicals
80
Brent, in USD
250
60
25 % 200
18 %
40
Synthetic
Filler 20 150
Synthetic rubber
rubber
0 Manufacturing BLS
2015 2016 2017 2018 2019 100
2015 2016 2017 2018 2019
58 Tokyo – Macquarie – June 19-20, 2019Natural Rubber price trend
At end of March 2019 (per kg, base 100 in Q2’16)
TSR20 in $ RSS3 in $ Quarterly average TSR20 in $ & quarterly change in %
1,4 1,3 1,7 2,1 1,5 1,5 1,4 2,5 1,4 1,3 1,3 1,4
180,0 +20 % -4 % +26 % +26 % -27 % +0 % -7 % +2 % -3 % -6 % -5 % +10 %
160,0
140,0
120,0
100,0
80,0
60,0
40,0
20,0
0,0
Q2'16 Q3'16 Q4'16 Q1'17 Q2'17 Q3'17 Q4'17 Q1'18 Q2'18 Q3'18 Q4'18 Q1'19
Source : SICOM
59 Tokyo – Macquarie – June 19-20, 2019Brent price trend
At end of March 2019 (per barrel, base 100 in Q2’16)
Brent in $ Quarterly average Brent in $ & quarterly change in %
47 47 51 55 51 52 61 67 75 76 68 64
180 +33 % +0 % +9 % +7 % -7 % +2 % +18 % +9 % +11 % +1 % -10 % -7 %
160
140
120
100
80
60
40
20
0
Q2'16 Q3'16 Q4'16 Q1'17 Q2'17 Q3'17 Q4'17 Q1'18 Q2'18 Q3'18 Q4'18 Q1'19
60 Tokyo – Macquarie – June 19-20, 2019Butadiene price trend
At end of March 2019 (per ton, base 100 in Q2’16)
Butadiène Europe Quarterly average Butadiene in $ & quarterly change in %
618 670 773 1 363 1 500 783 800 808 1037 1142 1058 865
300 +20 % +8 % +15 % +76 % +10 % -48 % +2 % +1 % +28 % +10 % -7 % -18 %
250
200
150
100
50
0
Q2'16 Q3'16 Q4'16 Q1'17 Q2'17 Q3'17 Q4'17 Q1'18 Q2'18 Q3'18 Q4'18 Q1'19
61 Tokyo – Macquarie – June 19-20, 2019Outstanding bond issues (as of December 31, 2018)
MICHELIN MICHELIN MICHELIN MICHELIN
Issuer CGEM CGEM CGEM CGEM CGEM
Luxembourg Luxembourg Luxembourg Luxembourg
Issue Senior Note Senior Note Senior Note Senior Note Senior Note Senior Note Senior Note Senior Note Senior Note
Type Bond Bond Bond Convertible Convertible Bond Bond Bond Bond
Principal Amount € 750 mn € 1'000 mn € 750 mn $ 600 mn $ 500 mn + TAP $100 mn € 302 mn € 300 mn € 300 mn € 400 mn
Offering price 99,099% 99,262% 99,363% 95,50% 100% & 103,85% 98,926% 99,967% 99,081% 99,912%
A- (S&P) A- (S&P) A- (S&P) A- (S&P) A- (S&P) A- (S&P) A- (S&P) A- (S&P) BBB+ (S&P)
Rating corporation
A3 (Moody's ) A3 (Moody's ) A3 (Moody's ) A3 (Moody's ) A3 (Moody's ) A3 (Moody's ) A3 (Moody's ) A3 (Moody's ) Ba a 1 (Moody's )
at Issuance date
Current coporation rating A- (S&P) ; A3 (Moody's) ; unsolicited A- (Fitch)
ZERO ZERO
Coupon 0,875% p.a 1,75% p.a 2,50% p.a 3,25% p.a 1,125% p.a 1,75% p.a 2,75% p.a
Conv premium Conv premium 128%
05/jan/2017 & 21/sep/2015 &
Issue Date 3-sept.-18 3-sept.-18 3-sept.-18 05/jan/2018 19-mai-15 19-mai-15 11-juin-12
25/apr/2017 27/sep/2016
Maturity 3-sept.-25 3-sept.-30 3-sept.-38 10-nov.-23 10-janv.-22 30-sept.-45 28-mai-22 28-mai-27 20-juin-19
Annual Annual Annual Annual Annual Annual Annual
Interest payment N/A N/A
Sept 03 Sept 03 Sept 03 Sept 30 May 28 May 28 June 20
ISIN FR0013357845 FR0013357852 FR0013357860 FR0013309184 FR0013230745 XS1298728707 XS1233732194 XS1233734562 XS0794392588
€ 100'000 with min. € 100'000 with min. € 100'000 with min. $ 200'000 with min. $ 200'000 with min. € 1'000 with min. € 1'000 with min. € 1'000 with min. € 1'000 with min.
Denomination tradable amount tradable amount tradable amount tradable amount tradable amount tradable amount tradable amount tradable amount tradable amount
€ 100'000 € 100'000 € 100'000 $ 200'000 $ 200'000 € 1'000 € 1'000 € 1'000 € 1'000
62 Tokyo – Macquarie – June 19-20, 20192018: another year in line with our 2020 roadmap
Group segment operating income and margin & ROCE*
33,000
000 16%
14.0%
11.1% 12.2% 12.9% 13.6%
12.8% 14%
22,500
500 11.9% 12.2%
10.9% 11.1%
10.5% 12%
12.5% 12.6%
22,000
000 12.1%
9.4% 11.3% 11.0% 10%
5.6% 9.5%
11,500
500 8%
5.6% 5.8% 2,577 2,692 2,742 2,775
2,423 2,234 6%
11,000
000 2,170
1,945
5.4% 1,695 4%
500
500 920 862 2%
00 0%
2008 2009 2010 2011 2012 2013 2014 2015 2016 2017* 2018*
Operating income* (in €m) Operating margin* (as a % of sales) ROCE after tax (in %)
* With standard taxe rate at 28% for 2017 and 26% for 2018 and excluding goodwill, acquired intangibles, associates and joint ventures for 2017 and 2018
63 Tokyo – Macquarie – June 19-20, 2019Disclaimer "This presentation is not an offer to purchase or a solicitation to recommend the purchase of Michelin shares. To obtain more detailed information on Michelin, please consult the documents filed in France with Autorité des marchés financiers, which are also available from the http://www.michelin.com/eng/ website. This presentation may contain a number of forward-looking statements. Although the Company believes that these statements are based on reasonable assumptions as at the time of publishing this document, they are by nature subject to risks and contingencies liable to translate into a difference between actual data and the forecasts made or inferred by these statements." 64 Tokyo – Macquarie – June 19-20, 2019
Contacts

                                            Edouard de PEUFEILHOUX
                                            Humbert de FEYDEAU

                                            +33 (0)4 15 39 84 68

                                            27, cours de l’île Seguin
                                            92100 Boulogne-Billancourt – France

                                            23, place des Carmes Dechaux
                                            63040 Clermont-Ferrand Cedex 9

                                            investor-relations@michelin.com

65   Tokyo – Macquarie – June 19-20, 2019
You can also read