48/2020 The European Emissions Trading System and the German and Polish Electricity Market
←
→
Page content transcription
If your browser does not render page correctly, please read the page content below

CLIMATE CHANGE

    48/2020
 The European Emissions
 Trading System and the
 German and Polish
 Electricity Market
 Influence of market structures and market regulation
 on the carbon market
 Case Study Report

German Environment Agency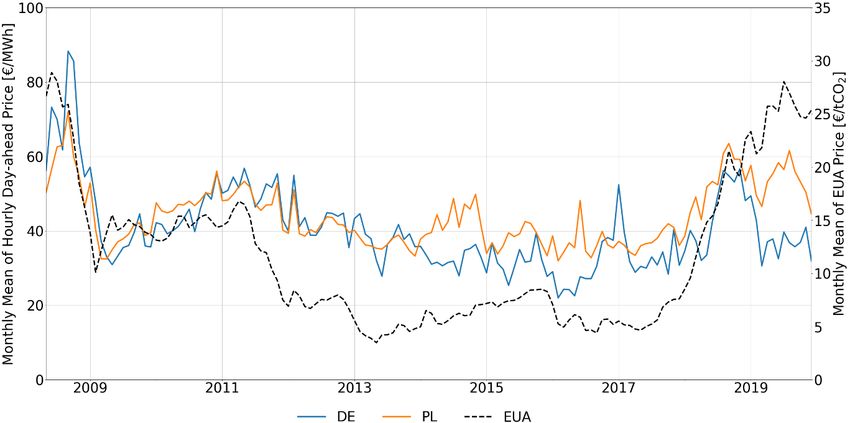
CLIMATE CHANGE 48/2020

Ressortforschungsplan of the Federal Ministry for the
Enviroment, Nature Conservation and Nuclear Safety

Project No. (FKZ) 3718 42 002 0
Report No. FB000418/ZW,1,ENG

The European Emissions Trading System and
the German and Polish Electricity Market
Influence of market structures and market regulation on
the carbon market

Case study report

by
Jan Abrell, Regina Betz, Mirjam Kosch
Zurich University of Applied Sciences (ZHAW), Winterthur

On behalf of the German Environment Agency
Imprint

Publisher
Umweltbundesamt
Wörlitzer Platz 1
06844 Dessau-Roßlau
Tel: +49 340-2103-0
Fax: +49 340-2103-2285
buergerservice@uba.de
Internet: www.umweltbundesamt.de

 /umweltbundesamt.de
 /umweltbundesamt

Report performed by:
Zurich University of Applied Sciences (ZHAW)
Bahnhofplatz 12
8400 Winterthur
Switzerland

Report completed in:
August 2020

Edited by:
Section V 3.3 Economic Aspects of Emissions Trading, Monitoring, Evaluation
Claudia Gibis

Publication as pdf:
http://www.umweltbundesamt.de/publikationen

ISSN 1862-4804

Dessau-Roßlau, December 2020

The responsibility for the content of this publication lies with the author(s).
CLIMATE CHANGE - The European Emissions Trading System and the German and Polish Electricity Market

Abstract
This report analyses the interaction of the European Emissions Trading System (EU ETS) and
the German and Polish electricity markets along two main questions: How do EU ETS design
features affect the environmental effectiveness of the system and the quality of the carbon price
signal? How do electricity market design features in Poland and Germany affect the carbon price
induced abatement in the power sector? Based on publicly available data and expert interviews,
we derive three main findings on the impact of the electricity market structure on the quality of
the EUA price.
First, the diversity and age of the capacity portfolio determine the response of the electricity
system to the EUA price. In systems with relatively young gas-fired plants, observing a fuel-
switching is likely before major investment taking place. Second, complementary policies such
as renewable or combined heat and power support and retail price policies (as the price cap for
power in Poland) reduce the role of the carbon price. The former for dispatching and investment
decisions and the latter for demand reduction and energy efficiency investments. Third,
complementary policies also reduce the predictability of the carbon price as they affect
investments and demand for emission allowances. The market stability reserve (MSR) - an
automatic adjustment mechanism within the EU ETS – can reduce the impact of these effects on
the allowance price to some extent, but does not remove all uncertainties.
This case study is part of the project “Influence of market structures and market regulation on the
carbon market” that aims to identify the impact of market structures and regulations on carbon
markets and to investigate the interdependencies between carbon and energy markets in
Europe, California, China, South Korea, and Mexico.
Kurzbeschreibung
Dieser Bericht analysiert die Interaktion des Europäischen Emissionshandelssystems (EU EHS)
und des deutschen und polnischen Strommarktes entlang zweier Hauptfragen: Wie wirken sich
die Gestaltungsmerkmale des EU EHS auf die ökologische Wirksamkeit des Systems und die
Qualität des CO2-Preissignals aus? Wie wirken sich die Gestaltungsmerkmale des Strommarktes
in Polen und Deutschland auf die durch das CO2-Preissignal induzierte Emissionsreduktion im
Stromsektor aus? Basierend auf öffentlich verfügbaren Daten und Experteninterviews, ziehen
wir drei wichtige Schlussfolgerungen zu den Auswirkungen der Strommarktstruktur auf die
Qualität des EUA-Preises.
Erstens bestimmen die Vielfalt und das Alter des Kapazitätsportfolios die Reaktion des
Elektrizitätssystems auf den EUA-Preis. In Systemen mit relativ jungen (Gas-)Kraftwerken
werden wir eher einen Wechsel von Kohle zu Gas beobachten bevor größere Investitionen
getätigt werden. Zweitens reduzieren flankierende Politiken wie die Förderung erneuerbarer
Energien oder der Kraft-Wärme-Kopplung sowie Preispolitiken (wie beispielsweise die
Preisobergrenze für Strom in Polen) die Rolle des CO2-Preises. Erstere für Dispatch- und
Investitionsentscheidungen und letztere für Nachfragereduktion und
Energieeffizienzinvestitionen. Drittens reduzieren begleitende Maßnahmen auch die
Vorhersagbarkeit des CO2-Preises, da sie die Investitionen und die Nachfrage nach
Emissionszertifikaten beeinflussen. Die Marktstabilitätsreserve (MSR) - ein automatischer
Anpassungsmechanismus innerhalb des EU EHS - kann die Auswirkungen dieser Effekte auf den
Zertifikatspreis bis zu einem gewissen Grad verringern, beseitigt aber nicht alle Unsicherheiten.
Diese Fallstudie ist Teil des Projekts “Influence of market structures and market regulation on the
carbon market”, welches zum Ziel hat, die Auswirkungen der Marktstrukturen und
Regulierungen auf CO2-Märkte zu identifizieren und die Abhängigkeiten von CO2- und
Energiemärkten in Europa, Kalifornien, China, Südkorea und Mexiko zu untersuchen.

                                                         5
CLIMATE CHANGE - The European Emissions Trading System and the German and Polish Electricity Market
Table of content
List of figures ........................................................................................................................................... 8
List of tables ............................................................................................................................................ 8
List of abbreviations ................................................................................................................................ 9
Summary and conclusions ..................................................................................................................... 10
Zusammenfassung und Schlussfolgerungen ......................................................................................... 13
1 Introduction................................................................................................................................... 17
2 Design and regulation of the EU ETS ............................................................................................. 19
2.1 Allowance supply .................................................................................................................. 21
2.1.1 Allowance cap and long-term targets ............................................................................... 21
2.1.2 Initial allocation of allowances ......................................................................................... 21
2.1.3 Banking and borrowing ..................................................................................................... 24
2.1.4 Provisions for additional allowances supply ..................................................................... 24
2.1.5 Market stability mechanisms ............................................................................................ 24
2.1.6 Voluntary cancellation of allowances ............................................................................... 25
2.2 Demand ................................................................................................................................. 25
2.2.1 Coverage ........................................................................................................................... 25
2.2.2 Market participation ......................................................................................................... 26
2.3 Transaction and market oversight rules ............................................................................... 27
2.3.1 Legal nature of allowances ............................................................................................... 27
2.3.2 Fiscal nature of allowances ............................................................................................... 27
2.3.3 Market places.................................................................................................................... 27
2.3.4 Transparency regulation ................................................................................................... 28
3 Assessing the EU ETS design and the quality of the allowance price............................................ 29
3.1 Volatility ................................................................................................................................ 30
3.2 Reflection of MAC ................................................................................................................. 30
3.3 Long-term predictability ....................................................................................................... 31
3.4 Environmental effectiveness of EU ETS ................................................................................ 31
4 Introduction to German and Polish electricity markets ................................................................ 32
4.1 Market design and structure ................................................................................................ 32
4.1.1 Market Design ................................................................................................................... 32
4.1.2 Market Structure and Dynamics ....................................................................................... 33
4.2 Wholesale markets and dispatch .......................................................................................... 43
4.3 (Dis)investment and interacting policies .............................................................................. 45
4.3.1 Regulation of generation investments and disinvestments (closures)............................. 45
6CLIMATE CHANGE - The European Emissions Trading System and the German and Polish Electricity Market
4.3.2 Capacity markets............................................................................................................... 47
4.3.3 Promotion policies ............................................................................................................ 48
4.4 Retail market and consumer price regulation ...................................................................... 50
5 Assessing electricity markets and the EU ETS’ impact on abatement .......................................... 52
5.1 Pass-through of carbon cost to wholesale electricity market prices .................................... 52
5.1.1 Observations ..................................................................................................................... 52
5.1.2 Impact of market structure and design ............................................................................ 53
5.2 Fuel switch: Impact of carbon price on dispatch .................................................................. 53
5.2.1 Observations ..................................................................................................................... 53
5.2.2 Impact of market structure and design ............................................................................ 55
5.3 Low carbon investment/disinvestment ................................................................................ 56
5.3.1 Observations ..................................................................................................................... 57
5.3.2 Impact of market structure and design ............................................................................ 57
5.4 Demand reduction and pass-through of carbon cost to end consumer prices .................... 59
5.4.1 Observations ..................................................................................................................... 59
5.4.2 Impact of market structure and design ............................................................................ 61
References ............................................................................................................................................. 62
A. Overview Market Stability Reserve (MSR) .................................................................................... 67
B. Electricity market design ............................................................................................................... 69
C. Fuel switch potential ..................................................................................................................... 74
7CLIMATE CHANGE - The European Emissions Trading System and the German and Polish Electricity Market
List of figures
Figure 1: Allocation of Allowances in the EU ETS .................................................... 22
Figure 2: Compliance demand in the combustion sector (emissions not covered by
free allocation) ......................................................................... 23
Figure 3: Verified Emissions under the EU ETS ....................................................... 26
Figure 4: Development of EUA prices ..................................................................... 29
Figure 5: Installed capacities in Germany ............................................................... 34
Figure 6: Installed capacities in Poland ................................................................... 35
Figure 7: Planned power plant investments (as of 2019) ....................................... 36
Figure 8: German Market Shares in Conventional Generation Capacity (2018) ..... 37
Figure 9: Polish Market Shares in Conventional Generation Capacity (2018) ........ 39
Figure 10: German generation mix ......................................................................... 40
Figure 11: Polish generation mix ............................................................................. 41
Figure 12: Annual net-export of electricity ............................................................. 42
Figure 13: Timeline German electricity market....................................................... 43
Figure 14: Timeline Polish electricity market .......................................................... 44
Figure 15: Wholesale electricity and EUA prices ..................................................... 52
Figure 16: Generation cost and EUA price .............................................................. 54
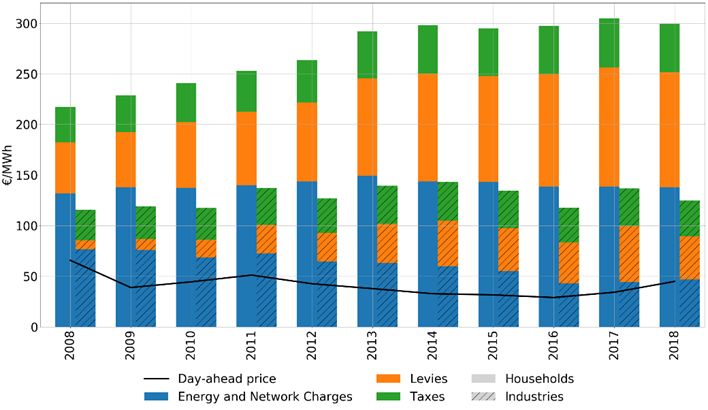
Figure 17: Retail prices for households and industries - Germany ......................... 60
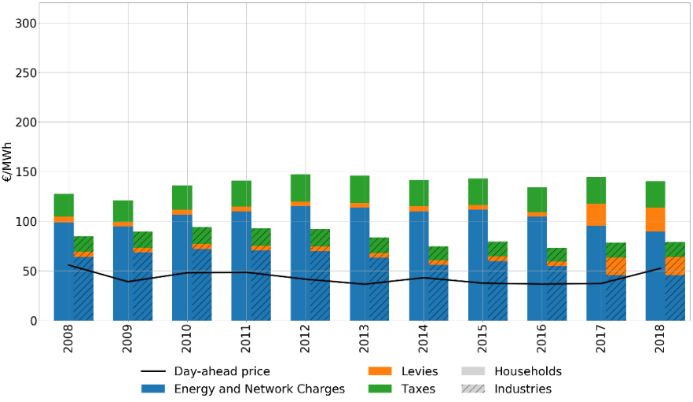
Figure 18: Retail prices for households and industries - Poland ............................. 60
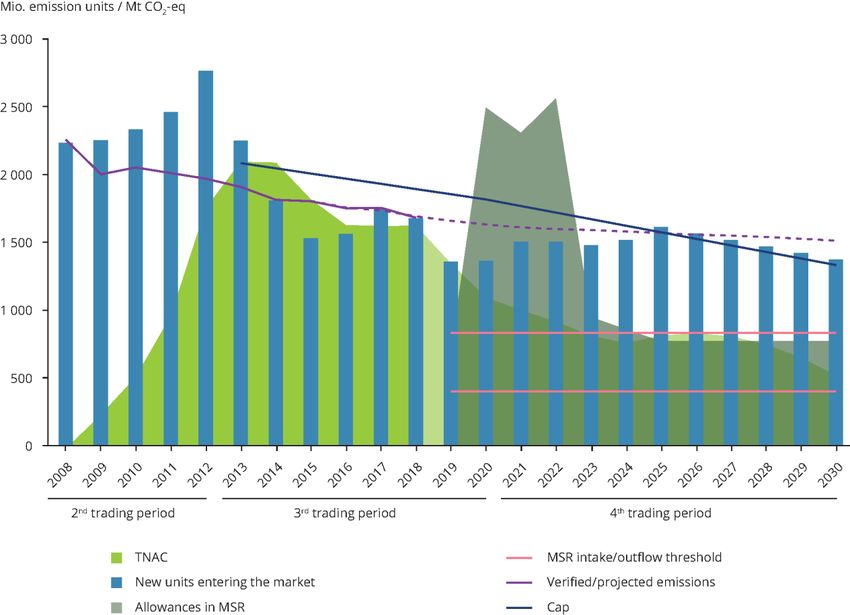
Figure 19: Allowance cap, long-term targets and market stability reserve
(installations) ............................................................................ 67
Figure 20: Timeline German electricity market....................................................... 69
Figure 21: Timeline Polish electricity market .......................................................... 71
List of tables
Table 1: Interview partners ..................................................................................... 18
Table 2: Overview supply and demand side design features in the EU ETS............ 20
Table 3: Overview transaction and market oversight rules .................................... 27
Table 4: Comparison German and Polish electricity market ................................... 32
Table 5: Ownership structure of Germany electricity producers............................ 38
Table 6: Ownership structure of Polish electricity producers ................................. 39
Table 7: Total number of allowances in circulation in 2018 ................................... 68
Table 8: German electricity market design ............................................................. 69
Table 9: Polish electricity market design ................................................................. 72
Table 10: Fuel switching potential in Germany (2017) ........................................... 75
Table 11: Fuel switching potential in Poland (2017) ............................................... 76
8CLIMATE CHANGE - The European Emissions Trading System and the German and Polish Electricity Market
List of abbreviations
BNetzA Bundesnetzagentur
CDM Clean Development Mechanism
CER Certified Emission Reduction units
CHP Combined Heat and Power
DAM Day-ahead Market
DEHSt Deutsche Emissionshandelsstelle
DIW Deutsches Institut für Wirtschaftsforschung
EEX European Energy Exchange
ENTSOE European Network of Transmission System Operators for Electricity
EnWG Energiewirtschaftsgesetz
EPEX European Power Exchange
ERU Emission Reduction Units
ETS Emission Trading System
EU ETS European Union Emissions Trading System
EUA European Union Emission Allowances
EUTL European Union Transaction Log
ICE InterContinental Exchange
ICIS Independent Commodity Intelligence Services
IDM Intra-Day Market
JI Joint Implementation
Kobize Krajowy Ośrodek Bilansowania i Zarządzania Emisjami (Polish national center
for emissions management)
LRF Linear Reduction Factor
MAC Marginal Abatement Cost
MSR Market Stability Reserve
OHA Open Holding Account
OPSD Open Power System Data
OTC Over the Counter
PIK Potsdam Institut für Klimafolgenforschung
RTM Real Time Market
TGE Towarowa Giełda Energii (Polish electricity market operator)
TSE Polskie Sieci Elektroenergetyczne (Polish transmission system operator)
TSO Transmission System Operator
VAT Value Added Tax
9CLIMATE CHANGE - The European Emissions Trading System and the German and Polish Electricity Market
Summary and conclusions
This report analyses the influence of the EU ETS and the German and Polish electricity markets
along two main questions:
► How do EU ETS design features affect the environmental effectiveness of the system and the
quality of the carbon price signal?
► How do electricity market design features in Poland and Germany affect the carbon price
induced abatement in the power sector?
In the following, we first summarize our most important findings and then draw some interim
conclusion on the interaction of the two markets.
Impacts of carbon market design on the quality of the carbon price signal
The environmental effectiveness and the quality of the allowance price signal are most affected
by the emission target, the possibility of using offsets, and the market stability reserve:
► Volatility: Volatile carbon prices are an indicator that a market is able to react to newly
revealed information. Yet, excessive volatility makes it difficult for market participants to
make abatement and trading decisions. Short-term volatility of the EUA price remains rather
moderate and constant over time. The EU ETS has some features that according to theory
(Acworth et al., 2019) have a decreasing impact on volatility: a rather high transparency, an
open designed system, auctioning of permits for the largest group of emitters (electricity
generation) and the design as an open system in the sense of allowing participation of non-
regulated actors. The relatively low price volatility of the EU ETS can be seen as a weak
indicator, that these features also empirically show a decreasing impact on volatility.
► Reflection of MAC: Comparing the MAC and the EUA price enables to examine whether the
price signal is distorted. Due to the bidding behavior of fossil producers, the short-run MAC
of the electricity sector seem to be reflected in the EUA price, at least since 2018. However,
this is not necessarily the case for the long-run MAC or the MAC of other sectors. Also, the
large market surplus accumulated between 2009 and 2013 plays a role. Without scarcity,
there is no need for abatement making it difficult to define and measure MAC.
► Predictability: Because investors have a planning horizon of several years, the long-term
predictability of the price signal is essential to foster low carbon investments. The large
sustained market surplus seems to have led to very low prices and doubts about the
effectiveness of the system. Multi-annual discussions on ETS reforms (first backloading, then
about the MSR) heavily impacted the predictability of the carbon price and thus reduced its
impact on investments. The large inflow of international credits (offsets) contributed to
uncertainty about EUA price development as the international market development (large
supply of very low-priced credits from the Kyoto-mechanisms) was not anticipated by
regulators. In theory, a major driver of predictability is the existence of a reliable long-run
target which allows to better predict long-term prices, in reality the market tends to be
myopic, though. The introduced Market Stability Reserve introduces bounds on allowances
supply in the market, thereby increasing the flexibility of supply to react to changes in
demand and thus helps to stabilize the EUA price. But uncertainties on the future balance of
supply and demand remain with uncertain future emissions development (e.g. driven by
10CLIMATE CHANGE - The European Emissions Trading System and the German and Polish Electricity Market
overall economic development, technological changes, overlapping policies etc.) and the
need for frequent ambition raising required by the Paris Agreement.
► Environmental effectiveness: The environmental effectiveness equals the amount of
emissions abated. It is thus mainly affected by design elements that change the emissions
cap: The effectiveness increases with a more stringent cap or the cancellation of allowances,
whereas it decreases when offsets with low environmental integrity or additionality are
imported. Moreover, the introduction of the MSR is expected to at least partly cancel the
additional supply in the year 2023 and beyond.
Impact of electricity market structure and regulation on the abatement induced by carbon
prices
The electricity sector abatement induced by the carbon price depends on market structure and
regulations:
► Capacity mix: The existing capacity mix, impacts the role of carbon prices for the
dispatching of power plants as well as for investment decisions. With a more diverse
capacity mix including natural gas like in Germany, carbon prices play a larger role in short-
term abatement (fuel switch) than in a coal-focused system like Poland where less fuel
switching is possible.
► Age of fleet: The age of the fleet also impacts the role of carbon prices for dispatching as
well as investments. A larger age like in Poland implies less efficient plants, and thus a higher
impact of carbon prices. Moreover, older plants need to be replaced in the near future. Thus,
carbon prices are more likely to trigger (dis)investments.
► Complementary policies: Additional policies play a key role determining the importance of
carbon prices for dispatching and investment decisions. Renewable and CHP support
incentivize the generation of certain technologies and therefore also investment into
corresponding capacities. As the renewable and CHP subsidies become an additional factor
influencing these decisions, the role of carbon prices is reduced. Therefore, support schemes
are often at least partly harmonized with the goal of carbon abatement. In both countries,
the CHP support is only granted for plants with a certain efficiency ensuring investment and
operation of less-carbon intense generation assets.
The impact of reliability and adequacy policies on the role of carbon prices depends on the
details of the individual design of the regulation. Granting income to power plants outside
the energy market like done by the German reserve scheme minimizes the interaction of
these payments with the carbon price. The Polish capacity market grants additional income
to incumbent power plants and, thus, is likely to reduce the role of carbon price driven
investments. As capacity payments do not affect short-run marginal cost determining the
power plant dispatch, the capacity market is however unlikely to affect the role of carbon
prices for dispatch.
► Pass-through of carbon cost to retail electricity prices: It seems that the pass-through of
carbon cost to retail electricity consumers is rather limited. Neither in Poland nor in
Germany final consumers seem to receive a proper signal at least not within the same year.
Both countries provide a compensation for indirect carbon cost to large electricity
consumers exposed to leakage risk, i.e., they are compensated for the carbon price
11CLIMATE CHANGE - The European Emissions Trading System and the German and Polish Electricity Market
component of the electricity price. As these consumers do not receive the carbon price
signal, the role of carbon prices for energy efficiency investments is reduced. In Poland, the
retail price cap is likely to hinder the reflection of the EUA price in the electricity prices of
households and, thus, will reduce the role of carbon prices for households’ energy efficiency
improvements. In Germany, generation cost (including the carbon price) is only a small
share retail prices paid by households and small customers due to high taxes and levies.
Impact of electricity market structure on the quality of the carbon price signal
Provided our observations on the EU ETS and the electricity market structure in Poland and
Germany, we can derive the following conclusions regarding the impact of the electricity market
structure on the quality of the EUA price:
First, the diversity and age of the capacity portfolio is unlikely to influence the quality of the
price signal. These factors however do determine the response of the electricity system to the
EUA price. In systems with relatively young gas-fired plants, we are more likely to observe fuel-
switching before major investment takes place.
Second, there are two major factors affecting the role of the EUA price in the electricity sector:
Complementary policies such as renewable or CHP support in both countries and retail price
policies such as the price cap in Poland. Both mechanisms reduce the role of the carbon price.
The former for dispatching and investment decisions and the latter for demand reduction and
energy efficiency investments. Thus, both policies distort the MAC in the electricity sector. If the
electricity sector is the price setting sector in the carbon market, such policies reduce the
reflection of MAC through the carbon price.
Finally, complementary policies also affect the predictability of the carbon price. On the one
hand, they impact investments. Thus, in forecasting carbon prices one needs to forecast the
impact of additional policies. On the other hand, policies granting subsidies based on generation
impact the demand for emission allowances. Thus, carbon price predictability decreases as
demand uncertainty increases. The MSR - an automatic adjustment mechanism within the EU
ETS – can reduce the impact of these effects on the allowance price to some extent, but does not
remove all uncertainties. To what extent voluntary cancellation according to Article 12(4) will
help to stabilize the demand-supply balance on the European carbon market, and thus improve
predictability of EUA prices, remains to be seen.
12CLIMATE CHANGE - The European Emissions Trading System and the German and Polish Electricity Market
Zusammenfassung und Schlussfolgerungen
Dieser Bericht analysiert die Interaktion des Europäischen Emissionshandelssystems (EU EHS)
und des deutschen und polnischen Strommarktes entlang zweier Hauptfragen:
► Wie wirken sich die Gestaltungsmerkmale des EU EHS auf die ökologische Wirksamkeit des
Systems und die Qualität des CO2-Preissignals aus?
► Wie wirken sich die Gestaltungsmerkmale des Strommarktes in Polen und Deutschland auf
die durch das CO2-Preissignal induzierte Emissionsreduktion im Stromsektor aus?
Im Folgenden fassen wir unsere wichtigsten Ergebnisse zusammen.
Auswirkungen der Ausgestaltung des Emissionshandels auf die Qualität des CO2-
Preissignals
Die Umweltwirksamkeit und die Qualität des Preissignals für Zertifikate werden am stärksten
durch das Emissionsziel, die Möglichkeit der Nutzung von Offsets und die
Marktstabilitätsreserve beeinflusst:
► Volatilität: Volatile CO2-Preise sind ein Indikator dafür, dass ein Markt in der Lage ist, auf
neue Informationen zu reagieren. Eine übermäßige Volatilität erschwert es den
Marktteilnehmern jedoch, Vermeidungs- und Handelsentscheidungen zu treffen. Die
kurzfristige Volatilität des EUA-Preises war moderat und konstant. Das EU EHS weist einige
Merkmale auf, die der Theorie zufolge (Acworth et al., 2019) die Volatilität reduzieren: eine
recht hohe Transparenz, die Versteigerung von Zertifikaten für die größte Gruppe von
Emittenten (Stromerzeugung) und die Gestaltung als offenes System im Sinne einer
Beteiligung nicht regulierter Akteure. Die relativ geringe Preisvolatilität des EU EHS kann als
schwacher Indikator dafür gesehen werden, dass diese Merkmale auch aus empirischer Sicht
die Volatilität reduzieren.
► Widerspiegelung der Grenzvermeidungskosten: Ein Vergleich der
Grenzvermeidungskosten und des EUA-Preises ermöglicht es zu untersuchen, ob das
Preissignal verzerrt ist. Aufgrund des Bieterverhaltens der fossilen Produzenten scheinen
sich die kurzfristigen Grenzvermeidungskosten des Stromsektors zumindest seit 2018 im
EUA-Preis widerzuspiegeln. Dies ist jedoch nicht unbedingt der Fall für die langfristigen
Grenzvermeidungskosten bzw. die Grenzvermeidungskosten anderer Sektoren. Auch der
große Angebotsüberschuss, der sich zwischen 2009 und 2013 angesammelt hat, spielt eine
Rolle. Ohne Knappheit gibt es keine Notwendigkeit für Emissionsminderungen, was die
Definition und Messung der Grenzvermeidungskosten erschwert.
► Vorhersagbarkeit: Da Investoren einen Planungshorizont von mehreren Jahren haben, ist
die langfristige Vorhersagbarkeit des Preissignals für die Förderung emissionsarmer
Investitionen von entscheidender Bedeutung. Der große anhaltende Angebotsüberschuss
scheint zu sehr niedrigen Preisen und Zweifeln an der Wirksamkeit des Systems geführt zu
haben. Mehrjährige Diskussionen über EHS-Reformen (zuerst Backloading, dann über die
Marktstabilitätsreserve) haben die Vorhersagbarkeit des Kohlenstoffpreises stark
beeinträchtigt und damit seine Auswirkungen auf Investitionen verringert. Die
Verfügbarkeit von internationalen Gutschriften (Offsets) trug zur Unsicherheit über die
13CLIMATE CHANGE - The European Emissions Trading System and the German and Polish Electricity Market
Entwicklung des EUA-Preises bei, da die internationale Marktentwicklung (großes Angebot
an kostengünstigen Gutschriften aus den Kyoto-Mechanismen) von den Marktteilnehmern
nur schwer vorhersehbar war. Die Existenz eines zuverlässigen langfristigen Ziels ist in der
Theorie ein wichtiger Faktor für die Vorhersagbarkeit der langfristigen Preise. In Realität
scheinen die Markteilnehmer jedoch eher kurzsichtig zu agieren. Die eingeführte
Marktstabilitätsreserve führt eine Begrenzung des Angebots an Zertifikaten auf dem Markt
ein, wodurch die Flexibilität des Angebots erhöht wird, um auf Veränderungen der
Nachfrage zu reagieren. Somit trägt die Reserve zur Stabilisierung des EUA-Preises bei.
Unsicherheiten über das künftige Gleichgewicht von Angebot und Nachfrage bleiben jedoch
bestehen, da die künftige Emissionsentwicklung ungewiss ist (z.B. bedingt durch die
allgemeine wirtschaftliche Entwicklung, technologische Veränderungen, komplementäre
Politiken usw.) und die im Pariser Abkommen geforderte Verschärfung der Ziele umgesetzt
werden muss.
► Umweltwirksamkeit: Die Umweltwirksamkeit entspricht der Menge an Emissionen, die
vermieden werden. Sie wird also hauptsächlich durch Designelemente beeinflusst, die die
Emissionsobergrenze verändern: Die Wirksamkeit steigt mit einer strengeren Obergrenze
oder der Löschung von Zertifikaten während sie abnimmt, wenn ausländische Gutschriften
mit geringerer Umweltwirkung oder fehlender Additionalität zugelassen werden. Darüber
hinaus wird erwartet, dass durch die Marktstabilitätsreserve ein Teil des Überschusses ab
dem Jahr 2023 gelöscht wird.
Auswirkungen der Struktur des Elektrizitätsmarktes und der Regulierung auf die durch die
CO2-Preise induzierte Emissionsreduktion
Die durch den Kohlenstoffpreis induzierte Vermeidung im Elektrizitätssektor hängt von der
Marktstruktur und der Regulierung des Strommarkts ab:
► Kapazitätsmix: Der bestehende Kapazitätsmix beeinflusst die Rolle der Kohlenstoffpreise
sowohl für den Dispatch von Kraftwerken als auch für Investitionsentscheidungen. Bei
einem diversifizierten Kapazitätsmix (inkl. Erdgas) wie in Deutschland spielen CO2-Preise
bei der kurzfristigen Vermeidung (Wechsel von Kohle zu Gas) eine größere Rolle als in
einem kohlefokussierten System wie Polen, wo dies weniger möglich ist.
► Alter der Produktionsflotte: Auch das Alter der Flotte wirkt sich auf die Rolle der CO2-
Preise sowohl für den Dispatch als auch für Investitionen aus. Ein höheres Alter wie in Polen
bedeutet weniger effiziente Anlagen und damit einen höheren Einfluss der CO2-Preise.
Außerdem müssen ältere Anlagen in naher Zukunft ersetzt werden. Daher ist es
wahrscheinlicher, dass CO2-Preise (Des-)Investitionen auslösen.
► Begleitende Politikmaßnahmen: Zusätzliche Politiken spielen eine Schlüsselrolle für die
Bedeutung des CO2-Preises bei Dispatch- und Investitionsentscheidungen. Die Förderung
erneuerbarer Energien und der Kraft-Wärme-Kopplung (KWK) gibt Anreize für die
Erzeugung bestimmter Technologien und damit auch für Investitionen in entsprechende
Kapazitäten. Da Subventionen für erneuerbare Energien und Kraft-Wärme-Kopplung zu
einem zusätzlichen Faktor der Investitionsentscheidung werden, verringert sich die
Bedeutung des CO2-Preises. Daher werden die Förderprogramme oft zumindest teilweise
14CLIMATE CHANGE - The European Emissions Trading System and the German and Polish Electricity Market
mit dem CO2-Minderungsziel harmonisiert. In beiden Ländern wird die KWK-Förderung nur
für Anlagen mit einem bestimmten Wirkungsgrad gewährt, der die Investition und den
Betrieb von emissionsarmen Erzeugungsanlagen gewährleistet.
► Der Einfluss von zusätzlichen Politiken auf die Rolle der CO2-Preise hängt von der
individuellen Ausgestaltung der Regelung ab. Die Gewährung von Einkünften an Kraftwerke
außerhalb des Energiemarktes, wie dies durch das deutsche Reservesystem geschieht,
minimiert die Interaktion dieser Zahlungen mit dem EUA-Preis. Der polnische
Kapazitätsmarkt gewährt den etablierten Kraftwerken zusätzliche Einnahmen und wird
daher wahrscheinlich den Einfluss des CO2-Preises auf die Investitionen reduzieren. Da
Kapazitätszahlungen keinen Einfluss haben auf die kurzfristigen Grenzkosten, die den
Kraftwerkseinsatz bestimmen, ist es jedoch unwahrscheinlich, dass der Kapazitätsmarkt die
Rolle der Kohlenstoffpreise für den Dispatch beeinflusst.
► Überwälzung der CO2-Kosten auf die Endkundenstrompreise: Es scheint, dass die
Weitergabe der CO2-Kosten an die Stromeinzelhandelskunden eher begrenzt ist. Weder in
Polen noch in Deutschland scheinen die Endverbraucher ein angemessenes Signal zu
erhalten, zumindest nicht innerhalb desselben Jahres. Beide Länder bieten großen
Stromverbrauchern, die einem Risiko für „Carbon Leakage“ ausgesetzt sind, einen Ausgleich
für die indirekten CO2-Kosten, d.h. sie werden für die CO2-Preiskomponente des
Strompreises entschädigt. Da diese Verbraucher das Preissignal nicht erhalten, verringert
sich die Rolle der CO2-Preise für Investitionen in die Energieeffizienz. In Polen dürfte die
Obergrenze für den Endkundenpreis die Weitergabe des EUA-Preises in den Strompreisen
für Haushalte behindern. Somit verringert sich auch die Rolle der CO2-Preise für
Verbesserungen der Energieeffizienz der Haushalte. In Deutschland machen die
Erzeugungskosten (einschließlich des CO2-Preises) aufgrund hoher Steuern und Abgaben
außerdem nur einen kleinen Teil der von Haushalten und Kleinkunden gezahlten
Strompreise aus.
Auswirkungen der Struktur des Strommarktes auf die Qualität des CO2-Preissignals
Auf Grundlage unserer Beobachtungen zum EU EHS und der Strommarktstruktur in Polen und
Deutschland ziehen wir folgende Schlussfolgerungen zu den Auswirkungen der
Strommarktstruktur auf die Qualität des EUA-Preises:
Erstens ist es unwahrscheinlich, dass die Vielfalt und das Alter des Kapazitätsportfolios die
Qualität des Preissignals beeinflussen. Diese Faktoren bestimmen jedoch die Reaktion des
Elektrizitätssystems auf den EUA-Preis. In Systemen mit relativ jungen (Gas-)Kraftwerken
werden wir eher einen Wechsel von Kohle zu Gas beobachten bevor größere Investitionen
getätigt werden.
Zweitens gibt es zwei wichtige Faktoren, die die Rolle des EUA-Preises im Stromsektor
beeinflussen: Begleitende Politikmaßnahmen wie die Förderung erneuerbarer Energien oder
der Kraft-Wärme-Kopplung sowie Preispolitiken wie beispielsweise die Preisobergrenze in
Polen. Beide Mechanismen reduzieren die Rolle des CO2-Preises. Ersterer für Dispatch- und
Investitionsentscheidungen und letzterer für Nachfragereduktion und
Energieeffizienzinvestitionen. Somit verzerren beide Politiken die Grenzvermeidungskosten im
Elektrizitätssektor. Wenn der Elektrizitätssektor der preisbestimmende Sektor auf dem CO2-
15CLIMATE CHANGE - The European Emissions Trading System and the German and Polish Electricity Market
Markt ist, verringern solche Politiken die Reflektion der Grenzvermeidungskosten durch den
CO2-Preis.
Schließlich beeinflussen begleitende Politikmaßnahmen auch die Vorhersehbarkeit des
Kohlenstoffpreises. Einerseits wirken sie sich auf Investitionen aus. Daher muss man bei der
Vorhersage von CO2-Preisen die Auswirkungen zusätzlicher Maßnahmen abschätzen. Auf der
anderen Seite beeinflussen Produktionssubventionen die Nachfrage nach Emissionszertifikaten.
Daher nimmt die Vorhersagbarkeit des CO2-Preises mit zunehmender Unsicherheit der
Nachfrage ab. Die Marktstabilitätsreserve - ein automatischer Anpassungsmechanismus
innerhalb des EU EHS - kann die Auswirkungen dieser Effekte auf den Zertifikatspreis bis zu
einem gewissen Grad verringern, beseitigt aber nicht alle Unsicherheiten. Inwieweit die
freiwillige Löschung nach Artikel 12 Absatz 4 dazu beitragen wird, das Nachfrage-Angebots-
Gleichgewicht auf dem europäischen Kohlenstoffmarkt zu stabilisieren und damit die
Vorhersagbarkeit der EUA-Preise zu verbessern, bleibt abzuwarten.
16CLIMATE CHANGE - The European Emissions Trading System and the German and Polish Electricity Market
1 Introduction
The project “Influence of market structures and market regulation on the carbon market” aims
to identify the impact of market structures and regulations on carbon markets and to investigate
the interdependencies between carbon and energy markets. In a first step, Acworth et al. (2019)
identified major interaction channels based on a literature study. In a second step, case studies
are used to analyse the mechanisms and interaction channels based on the previously developed
framework. In this report, we present the case study for the European Emission Trading System
(EU ETS) and the German and Polish electricity market. The aim of the case study is to analyse
the design of the different markets and regulations and how these affect the carbon price as well
as market interactions in terms of emission reduction. An assessment of the emissions and
power markets in terms of their functioning or quality of the price signal is beyond the scope of
this project. Nevertheless, this report addresses the following two questions:
1. How do EU ETS design features affect the environmental effectiveness of the system and
the quality of the carbon price signal?
2. How do electricity market design features in Poland and Germany affect the carbon price
induced abatement in the power sector?
The report is structured in two parts. First, we describe the EU ETS, its most important design
features, and the development of traded allowance volumes and allowance prices. Further, we
assess the impact of design features on the effectiveness of the system and the quality of the
allowance price along four dimensions:
► Environmental effectiveness: The environmental effectiveness equals the amount of
emissions abated.
► Reflection of marginal abatement cost (MAC): Examining the MAC enables to examine
whether the price signal is distorted.
► Long-term price predictability: Because investors have a planning horizon of several years,
the long-term predictability of the price signal is essential to foster low carbon investments.
► Price volatility: Volatile carbon prices are an indicator that a market is able to react to newly
revealed information, e.g., changes in production cost. Yet, excessive volatility makes it
difficult for market participants to make abatement and trading decisions.
Second, we describe the German and Polish electricity markets in terms of design, supply, and
demand. We then assess the interaction of carbon and electricity markets, focusing on the
impact of carbon prices on electricity generation, demand, and consequently abatement. We
assess this impact along the three main abatement channels:
► Fuel switch: Short-term abatement through change in dispatch.
► Low carbon investment/divestment: Long-term abatement through investment in low
carbon technologies or divestment from fossil technologies.
► Demand reduction: Short to long-run abatement due to demand reduction induced by higher
electricity prices for consumers in wholesale and retail markets.
All three abatement channels depend on the pass-through of the carbon price signal to bids in
the electricity market, and thus wholesale market prices. We thus also provide evidence on the
cost pass-through.
17CLIMATE CHANGE - The European Emissions Trading System and the German and Polish Electricity Market
The framework of this report is based on Acworth et al. (2019). For the analyses, we (i) use
literature on carbon and electricity market regulations, research articles, and secondary
literature; (ii) analyse electricity and carbon market data from TGE, EUTL, ENTSOE, EPEX, OPSD,
and ICE; and (iii) conduct semi-structured interviews with different stakeholders from Germany
and Poland. Table 1 gives an overview of interview partners in both countries.
Table 1: Interview partners
Feature
Companies 5 3
Researchers and Think Tanks PIK, DIW Forum Energii, Wise Europa,
Kozminski University
Regulators DEHSt KOBiZE
Others EEX, ICIS TGE
With our analyses we provide descriptive and narrative evidence on the interactions of carbon
and electricity market regulations in the two countries. A thorough quantitative assessment of
causal relations is beyond the scope of this project. Also, it is important to note that the results
from expert interviews provide a range of expert opinions, but cannot be seen as representative.
This report proceeds as follows. Section 2 describes design and regulation of the EU ETS, Section
3 assesses their impact on environmental effectiveness and the quality of the price signal,
Section 4 introduces the German and Polish electricity markets, Section 5 analyses the impact of
electricity market design on carbon price induced abatement in the power sector.
18CLIMATE CHANGE - The European Emissions Trading System and the German and Polish Electricity Market
2 Design and regulation of the EU ETS
The EU ETS covers around 40% of EU greenhouse gas emissions from large-scale facilities in the
power and industry sectors, as well as since 2012 the aviation sector. It is a cap and trade
system. Each ton of carbon dioxide (CO2) of the cap is worth one European emission allowance
(EUA) and gives the right to emit one ton of CO2 equivalent (CO2 eq.). Regulated entities need to
hand in allowances for each unit of emissions in the previous year. If the amount of surrendered
allowances does not match emissions, fines and make good provisions are imposed.
Up to now, the EU ETS can be divided into three phases. The pilot phase from 2005 to 2007
established the EU ETS as the world’s largest carbon market. In the second trading period from
2008 to 2012 Norway, Iceland and Liechtenstein joined. The third period runs from 2013-2020
and the system is regulated on the European level as one sector with a high share of auctioning.
In 2020, the Swiss ETS was linked to the EU ETS and from 2021 the EU ETS will enter its fourth
period lasting until 2030.
Table 2 gives an overview over supply and demand side design features in the EU ETS. In the
following, we describe the individual design features of the EU ETS. In the next section, we
reflect on the design features’ impact on the environmental effectiveness of the system and the
quality of the EUA price signal along the three dimensions (1) price volatility, (2) reflection of
the marginal abatement cost (MAC), and (3) long-term predictability.
19CLIMATE CHANGE - The European Emissions Trading System and the German and Polish Electricity Market
Table 2: Overview supply and demand side design features in the EU ETS
Feature EU ETS Design Comment
Allowance Cap Absolute Absolute cap and constant linear reduction factor (LRF)
2012-2020: 1.74% (in relation to 2010 reference
value, 38 Mio. EUA per year)
from 2021 on: 2.2% (48 Mio. EUA per year)
Mid-term Target 2030 target: adopted -43% against 2005
Long-term Target 2050 target: under Continuation of LRF 2.2% would lead to 85% reduction,
discussion which is not in line with net-zero emissions, as proposed
by the EU Green Deal
Primary Auctioning in electricity DE: Auctioning in electricity sector
Allocation (in sector, transitional free PL: Auctioning in electricity sector and transitional free
electricity sector) allocation for selected allocation (Art. 10c)
member states
Banking Allowed within & across periods
Borrowing Partly allowed within periods (use of current year’s free allocation for
last year’s emissions)
Additional Offsets CER, ERU until 2020 only
sources of Supply
Linking allowed Linking with CH ETS since 2020
Market Stability Quantity bounds (Market Since 2019: reduces (increases) auction amounts
Mechanism Stability Reserve, MSR) dependent on market surplus
2023: Cancellation of permits from MSR
Voluntary Allowed
Cancellation
Coverage 40% of EU GHG emissions Mostly CO2 but also N2O and PFCs
(as of 2017)
Market Open System Non regulated entities can open accounts and
participation participate in trade
20CLIMATE CHANGE - Influence of the European Emission Trading System and the German and Polish Electricity Market
2.1 Allowance supply
This section describes the supply side features of the EU ETS.
2.1.1 Allowance cap and long-term targets
The EU ETS has an absolute allowance cap. It demands, that by the end of 2020, emissions have
decreased by 21% compared to 2005. To reach this target, the cap is decreased every year since
2013 by a linear reduction factor (LRF) of 1.74% of the 2010-cap (plus correction for enlarged
scope since 2013) or 38 million allowances per year.1 From 2021 onwards, the cap is reduced by
2.2% (48 million allowances2) per year, resulting in a reduction of 43% until the year 2030.
Targets after 2030 are not yet determined, but there is no expiration date of the linear reduction
factor. A continuation of this reduction path, leads to a reduction of 85% in 2050, which is not in
line with the target of net zero emissions in the year 2050 as proposed by the European Green
Deal. Discussions on future targets have just begun and it is not unlikely that the 2030 targets
will be revised downward to reflect ramped up ambition in the EU.
2.1.2 Initial allocation of allowances
There are two main options for initial permit allocation: free allocation or auctioning. Figure 1
shows the free allocation to combustion installations and other activities as well as the amount
of auctioned allowances. Whereas industrial installations still receive substantial free allocation
to lower competitive impacts for trade exposed industries, free allocation to combustion
installations significantly decreased since 2013. In the power sector, there is generally no free
allocation, i.e. firms need to buy all their allowances.3
However, under EC (2018a) Article 10c, a derogation was granted to eight Member States,
Bulgaria, Cyprus, Czech Republic, Estonia, Hungary, Lithuania, Poland and Romania.4 The power
sector in these countries continues to receive a (decreasing) amount of allowances for free. In
return, they agreed to invest the value of these freely received allowances in the modernization
of their power sectors. This derogation has to end by 2030.
1 Aviation is regulated under a separate cap for the 2013-2020 period. It lies 5% below average annual
emissions during the years 2004 to 2006.
2 The absolute figure for the LRF is without accounting for the UK possibly leaving the EU ETS.
3 As an exception, combined heat and power (CHP) plant receive free allowances for heat delivered to
sectors not covered under the EU ETS.
4 Malta and Latvia are also eligible for the derogation but decided to not use it.
21CLIMATE CHANGE - Influence of the European Emission Trading System and the German and Polish Electricity Market
Figure 1: Allocation of Allowances in the EU ETS
2’500
Second Period Third Period
2’000
Allocation of Allowances [Mt CO2]
1’500
1’000
500
0
2008 2009 2010 2011 2012 2013 2014 2015 2016 2017 2018
Free Allocation Industries Free Allocation Combustion Auctioned and sold allowances
Source: Own figure based on EEA Emission Viewer. The first trading period (2005-2007) is not included in this figure as it was a
pilot phase and allowances could not be transferred (banked) to future periods.
Figure 2 below shows free allocation for Germany and Poland (including free allocation under
Article 10c) for combustion installations together with verified emissions of these installations.
The difference between free allocation and verified emissions can be interpreted as the
compliance demand, i.e., the amount of allowances to be bought from the market in order to
comply with the EU ETS. In Germany, only a small amount of allowances is provided for free,
mainly to combustion installations for industry production and heat. In contrast, Poland shows a
high amount of free allowances. In fact, Poland is the country with the highest amount of free
allocation under Article 10c (see EC, 2019a).
22CLIMATE CHANGE - Influence of the European Emission Trading System and the German and Polish Electricity Market
Figure 2: Compliance demand in the combustion sector (emissions not covered by free allocation)
Germany
400
Second Period Third Period
350
Allocation to Combustion [Mt CO2]
300
250
200
150
100
50
0
2008 2009 2010 2011 2012 2013 2014 2015 2016 2017 2018
Poland
Free allocation 10 c Verified Emissions
200
Second Period Third Period
180
160
Allocation to Combustion [Mt CO2]
140
120
100
80
60
40
20
0
2008 2009 2010 2011 2012 2013 2014 2015 2016 2017 2018
Free allocation 10 c Verified Emissions
Source: Own depiction based on EEA Emission Viewer
23CLIMATE CHANGE - Influence of the European Emission Trading System and the German and Polish Electricity Market
2.1.3 Banking and borrowing
With the exception of the first phase, the EU ETS allows banking across phases. If regulated
entities have a surplus of allowances at the end of a trading phase, they can transfer them to the
next phase. From phase 2 to phase 3, 1’749.5 million allowances have been banked (EC, 2019b).
Borrowing of allowances is implicitly allowed but only within a phase. Each February 28th, freely
allocated allowances for the current year are allocated to installations (EC, 2018a, Article 11).
Allowances to cover previous year’s emissions must be surrendered by April 30th. Therefore, it is
possible to surrender allowances for the current year to cover emissions of the previous year.
2.1.4 Provisions for additional allowances supply
Offsets
To a certain extent, regulated entities can use credits from flexible mechanisms set up under the
Kyoto Protocol. First, the Clean Development Mechanism (CDM) allows industrialized countries
with a binding reduction target (Annex 1 countries) to use credits of mitigation projects in
developing countries for their compliance under the Kyoto Protocol. The generated credits are
called Certified Emission Reductions (CERs). Second, the Joint Implementation (JI) program
allowed Annex I countries to meet their target by surrendering credits of mitigation projects in
other industrialized countries. Those credits were generated by transforming an Assigned
Amount Units into an Emission Reduction Units (ERUs). Since 2013, ERUs and CERs cannot be
surrendered directly, but are exchanged for EUAs (EC, 2015a).
Until mid-2019, about 1’510 Mt of international credits have been imported accounting for over
90% of the allowed maximum number of credits to be used (EC, 2019a). To put this number into
context, verified emissions of stationary installations in the year 2018 summed up to about
1’682 MtCO2. Thus, offsets imported into the system are almost equal to one year of emissions.
In the fourth trading period, it is no longer allowed to use international credits (EC, 2019a).
Linking
EC (2018a) Article 25 allows linking the EU ETS to other trading system. In 2017, EU and
Switzerland signed an agreement to link their emission trading systems. After passing the
ratification in the Swiss parliament in 2019, the link became operational at the beginning of
2020.5
2.1.5 Market stability mechanisms
As a response to a high surplus of allowances in the market, the EU decided in 2015 to
implement a so-called Market Stability Reserve (MSR) starting in 2019 (EC, 2015b). It
established upper and lower bounds on the structural allowance surplus in the market, and
automatically transfers allowances to or releases allowances from the reserve when the surplus
is outside of this range. From 2023, the total volume of allowances in the reserve is limited to
5https://www.bafu.admin.ch/bafu/de/home/themen/klima/fachinformationen/klimapolitik/emissionsh
andel/verknuepfung-der-emissionshandelssysteme-schweiz-eu.html
24CLIMATE CHANGE - Influence of the European Emission Trading System and the German and Polish Electricity Market
the previous year’s auction volume, putting in place a mechanism to automatically cancel
allowances leading to a reduction of the allowance cap (EC, 2018b).
The MSR started in 2019. In its first year, the MSR intake from the market was 397 million EUA,
which means short-term supply decreases. Whether long-term supply decreases, depends on
how many allowances are canceled out of the reserve in 2023. Bocklet et al. (2019) simulate
allowances supply as well as EUA prices under the MSR. They find a one-time cancelation of
about 2’000 million EUAs in 2023.6
2.1.6 Voluntary cancellation of allowances
Market participants have the option to voluntarily cancel allowances out of the system. So far,
only a minor amount of 0.3 million has been canceled under Article 12.4 (EC, 2019b). With the
new ETS Directive (EC, 2018a), member states are allowed to cancel allowances in the case of
closures of power plants due to additional national policies. So far, no member state has used
this provision. Germany has, however, announced they intend to cancel allowances in line with
their structured coal phase out.
2.2 Demand
This section describes the demand side features of the EU ETS.
2.2.1 Coverage
The geographical scope of the EU ETS covers all European member states plus Iceland,
Liechtenstein, and Norway. The regulatory scope of the EU ETS is determined by a capacity
threshold (20 MW) for combustion activities and the activity of industrial installations, i.e., apart
from the capacity threshold only installations carrying out certain activities are regulated.7 The
main greenhouse gas covered is CO2 but also N2O and PFCs emission are regulated.
Figure 3 shows verified emissions for combustion installations, other industries, and aviation.
With that scope, the EU ETS covered around 40% of the total emissions of the EU in 2017.
Combustion installations constitute the major source of emissions covered. The combustion
emissions mainly stem from electricity production. Out of the 1’098 Mt CO2 emission of
combustion installations 949 Mt CO2 have been reported to be emissions by the power sector
(EC, 2019a). This amounts to about 54% of total emissions in the EU ETS (including aviation).
Thus, electricity production is the major source of emissions covered under the EU ETS.
6 Further details on the MSR can be found in Appendix A
7 See EC (2018a) Annex 1 for a detailed list of activities covered.
25You can also read