4D Insights from SEG 2018
←
→
Page content transcription
If your browser does not render page correctly, please read the page content below
INDUSTRY INSIGHTS                                                                                     September 18

 By Andrew Long (Andrew.Long@pgs.com)                                                                            1 of 8

4D Insights from SEG 2018
In this paper I review most of the SEG 2018 abstracts on 4D matters, with the exception
of the more academic waveform inversion concepts unless they explicitly facilitate
more efficient or flexible 4D data acquisition. This material is equally relevant for the
‘EAGE Australasian Workshop on Continuous Improvement in 4D Seismic’ which is
held in Perth, Australia in the week immediately preceding the SEG 2018 annual
conference.
Summary
As operators increasingly turn to 4D reservoir monitoring to optimize asset recovery in both land and marine
environments, a diverse range of perspectives are being taken on how 4D acquisition efforts are planned and
implemented. On one hand, extreme scrutiny is being given to minimizing both acquisition geometry and
environmental variations between baseline and monitor surveys, and on the other hand we see creative efforts to
introduce automation and find ways to relax the acquisition effort. Distributed acoustic sensing (DAS) exploits
backscatter along fiber-optic cables to measure strain rate, and after initial deployment for borehole and shallow
seismic characterization of the near surface, is now being tested for more conventional deep seismic imaging, as
well as being used in conjunction with VSP surveys for the characterization of hydraulic fractures between fracking
stages. Several abstracts address the interpretation of time shifts observed on both pre-stack and post-stack
surface seismic and borehole seismic data as being relevant to three main categories: production-induced
overburden or underburden deformation, pore-pressure changes within the reservoir itself, and reservoir-fluid
saturation change. Moreover, if amplitude vs. time shift effects can be differentiated it should be possible to more
robustly interpret 4D responses in terms of pressure/saturation vs. geomechanical effects. It is also clear that many
forms of 4D waveform-based inversion schemes are being developed throughout academia, although most remain
immature.

4D Data Interpretation
Pre-stack time shifts
I begin with emerging priorities in 4D interpretation. A theme present in several abstracts is the interpretation of time
shifts observed on both pre-stack and post-stack surface seismic and borehole seismic data. MacBeth et al. (2018)
provide an overview of the role that post-stack time shifts have played in 4D interpretation to date, and Dvorak and
MacBeth (2018) interpret various 4D overburden effects using pre-stack time shifts. Indeed, MacBeth et al. (2018)
identify the interpretation of time-lapse time shifts as being separated into three main categories: production-induced
overburden or underburden deformation, pore-pressure changes within the reservoir itself, and reservoir-fluid
saturation change. Post-stack time-lapse time shifts are observed to fall into six main categories: extension and
compression in the reservoir and non-reservoir rocks, plus saturation-related hardening and softening in the
reservoir. Slowdowns due to overburden extension, pressure increase in the reservoir, gas exsolution and gas
displacing oil/water display the largest and most prevalent responses. In these cases time shifts can reach several
tens of milliseconds, depending on the reservoir thickness and rock properties, but are typically 1 to 10 ms.
Speedups due to water displacing oil/gas in the reservoir and compressional strain in the overburden are at most 1
to 3 ms and much less commonly observed. The reasons for the difference in occurrence of slowdown and speedup
is not yet entirely clear. Magnitudes of time shifts appear to be predicted well by rock physics and geomechanical
calculations and show some variation with reservoir thickness and compressibility, porosity, velocity, and to a limited
extent critical fluid saturations such as residual oil, critical gas saturation, and maximum gas saturation. Despite this
variability, time shifts can be generalized across a broad range of reservoirs, and moreover, time-lapse effects are
easy to predict in robust ways; for example, as shown in Figure 1.
Time shift inversion
Current industry workflows for 4D programs typically utilize the co-processing of baseline and monitor surveys with
a single velocity model for the imaging stage. The general industry practice is then to generate time and amplitude
difference volumes from the full angle stacks of the baseline and monitor datasets, which are then interpreted in
conjunction with production and geological models to manage field development programs. The downside of this

A Clearer Image │ www.pgs.com

INDUSTRY INSIGHTS September 18
By Andrew Long (Andrew.Long@pgs.com) 2 of 8
Figure 1. Relative
time shift T/T versus
pressure change P
(either pressure up or
down): (a) for the
reservoir interval; (b)
for the overburden
interval.
Straight lines
correspond to
predictions for low to
normal (2x10⁻⁶ psi-1
or 2.9x10⁻⁴MPa-1
lines a and d),
moderate to high
(20x10-6psi-1 or
29x10-4MPa-1 lines b
and e) and high
(50x10-6 psi-1 or
72.5x10⁻⁴MPa-1 lines
c and f) reservoir bulk
compressibility.
Solid lines
correspond to
estimates for
extension, whilst
dashed lines are for
compression.
Available data are
also plotted for
reference – solid
symbols for
compression and
open symbols for
extension. From
MacBeth et al.
(2018), Fig. 5, with
permission.
approach is that time-lapse dynamic changes in the overburden are not compensated for in the generation of 4D
attribute data, thus leading to uncertainty in the 4D analysis of the target reservoir. Dvorak and MacBeth (2018)
observe that the use of pre-stack time shift inversion, as reported by Dvorak et al. (2018), enables the direct
transformation of the observed time shift variation with angle response at the reservoir level to related velocity
perturbations in the overburden. These velocity perturbation fields enable the interpretation and classification of
A Clearer Image │ www.pgs.com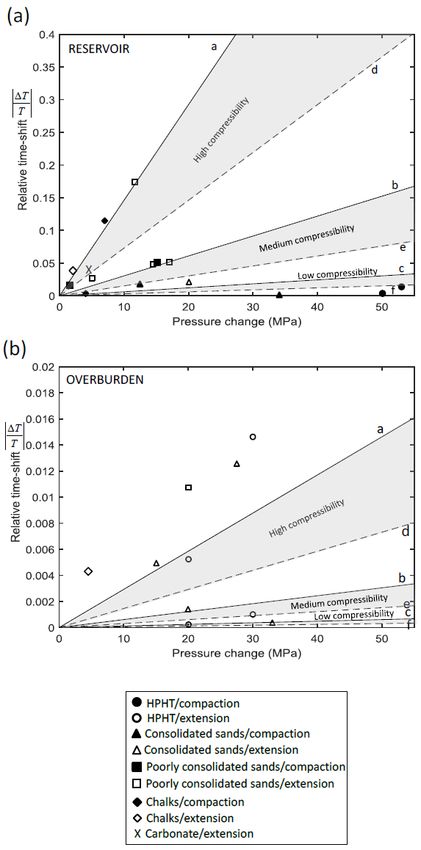
INDUSTRY INSIGHTS                                                                                        September 18

 By Andrew Long (Andrew.Long@pgs.com)                                                                              3 of 8

dynamic overburden features, and also offer the opportunity to compensate for the overburden influence during the
4D seismic workflow, thereby reducing uncertainty in 4D reservoir management. Dvorak and MacBeth (2018) find
that the use of least-squares fitting of pre-stack time shift fields with angle also allows for the derivation of attributes
such as intercept and gradient time shift maps. These additional 4D attributes to conventional post-stack derived
properties enable higher resolution interpretation of 4D features. The gradient attribute in particular shows a clear
correlation in response to known overburden geomechanical changes. In addition to the ability to delineate the
geometry and location of dynamic overburden effects from the velocity perturbation field, their methodology also
offers the opportunity for updating the 4D monitor survey imaging velocity field, and ultimately reducing uncertainty
in the reservoir 4D interpretation.
Dynamic warping
The analysis of time shifts is already well established in the context of 4D dynamic warping. Reiser et al. (2018)
describe a calibrated broadband streamer 4D case study wherein a dynamic warping algorithm was used to
estimate time shift and delta velocity in a location where a multicomponent streamer monitor survey was acquired
over a hydrophone-only baseline survey. The 4D analysis results were then compared with the 4D rock physics
analysis at available wells over the survey area and related to the production-injection mechanism. At the heart of
the workflow described by Reiser et al. (2018) is the fact that the key to success of any 4D project depends upon a
few factors, including optimum 4D seismic acquisition, the seismic frequency bandwidth at the reservoir level, and
being able to deliver the 4D analysis or results in a very rapid and efficient manner. The maximum value of any 4D
project is derived not from the data quality alone, but also from the efficiency in how the 4D image and analysis are
delivered. The value of the 4D decreases significantly with time—as results and analysis need to be delivered
promptly to make an impact on the in-fill well program.
The case study location used by Reiser et al. (2018) is in water depth of about 1320 m, and the reservoir depth is
2500-3000 m. Co-processing of the two datasets included a joint matching operator to maximize the 4D bandwidth
in the baseline survey such that it could be upgraded to the bandwidth of the broadband monitor survey, and in a
manner that was constrained by the signal-to-noise ratio (SNR) of both datasets. After application of the joint
matching operator a shallow warping was applied to the data to minimize the 4D differences in the overburden;
reducing the NRMS difference between two very different datasets to only 0.15
One of the fastest and most reliable 4D attributes to derive is the amplitude difference between surveys. Amplitude
differences have two components: a pure signal amplitude element (i.e. physical variation in the reservoir inducing
a change in the acoustic/elastic properties or reflectivity changes), and a time shift element due to local velocity
changes. Decoupling the time shift from the amplitude changes enables a better understanding of the 4D difference
due to velocity and or density changes alone. The 4D dynamic warping algorithm described by Reiser et al. (2018)
combines conventional 1D warping techniques which estimate image displacements (deformation) by minimizing
the difference and the NRMS decomposition into 4D attributes: SNR, RMS ratio, time shift, and dominant frequency
(Lecerf et al., 2015). The L2 norm in the usual warping inversion is replaced by the formulation of the NRMS
representing the normalized energy of the difference. By using this approach, the resulting time deformation
minimizes the NRMS and can be constrained by the dominant frequency of the wavelet and the noise level. The
technique allows the detection of very small 4D misalignments, and avoids the calculation of the time shift in very
low SNR areas. In the example used, various 4D responses could clearly be differentiated based upon amplitude
vs. time shift effects, thereby enabling interpretation of pressure/saturation vs. geomechanical effects (see Figure
2).

Distributed Acoustic Sensing (DAS)
The use of time shifts also introduces a new innovation in seismic acquisition; that of fiber-optic distributed acoustic
sensing (DAS), a methodology typically applied to borehole measurements, but also being extended to surface
seismic measurements. A DAS system measures strain (rate) along and parallel to the entire length of a fiber-optic
cable by emitting a laser pulse from an interrogator unit into the fiber cable and analyzing the backscattered light
shift. Although DAS systems have low SNR by comparison to conventional geophones (which measure the
displacement of particle motion), the signal quality can be addressed by stacking the data received from many
source events, and by virtue of the fact that the DAS cables are typically placed in-situ for extended periods of time
(Nakatsukasa et al., 2018), although coupling to the earth is relevant to the quality of DAS measurements just as it
is for geophone measurements (Kasahara et al., 2018). Bakulin et al. (2018b) connect individual wells using
continuous fiber to enable the creation of a long and densely sampled imaging array with both downhole and
trenched surface sensors (see also Bakulin et al., 2018a and 2018c); referred to as the ‘Smart DAS uphole
acquisition system’. Downhole components provide direct measurement of near-surface velocities, whereas shallow
horizontal segments can be used for surface-wave inversion or refraction tomography. Entire arrays can also be
simultaneously used for deep reflection imaging.

A Clearer Image │ www.pgs.com
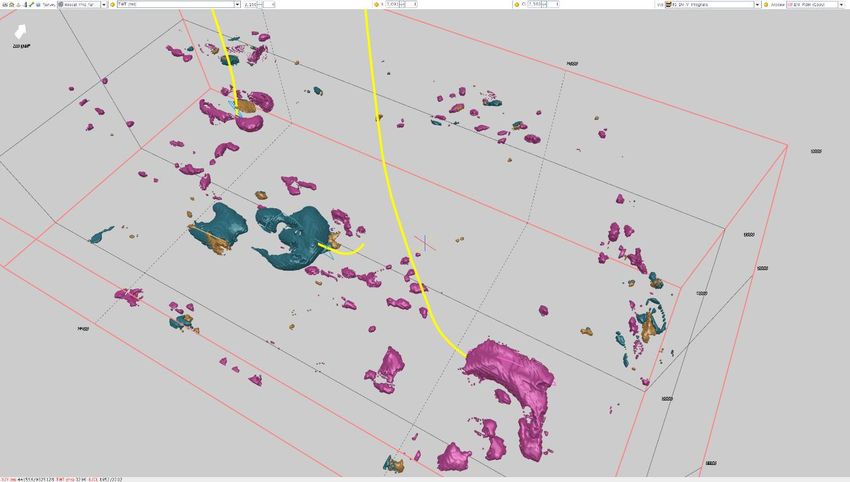
INDUSTRY INSIGHTS                                                                                     September 18

 By Andrew Long (Andrew.Long@pgs.com)                                                                            4 of 8

Figure 2. Geobody detection based on the DV and RMS ratio computation between the monitor and the
baseline seismic surveys. From Reiser et al. (2018), Fig. 6, with permission.
Byerley et al. (2018) installed a DAS system in a horizontal shale well to better understand the 4D response to
hydraulically stimulated fractures (‘fracking’), and compared to VSP data. The dominant 4D effect observed was a
subtle time delay of about 4 ms in the P-wave direct arrival when compared to data prior to each fracking stage. 4D
amplitude differences indicate the presence of new waveforms observed after fracking with the hypothesis that
these events are down-going P-to-S converted waves generated by hydraulically induced fractures above the well.
While the 3D/4D DAS-VSP results were somewhat disappointing with little or no observable 4D response over
longer time periods (identification of depleted reservoir zones not possible), the 4D analysis performed on the inter-
stage DAS seismic records helps validate this lack of response, suggesting that observable seismic changes
dissipated after several days. Future attempts to monitor hydraulic frac jobs will focus acquisition programs to
capture some of the smaller scale changes that are occurring as a well is being treated. Binder et al. (2018) attempt
to identify the mechanism causing the time delays by combining 2D finite difference modeling with an analytic 2D
stress field and an empirical relation between velocity and effective stress. Although the model used is too simplistic
to reliably characterize hydraulic fractures, it does predict time delays of the correct order of magnitude, suggestive
that DAS-VSP surveys can nevertheless invert for the geometry of hydraulic fractures in the future.

4D Synthetic Data Modeling and Feasibility Studies
Advanced seismic modeling continues to play an increasingly sophisticated role for both 4D data interpretation and
survey planning. El-Emam et al. (2018) describe a workflow for understanding how steam injection affects the
production of a heavy oil reservoir in North Kuwait. One challenge is that the conventional 4D rock physics models
fail in heavy-oil reservoirs due to the viscoelastic nature of the heavy oil. A viscoelastic fluid substitution model was
therefore implemented, and the frequency-dependent rock-physics model was then calibrated to Pressure-Volume-
Temperature (PVT) data, elastic properties of well logs, VSP, and seismic data at selective frequencies. The rock
physics model developed for heavy oil can translate the acoustic impedance variation into seismically-predicted
temperature variation at the time of baseline and monitor seismic surveys. The frequency dependency of this rock
physics model allows it to comprehend the different typical frequency ranges observed on VSP and surface seismic
data, and updating the thermal conductivity and hydraulic connectivity properties in the fluid flow simulation based
on the temperature maps can add significant value in the production history matching process.
Regards the pursuit of 4D feasibility studies, Kaderali et al. (2018) include seismic simulations wherein the
calculation of seismic responses is based on a ray-based pre-stack depth migration (PSDM) simulator approach,
using a simulated point-spread function (PSF) response that enables including the effects of overburden and survey

A Clearer Image │ www.pgs.com
INDUSTRY INSIGHTS                                                                                    September 18

 By Andrew Long (Andrew.Long@pgs.com)                                                                           5 of 8

geometry in addition to elastic properties of the target reservoir. The objectives were to investigate the detectability
of 4D signals from hydrocarbon production and to determine the suitability of using the existing survey as a baseline.
The simulation of the 3D PSDM response for the existing seismic acquisition was performed by calculating Point
Spread Functions (PSFs), and convolving the PSFs with reservoir reflectivity. PSFs represent the impulse response
of the modeling and imaging system, and can be interpreted as a depth and space-variant 3D wavelet. This
approach takes into account acquisition geometry, seismic source wavelet, propagation through the overburden,
and reservoir reflectivity; all important factors in a 4D feasibility study. Note that PSFs can also be computed using
finite difference propagators, and are discussed later in the context of reconciling the illumination of 4D surveys with
different acquisition geometry (Wei et al., 2018; and see also Lecerf and Basselievre, 2018). The results show that
4D signal can be detected from near incidence angle (0°) to far incidence angle (30°), and suggest that the larger
incidence angles provide a clearer difference in the seismic amplitudes. Large changes in seismic response are
shown after two years of production (2010–2012) where the change in seismic impedance is significant (>8%).
Furthermore, there are no significant differences in seismic amplitudes between using ideal synthetic survey
geometry and using the actual survey geometry; confirming that the 2008 survey geometry is adequate for a
baseline survey in areas that have good coverage, and not suitable for areas with no coverage or gaps. The area
with gaps in coverage of the 2008 survey is, however, outside the reservoir zone and does not affect the seismic
response of the reservoir.
4D Data Acquisition
Continuous and incremental improvements in 4D repeatability
SEG 2018 abstracts on 4D acquisition fall into two categories: doing existing streamer and seafloor 4D acquisition
better, and innovative ways to improve 4D survey efficiency. As is well established, there have been many
technology advancements in marine acquisition to improve 4D repeatability, such as steerable sources and
streamers, dynamic controls to record shots at any pre-plot location, the use of overlapping streamers, and the use
of multicomponent streamers within an appropriate shooting strategy (Long, 2018). Srinivasan et al. (2018) claim
that we often acquire more data than we need—primarily because of the lack of a quantitative approach to help
decide whether to reshoot and infill lines while shooting a 4D monitor survey. Consequently, a methodology was
developed using redundant dSdR (the sum of the distance between sources and the distance between receivers)
vs. NRMS amplitude information from previous baseline/monitor surveys to aid decision making for real-time 4D
acquisition optimization.
Another factor relevant to 4D repeatability is the accuracy with which tide heights and water velocities are derived—
particularly for seafloor surveys such as those using ocean bottom nodes (OBNs). Udengaard and Craft (2018)
show that combining pressure inverted echo sounder (PIES) data with additional field measurements of barometric
pressure and water column pressure, temperature, and conductivity will provide a high resolution model of the
acoustic water velocity and tide height as a function of time. The resulting velocity model is a good match to the
seismic velocities, thus allowing water column dynamics to be corrected before imaging more accurately than when
using modelled tides
Breaking the paradigm on repeated acquisition
The use of non-uniform and non-repeatable acquisition geometry is a counterintuitive idea what is slowly gaining
traction; especially in academia. Distributed compressive sensing techniques have been actively used in pre-
migration 4D processing (e.g. Oghenekohwo et al., 2017; Wason et al., 2017). The techniques are used to enable
sparse 4D acquisition for cost reduction, and to relax the requirement for repeatability between time-lapse surveys.
The idea of joint inversion or joint recovery has also been utilized to solve 4D imaging problems, and it generates
significantly improved 4D results compared with independent inversion on baseline and monitor (e.g. Qu and
Verschuur, 2016; Lecerf and Besselievre, 2018). Wei et al. (2018) expand these concepts using a technique
referred to as Joint Sparsity Recovery (JSR) to be applicable to the scenario of any multiple datasets that are
represented on the same regular grid (e.g. stacks), with a focus upon improving 4D seismic interpretability. JSR
can stably recover 4D signals through exploiting both intra- and inter-signal correlation structure. It quantifies the
common and unique parts between two or more input datasets with background noise suppressed. In the context
of sparse and/or non-uniform 4D acquisition, applying JSR to attenuate 4D noise can help achieve comparable or
even higher quality of 4D data with sparser acquisition at a decreased cost. An example is given wherein 4D
amplitude maps of the same area with two different acquisition and denoise scenarios are compared. In the first
scenario, conventional dense acquisition is used, and the 4D map is computed from difference between baseline
and monitor. In the second scenario, there are only half of the shots and half of the receivers (i.e. 75% reduction in
number of traces) for both baseline and monitor surveys, and JSR is used to attenuate 4D background noises – the
4D map is computed from difference between baseline and monitor innovations. Scenario 2 has lower background
noise level than scenario 1, and also shows sharper 4D softening and hardening boundaries and clearer 4D signals.

A Clearer Image │ www.pgs.com
INDUSTRY INSIGHTS                                                                                  September 18

 By Andrew Long (Andrew.Long@pgs.com)                                                                        6 of 8

Wei et al. (2018) therefore observe similar or even better 4D signatures with significantly reduced acquisition cost.
Note also how Lecerf et al. (2017) promote the use of separated wavefield imaging as a vehicle to facilitate sparser
OBN survey designs.
Autonomous 4D field operations
Beyond using less sources and receivers in ‘conventional’ 4D acquisition operations, Chalenski et al. (2018)
continue the theme they have developed in recent SEG conferences around the use of unmanned surface vessels
(ASVs), and also introduce a model for the cost of DAS-VSP surveys enabled by Rapid Autonomous Marine 4D
(RAM4D), which shows that dual RAM4D vessel operations are more robust to downtime. Compared to a typical
seismic vessel, RAM4D is approximately one-tenth the size, unmanned, and automated (programmed prior to
sailing for the acquisition). Smaller source volumes must be used due to the limited vessel size, although recent
work has demonstrated that while the data quality is reduced, small sources may be viable for 4D monitoring
(Chalenski et al., 2016). As with the introduction of any new seismic acquisition technology, Chalenski et al. (2018)
acknowledge that to achieve a disruptive reduction (e.g. 50%) in the day rates (for service companies) of the current
manned vessel costs, a greater industry uptake of RAM4D must occur to spread the upfront cost and risk to
manufacturers of building new vessels. Note that Lopez et al. (2018) extend the RAM4D concept to include a semi-
permanent Ocean Bottom Node (OBN) system that would remove the complexity of mobilizing node handling
vessels for each monitor survey (see Figure 3). Harvesting the data from the nodes in-situ using a field-resident
AUV would remove all remaining activity on the surface regarding node operations, thus providing an ‘on-demand’
OBN system that was entirely managed by remote control.
                                                                              Figure 3. On-demand OBN
                                                                              surveillance system, featuring long-
                                                                              endurance semi-permanent seabed
                                                                              nodes that record active and passive
                                                                              seismic and seafloor deformation,
                                                                              with data harvesting enabled by a
                                                                              field resident AUV which uploads the
                                                                              harvested data via its subsea
                                                                              docking station. From Lopez et al.
                                                                              (2018), Fig. 1, with permission.

A Clearer Image │ www.pgs.com
INDUSTRY INSIGHTS September 18 By Andrew Long (Andrew.Long@pgs.com) 7 of 8 References Bakulin, A., Golikov, P., Erickson, K., Silvestrov, I., Kim, Y.S., Smith, R., and Al-Ali, M., 2018a, Seismic imaging of vertical array data acquired using smart DAS uphole acquisition system. SEG Expanded Abstracts, 4050-4054. Bakulin, A., Golikov, P., Smith, R., Erickson, K., Silvestrov, I., and Al-Ali, M., 2018b, Smart DAS uphole acquisition system for near-surface characterization and imaging. SEG Expanded Abstracts, 201-205. Bakulin, A., Silvestrov, I., and Pevzner, R., 2018c, Surface seismic with DAS: Looking deep and shallow at the same time. SEG Expanded Abstracts, 16-20. Binder, G., Titov, A., Tamayo, D., Simmons, J., Tura, A., Byerley, G., and Monk, D., 2018, Time delays from stress-induced velocity changes around fractures in a time-lapse DAS VSP. SEG Expanded Abstracts, 5328-5332. Byerley, G., Monk, D., Yates, M., and Aaron, P., 2018, Time-lapse seismic monitoring of individual hydraulic-frac stages using a downhole DAS array: Part 1 — Field experiment and observations. SEG Expanded Abstracts, 5293-5297. Chalenski, D.A., Lopez, J., Hatchell, P., Grandi, S., Broker, K., Hornman, K., Anderson, B., Marzolf, T., Chance, S., Jurisich, J., Hibben, T., and Shutepp, R., 2018, Rapid autonomous marine 4D (RAM4D): Developing unmanned 4D seismic surveys. SEG Expanded Abstracts, 5288-5292. Chalenski, D.A., Wang, K., Lopez, J., Hatchell, P., Wills, P., Chen, Y., Griswold, S., and Patrikeeva, N., 2016, Small acoustic sources for low-cost reservoir monitoring offshore. The Leading Edge, 35(10), 860– 866. Dvorak, I., and MacBeth, C., 2018, Dynamic overburden interpretation using prestack time shifts. SEG Expanded Abstracts, 5303-5307. Dvorak, I., MacBeth, C., and Amini, H., 2018, Evaluating 4D overburden velocity perturbation for the Shearwater field via pre-stack time-shift inversion. EAGE Extended Abstracts, Tu A15 13. El-Emam, A., Al-Jenaie, J., Bayri, H., Zahran, W., and Koeninger, C., 2018, Imaging of 4D seismic during steam injection for shallow heavy oil reservoir in North Kuwait. SEG Expanded Abstracts, 5268-5272. Kaderali, A., Koesoemadinata, A., Moldoveanu, N., Chugunov, N., and Altundas, Y.B., 2018, Application of an efficient workflow for 4D time-lapse seismic feasibility analysis. SEG Expanded Abstracts. 5318- 5322. Kasahara, J., Hasada, Y., Kawashima, H., Sugimoto, Y., Yamauchi, Y., Yamaguchi, T., and Yamaguchi, K., 2018, Comparison of DAS (distributed acoustic sensor) and seismometer measurements to evaluate physical quantities in the field. SEG Expanded Abstracts, 191-195. Lecerf, D., and Besselievre, M., 2018, A new approach to compensate for illumination differences in 4D surveys with different individual acquisition geometries. First Break, 36(2), 71–76. (https://www.pgs.com/globalassets/technical-library/tech-lib- pdfs/fb_lecerf_etal_feb2018_4dsynthetic.pdf) Lecerf, D., Barros, C., Hodges, E., Valenciano, A., Lu, S., Chemingui, N., Johann, P., and Thedy, E., 2017, Very sparse seabed seismic acquisition for 3D/4D reservoir imaging with high-order multiples. Application to Jubarte PRM. EAGE Extended Abstracts, Tu A1 12. (https://www.pgs.com/globalassets/technical-library/whitepapers- library/2017June_Lecerf_etal_VerySparse.pdf) Lecerf, D., Burren, J., Hodges, E., and Barros, C., 2015, Repeatability measure for broadband 4D seismic. SEG Expanded Abstracts, 5483–5487. (https://www.pgs.com/globalassets/technical-library/tech-lib- pdfs/seg2015_lecerf-et-al.pdf) Long, A., 2018, Streaming ahead – examining best practice 4D streamer survey lessons. Oilfield Technology, 11(5), 13-16. (https://www.pgs.com/globalassets/technical-library/tech-lib- pdfs/oilfieldtechnology_long_may2018_streaming_ahead.pdf) A Clearer Image │ www.pgs.com
INDUSTRY INSIGHTS                                                                                    September 18

 By Andrew Long (Andrew.Long@pgs.com)                                                                           8 of 8

Lopez, J.L., Chalenski, D.A., and Grandi, S., 2018, Developing a fully autonomous marine seismic
acquisition system for low-cost on-demand reservoir monitoring. EAGE workshop on Marine Acquisition,
Oslo, Th MA 07.
MacBeth, C., Mangriotis, M.-D., and Amini, H., 2018, An interpretation and evaluation of poststack 4D
seismic time shifts. SEG Expanded Abstracts, 5308-5312.
Nakatsukasa, M., Ban, H., Kato, H., Shimoda, N., White, D., and Nickel, E., 2018, VSP acquisition with
combined fiber-optic DAS and permanent seismic source ACROSS for permanent reservoir monitoring
at the Aquistore site. SEG Expanded Abstracts, 5273-5277.
Oghenekohwo, F., Wason, H., Esser, E., and Herrmann, F., 2017, Low-cost time-lapse seismic with
distributed compressive sensing — Part 1. Exploiting common information among the vintages:
Geophysics, 82, no. 3, P1–P13.
Qu, S., and Verschuur, D.J., 2016, Simultaneous time-lapse imaging via joint migration and inversion.
EAGE Extended Abstracts, Tu LHR2 11.
Reiser, C., Webb, B., Bertarini, M., Lecerf, D., Milluzzo, V., and Rizzetto, C., 2018, 4D analysis, combining
shallow hydrophone and multicomponent streamer: The Cinguvu Field Offshore Angola example. SEG
Expanded      Abstracts,     5278-5282.        (https://www.pgs.com/globalassets/technical-library/tech-lib-
pdfs/seg2018_reiser_etal_streamer-4d-analysis.pdf).
Srinivasan, A., Lu, X., and Bishop, J.J., 2018, Real-time 4D acquisition optimization for marine streamer
surveys. SEG Expanded Abstracts, 5313-5317.
Udengaard, C., and Craft, K., 2018, Tidal height and water velocity from PIES: Processing of shallow and
deepwater examples. SEG Expanded Abstracts, 5263-5267.
Wason, H., Oghenekohwo, F., and Herrmann, F., 2017, Low-cost time-lapse seismic with distributed
compressive sensing — Part 2. Impact on repeatability: Geophysics, 82(3), P15–P30.
Wei, L., Tian, Y., Li, C., Oppert, S., and Hennenfent, G., 2018, Improve 4D seismic interpretability with
joint sparsity recovery. SEG Expanded Abstracts, 5338-5342.

PGS Links
4D (https://www.pgs.com/marine-acquisition/tools-and-techniques/4d2/)
Permanent Reservoir Monitoring (https://www.pgs.com/marine-acquisition/services/permanent-reservoir-
monitoring/)
4D Processing (https://www.pgs.com/globalassets/technical-library/tech-lib-
pdfs/oilfieldtechnology_long_may2018_streaming_ahead.pdf)
4D Interpretation (https://www.pgs.com/reservoir/services/production/)
SWIM (https://www.pgs.com/marine-acquisition/tools-and-techniques/geostreamer/technology/imaging-
with-separated-wavefields/)

A Clearer Image │ www.pgs.com
You can also read