5-Year Planning Round: Delivering Strategy Together 2025 - Volkswagen Group

Page created by Darlene Vazquez
 
CONTINUE READING
5-Year Planning Round: Delivering Strategy Together 2025 - Volkswagen Group
5-Year Planning Round: Delivering Strategy Together 2025
5-Year Planning Round: Delivering Strategy Together 2025 - Volkswagen Group
Disclaimer
The following presentations contain forward-looking statements and information on the business development of the Volkswagen Group. These statements may
be spoken or written and can be recognized by terms such as “expects”, “anticipates”, “intends”, “plans”, “believes”, “seeks”, “estimates”, “will” or words with
similar meaning. These statements are based on assumptions, which we have made on the basis of the information available to us and which we consider to be
realistic at the time of going to press. These assumptions relate in particular to the development of the economies of individual countries and markets, the
regulatory framework and the development of the automotive industry. Therefore the estimates given involve a degree of risk, and the actual developments may
differ from those forecast. The Volkswagen Group currently faces additional risks and uncertainty related to pending claims and investigations of Volkswagen
Group members in a number of jurisdictions in connection with findings of irregularities relating to exhaust emissions from diesel engines in certain Volkswagen
Group vehicles. The degree to which the Volkswagen Group may be negatively affected by these ongoing claims and investigations remains uncertain.

Consequently, a negative impact relating to ongoing claims or investigations, any unexpected fall in demand or economic stagnation in our key sales markets, such
as in Western Europe (and especially Germany) or in the USA, Brazil or China, and trade disputes among major trading partners will have a corresponding impact
on the development of our business. The same applies in the event of a significant shift in current exchange rates in particular relative to the US dollar, sterling,
yen, Brazilian real, Chinese renminbi and Czech koruna.

If any of these or other risks occur, or if the assumptions underlying any of these statements prove incorrect, the actual results may significantly differ from those
expressed or implied by such statements.

We do not update forward-looking statements retrospectively. Such statements are valid on the date of publication and can be superseded.

This information does not constitute an offer to exchange or sell or an offer to exchange or buy any securities.
5-Year Planning Round: Delivering Strategy Together 2025 - Volkswagen Group
5-Year Planning Round: Groundwork to Deliver Strategy Together 2025

       Frank Witter            Dr. Christian Dahlheim           Oliver Larkin
     Member of the Board of        Director Group Sales   Head of Group Investor Relations
   Management, Volkswagen AG          Volkswagen AG               Volkswagen AG
     Finance and Controlling

                                                                                             3
5-Year Planning Round: Delivering Strategy Together 2025 - Volkswagen Group
Setting the Stage PR 67

                                                 Trade-terms turmoil
                              Economics
                                                 Currency volatility

                                                 CO2 challenge & risk of penalties
                          Emissions & Testing    Resources
                                                 WLTP, RDE …
                                                   Launch target
                                                   Margin pressure
                              E-Mobility
                                                   Battery cell supply
                                                   Infrastructure

                                                 Diesel demand
                              Powertrain         Cost impacts
                                                 Mix issues

                                                 Connectivity & autonomous
                            Digitalization       Resources & cost
                                                 Agility

                                                                                      4
5-Year Planning Round: Delivering Strategy Together 2025 - Volkswagen Group
Development Volkswagen Group Deliveries to Customers

bf

     > 2017

     2018     Europe   North America   South America   Asia Pacific   Rest of the World   2023

                                                                                                 5
5-Year Planning Round: Delivering Strategy Together 2025 - Volkswagen Group
Strong increase in our Worldwide SUV Mix
                            SUV share in % of regional Group deliveries to customers

                  80

                  70
                                                                                            NAR
                  60                                                                        China

                  50                                                                        World
                                                                                            Europe
                  40

                  30

                  20
                    2018   2019   2020   2021   2022   2023   2024   2025   2026   2027   2028

                                                                                                     6
5-Year Planning Round: Delivering Strategy Together 2025 - Volkswagen Group
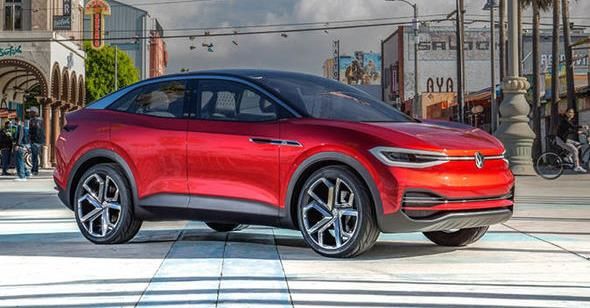
Strong Electrification of Product Portfolio
                                                     BEV volume per region in thousand units

                     5.000                                                      VW ID. Lounge       Until 2025:
                                                                                                   +50 new BEVs
                                                                     VW ID. Vizzion
                     4.000                                                                                          World
                                                         VW ID. Buzz

                     3.000                     VW ID. Crozz
                                               Audi A SUVe
                                                                                                                    China
                     2.000
                                     VW ID. Neo
                                    Porsche Taycan
                     1.000                                                                                          Europe
                        Audi e-tron
                                                                                                                    NAR

                             2019       2020      2021        2022       2023      2024     2025    2026   2027   2028

                                                                                                                             7
5-Year Planning Round: Delivering Strategy Together 2025 - Volkswagen Group
BEV Growth mainly driven by SUV Models
                            SUV share in % of regional BEV Group deliveries to customers

                  100

                   80
                                                                                       NAR
                                                                                       China
                   60                                                                  World
                                                                                       Europe
                   40

                   20

                    0
                     2019    2020   2021   2022   2023   2024   2025   2026   2027   2028

                                                                                                8
5-Year Planning Round: Delivering Strategy Together 2025 - Volkswagen Group
The Future Sales Model
            Retail partnerships ready for the future – Customer is central to all touch-points

   Entrepreneurship        Efficient retail/service                                                  New joint customer
                                                                  Efficient and lean
                           network (market area                                                    approach between OEM,
                                                                   processes and IT
                           concept) and formats                                                      importer and dealer

      Consumer
                            Integrated customer          Ecosystem      Digital products, Functions  Seamless online and
      Centricity
                           data management for            for more     on Demand and new services offline customer journey
                           direct customer access     customer loyalty    for additional business   to meet expectations

    Profitability &
      Efficiency                                                     Over-the-Air                     Integrated, direct
                             Segment-specific
                                                                diagnosis and updates                 online channel for
                           customer orientation
                                                                   sales and service           lean sales and service activities

                                                                                                                                   9
5-Year Planning Round: Delivering Strategy Together 2025 - Volkswagen Group
Improving Group Return on Sales despite significant headwinds

                          Return on Sales
                                                                                        7.0 - 8.0%
                                       6.5 - 7.5%                          6.5 - 7.5%
                                7.4%
                         6.7%

                                                    Industry transition
                                                    Emission costs / CO2

                                                    Performance
                                                    improvement programs

                         2016   2017    2018                                  2020        2025
                         Base          Outlook                               Target      Target

                                                                                                     10
Delivering Strategy Together 2025

Strategy:        Remains unchanged

Outcome PR 67:   Increased Headwinds fully compensated by improved
                 Operational Performance!

KPI’s:           Still fully on track for Targets in 2020 and 2025!

                                                          We are still on track!

                                                                                   11
Group KPI’s confirmed
Key financial targets                                                     2016                            2017                          2018                          2020                            2025
                                                                          Actual                          Actual                       Outlook                       Targets                         Targets

Operating return on sales                                                   6.7%                            7.4%                       6.5-7.5%                     6.5-7.5%                            7-8%
Before Special Items

Return on investment                                                      13.9%                            14.4%                        12-14%                       13-15%                            > 15%
Automotive Division before Special Items

Capex ratio                                                                 6.9%                            6.4%                         6.5-7%                           6%                              6%
Automotive Division

R&D cost ratio                                                              7.3%                            6.7%                         6.5-7%                           6%                              6%
Automotive Divison

Cash                     a) Net Cashflow2)                              € 7.2 bn                        € 10.1bn                        ≥ € 9 bn                   ≥ € 10 bn                       > € 10 bn
Automotive Division
                                                                                                                                                                                                 ~10% of Group
                        b) Net Liquidity                               € 27.2 bn                       € 22.4 bn                      > € 20 bn                   > € 20 bn3)                      turnover

1) As   of 1st August, 2018. 2) Ex diesel payments; cash outflows of around € 3 bn in 2016, € 16.1 bn in 2017 and € 3.3 bn in Q1-Q3 2018. 3) Including the negative IFRS 16 impact, effective from 1st January 2019.   12
Better Earnings Quality & EPS growth
                           Basis: Result 2016                2020 Updated
                                                   CMD             PR 66      PR 67
                                                March 2017

Sales revenue (€ bn)             217.3          + > 20 %        + > 25 %    + > 25 %

Operating profit (€ bn)
before Special Items             14.6           + 25 %           + ≥ 25 %   + > 30 %

Profit before tax (€ bn)         14.8           + ≥ 25 %         + ≥ 30 %    + ≥ 40 %

Earnings per Pref. Share         10.3 €         + ≥ 25 %        + > 25 €    + ≥ 30 €

                                                                                        13
Brand Targets (RoS, RoE) confirmed

 Return on Sales in %1)                                                         2016                           2017                     Target 2018                                2020                     2025

 Volkswagen Group                                                                 6.7                            7.4                         6.5-7.5                              6.5-7.5                 7.0-8.0
 Volkswagen Brand                                                                 1.8                            4.1                            4-5                                  4-5                      ≥6
 Audi                                                                            8.2                            8.4                            8-10                                 8-10                    8-10
 Porsche Automotive                                                             17.4                           18.5                            >15                                  >15                     >15
 ŠKODA                                                                           8.7                            9.7                            8-9                                   6-7                     ≥7
 Volkswagen Commercial Vehicles                                                  4.1                            7.2                            5-6                                   4-5                     >6
 TRATON2)                                                                       2016                           2017                     Target 2018
                                                                                                                                                                                           Over the cycle
 •     Scania                                                                     9.5                                                                                                      target of 9%3)
                                                                                                                 6.9                            6-7
 •     MAN Commercial Vehicles                                                    2.3

 Return on Equity (norm. 8%)                                                    2016                           2017                     Target 2018                                2020                     2025

 Volkswagen Financial Services                                                 15.6%                          15.8%                         14-16%                               14-16%                      20%

1)Before special items. 2) For peer-group analysis: Truck & Bus Business RoS is calculated as the sum of Scania and MAN Commercial Vehicles. 3) Strategic target the Truck and Bus Business wants to achieve over
the cycle                                                                                                                                                                                                           14
Tasks and Counter-Measures
                                Tasks                                   Counter-measures

                             Close the Gaps in Operating       Push efficiency programs, discipline vs.
                             Profit, CapEx, R&D !              securing the future

                                                               Stick rigorously to cash generation
                             Cash is King !
                                                               targets

                                                               Reach CO2 requirements
                             Sustain ICE margins & secure EV
                                                               Timely launches, attractive products and
                             margins !
                                                               pricing strategies

                                                               Delete certain derivatives and engine
                             Reduce Complexity !
                                                               combustion combinations

                                                               Prioritisation of projects, platform
                             RoI does matter, too !
                                                               discipline and multi-brand factories

                                                                                                          15
You can also read