Irony Detector at SemEval-2018 Task 3: Irony Detection in English Tweets using Word Graph - Association for ...
←
→
Page content transcription
If your browser does not render page correctly, please read the page content below
Irony Detector at SemEval-2018 Task 3: Irony Detection in English
                         Tweets using Word Graph
        Usman Ahmed, Lubna Zafar, Faiza Qayyum and Muhammad Arshad Islam
                             Parallel Computing Network,
                            Department of Computer Science,
                     Capital University of Science and Technology,
                                  Islamabad, Pakistan.
                           usmanahmed189@gmail.com,
                               lubbnaa@gmail.com,
                           faizaqayyum@cust.edu.pk,
                         arshad.islam@cust.edu.pk.
                Abstract                      happening around the world, and what are the cur-
                                                             rent top-interest areas among the wider population
    This paper describes the Irony detection sys-            (Rosenthal et al., 2017). According to a recent sur-
    tem that participates in SemEval-2018 Task
                                                             vey, 6000 tweets per second are sent by 320 mil-
    3: Irony detection in English tweets. The
    system participated in the subtasks A and B.             lion active monthly users, thus 500 million tweets
    This paper discusses the results of our sys-             per day (Statistics, 2014). This poses a challenge
    tem in the development, evaluation and post              for the scientific community to accurately discern
    evaluation. Each class in the dataset is repre-          the sentiment of a tweet out of this plethora. Since
    sented as directed unweighted graphs. Then,              certain aspects associated with sentiment analysis
    the comparison is carried out with each class            are quite arduous yet feasible to ascertain (such as
    graph which results in a vector. This vector             negative, positive, a neutral aspect of the opinion)
    is used as features by machine learning algo-
                                                             than irony.
    rithm. The model is evaluated on a hold on
    strategy. The organizers randomly split 80%                 Irony detection has its implications in senti-
    (3,833 instances) training set (provided to the          ment analysis (Reyes et al., 2009), opinion min-
    participant in training their system) and test-          ing (Sarmento et al., 2009) and advertising (Kreuz,
    ing set 20% (958 instances). The test set is             2001). For the past few years, irony-aware sen-
    reserved to evaluate the performance of par-             timent analysis has attained significant computa-
    ticipants systems. During the evaluation, our
                                                             tional treatment due to the prevalence of irony on
    system ranked 23 in the Coda Lab result of
    the subtask A (binary class problem). The bi-
                                                             the web content (Farı́as et al., 2016). It is a broad
    nary class system achieves accuracy 0.6135,              concept, which has an association with multiple
    precision 0.5091, recall 0.7170 and F mea-               disciplines such as psychology, linguistics, etc.
    sure 0.5955. The subtask B (multi-class prob-            The irony is to efficaciously delineate a contrary
    lem) system is ranked 22 in Coda Lab results.            aspect of the utterance (Grice, 1975). Irony cannot
    The multiclass model achieves the accuracy               be detected with the simple scrutiny of words ex-
    0.4158, precision 0.4055, recall 0.3526 and f            pressed in a statement, whereas, an aspect of irony
    measure 0.3101.
                                                             is implicitly connected with the utterance. Fur-
                                                             thermore, it could be deemed as a stance that has
1   Introduction
                                                             been expressed in an ironic or sarcastic environ-
Social media are deemed as a diverse web-based               ment (Grice, 1975; Alba-Juez and Attardo, 2014).
network that serves as an online platform to com-            Detection of this implicit aspect poses a strenuous
municate and disseminate information or ideas                computational challenge over the scientific com-
among individuals and fraternities. Since its ad-            munity in terms of initiating effective models in
vent, people all around the globe harness it as a            this regard. In the stream of irony detection, the
major source to express their opinions or emo-               first-ever computer model was proposed by (Ut-
tions, however, an expeditious increase in its us-           sumi, 1996). Subsequently, various other mod-
age has been reported in the last decade (Kelly              els have been presented that have specifically ad-
et al., 2016; Perrin, 2015). Among the multifar-             dressed the irony detection among tweets by us-
ious range of social media platforms, Twitter is             ing different features such as, cue-words or user-
the most popular one. It is basically a microblog-           generated tags (i.e., Hashtags) etc (Van Hee, 2017;
ging site diffuses information pertaining to what is         Hernández-Farı́as et al., 2015; Reyes et al., 2013).

                                                       581
        Proceedings of the 12th International Workshop on Semantic Evaluation (SemEval-2018), pages 581–586
              New Orleans, Louisiana, June 5–6, 2018. ©2018 Association for Computational Linguistics
Figure 1: Graph Construction with vicinity size 2 illustrates how the vicinity size move toward the end of
the tweet; in this example the frame is the two following words and for each word some edges and nodes
are added to the graph.
Though, there does not exist any optimal model 4. Non-irony
that could be considered as a baseline for irony de-
tection. This paper presents a model to automati- Systems are evaluated using standard evaluation
cally detect sarcasm or irony from the plethora of metrics, including accuracy, precision, recall and
tweets. The proposed model is used in the two F1-score.
subtasks. The first module assigns the binary value 3 Proposed Model
against tweets (i.e., 1 indicates that tweet in ironic
and 0 indicates that a tweet is non-ironic). The sec- The proposed model is inspired by the previous
ond module performs multi-class classification: (i) work (Giannakopoulos et al., 2008; Maas et al.,
verbal irony realized through a polarity contrast, 2011), however, we used some additional features
ii) verbal irony without such a polarity contrast as well as a word graph similarity score. Each
(i.e., Other verbal ironies), iii) descriptions of situ- tweet is represented as directed unweighted word
ational irony and iv) non-irony. For classification, graph and the edge between each word is created
data set is comprised of 4792 samples, taken from based on the vicinity window size explained in
GitHub link provided by the SemEval 2018 orga- 1. Each class in the dataset is represented as di-
nizers. rected unweighted graphs. Then, the comparison
is carried out with each class graph which results
2 Task Overview in a vector. This vector is used as features by ma-
In SemEval-2018 (Cynthia Van Hee, 2018), task 3 chine learning algorithm. The graph is constructed
contains two subtasks for the detection of Irony in based on a class assignment and then we measure
English tweets. In the first task, the system has to the similarity of a tweet with each class graph. The
determine whether a tweet is ironic or non- ironic, similarity between two graphs (tweet graph and
making it a binary classification problem. The sec- class graph) can be measured in multiple ways,
ond task is the multiclass classification problem but in this research, we used the containment simi-
where the ironic and non-ironic task is further di- larity (non-normalized value), maximum common
vided into four categories as mentioned below: subgraph similarity and its variant compare graph
in terms of similarity.
1. verbal irony realized through a polarity con-
trast 3.1 Graph Construction
The tweet contained a set of words. Theses word
2. verbal irony without such a polarity contrast
will be used to construct the word graph based
(i.e., other verbal irony)
on their vicinity. Each word in the tweet is rep-
3. descriptions of situational irony resented by the labelled node. The nodes within
582Class Name Number of Coloumn
Verbal irony by means of a polarity contrast 1728
Other types of verbal irony 267
Situational Irony 401
Non-Ironic 604
Table 1: Data set Description
window size are joined by an edge. The sequence 3.3 Feature Engineering
of the words is preserved by using directed edges. 3.3.1 Containment Similarity
The size of the vicinity window can affect the ac-
The containment similarity measure has been used
curacy of the method. In this research, we used a
to calculate, graph similarity (Aisopos et al.,
vicinity size of 2, as seen in 1
2012). In this research, we used bigram nodes.
The graph similarity between the graph of a The measure expresses the common edges be-
tweet and the graph of the irony class can define tween two graphs by the number of edges of the
the degree of irony in the tweet. For the purposes smaller graph.
of our study, we used the containment similarity
(non-normalized value), maximum common sub- P
graph similarity and its variant compare graph. e=G µ(e, G S )
CS(G T , G S ) = T
(1)
min(|G T |, |G S |)
3.2 Dataset Where GT (target graph) is the word graph of a
tweet, Gs (source graph) is the word graph of an
The dataset is provided on the GitHub source. irony classes. The graph size can be the number
This corpus is constructed of 3,000 English lan- of nodes or edges that are contained. e is an edge
guage tweets. These tweets are searched by us- of a word graph.
ing hashtags #irony, #sarcasm and #not. The data
were collected from the period of five months (1st 3.3.2 Maximum Common Sub graph
December 2014 to 1st April 2015) and represent The maximum common sub graph similarity is
2,676 unique users. All tweets were manually an- based on the size of the graph. We used the three
notated using the scheme of Van el al (Van Hee variations of the metric are described in the equa-
et al., 2016). The organizer used the services of tion 2, 3 and 4
three students in linguistics as well as English lan-
guage speakers to annotate the entire corpus. The M CSN (|G T |, |G S |)
(Stenetorp et al., 2012) tool was used as the an- M CSN S = (2)
min(|G T |, |G S |)
notation tool. The percentage agreement score
(kappa scores 0.72) is also calculated for the an- Maximum Common Sub graph Node Similarity
notation. The number of instances for each class (MCSNS): where MCSNS (GT (target graph) —
is mentioned in Table 1. Gs (source graph)) is the total number of nodes
As seen in Table, 2396 instances are ironic that are contained in the MCS of that graphs..
(1,728 + 267 + 401) while 604 are non-ironic. The
organizer balances the class data by using back- M CSU E(|G T |, |G S |)
ground corpus. After balancing the total data set M CSU ES = (3)
min(|G T |, |G S |)
contain 4,792 tweets that contain 2,396 ironic and
2,396 non-ironic tweets. The SemEval-2018 com- Maximum Common Sub graph Edge Similarity
petition used the hold on the strategy to check (MCSNS): where MCSUE (GT (target graph) —
the effectiveness of each participated system. The Gs (source graph)) is the total number of the edges
organizers randomly split 80% (3,833 instances) contained in the MCS regardless the direction of
training set (provided to the participant in training them.
their system) and testing set 20% (958 instances).
The test set is reserved to evaluate the performance M CSDE(|G T |, |G S |)
of participants systems. M CSDES = (4)
min(|G T |, |G S |)
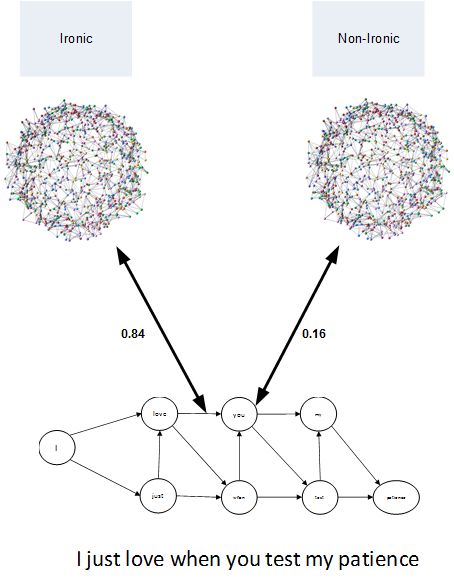
583Figure 2: Graph Similarity Feature Extraction for one measure. The graph of a tweet used to compare with
training data class graphs, in order to produce two numbers (depending upon the numbers of classes).
These numbers will be used as a feature vector. The feature vector is provided to trained model to predict
the class of the new tweet.
Maximum Common Sub graph Directed Edge Sim-
ilarity (MCSNS): where MCSDES (GT (target
graph) — Gs (source graph)) is the number of the
edges contained in the MCS and have the same di-
rection in the graphs.
3.3.3 Tweet Polarity and Latent Dirichlet
Allocation
We used the SenticNet library to calculate the sen-
tence polarity score as well as subjectivity score.
Moreover, we also perform latent Dirichlet Al-
location on the corpus and then used the trained
model to calculate similarity helinger distance for
each class (Blei et al., 2003; Beran, 1977).
3.4 Model Selection
In this paper, we used Tree-based Pipeline Opti-
mization Tool (TPOT) that designs and optimizes
the machine learning pipelines by using an evo- Figure 3: Precision Recall Curve of Binary Class
lutionary algorithm (Olson et al., 2016). The la- problem
belled data are provided for TPOT classification.
Both TPOT classes return hyper tune model for
both types of data (binary and Multiclass prob-
lem). After, data analysis, it was observed that
the number of classes in the multiclass dataset is a
584ture of graphs with classification algorithm. The
word graphs can seize the collection of the words
that are contained in a tweet. The tweet word
graph is generated and then by using several graph
similarity techniques is applied to the dataset.
These graph similarity metrics output is repre-
sented as a feature vector by the classification al-
gorithm. It is concluded that word graph with dif-
ferent vicinity window is a good source of infor-
mation to classify irony in the tweet. The model
can be improved by using a large dataset. The pro-
posed method can be enhanced by using a differ-
ent graph similarity metric as features. The word
Figure 4: Precision Recall Curve of Multi Class graph construction method with different vicinity
problem window size might improve results.
significant imbalance, which gives rise to the class References
imbalance problem. In order to handle this prob- Fotis Aisopos, George Papadakis, Konstantinos Tser-
lem, we used SMOTE (Cummins et al., 2017) a pes, and Theodora Varvarigou. 2012. Content vs.
Python toolbox to tackle the curse of imbalanced context for sentiment analysis: a comparative anal-
ysis over microblogs. In Proceedings of the 23rd
data. For binary classification problem, TPOT ACM conference on Hypertext and social media,
gives extreme gradient boosting classifier tune pa- pages 187–196. ACM.
rameters. For the multiclass problem, TPOT gives
Laura Alba-Juez and Salvatore Attardo. 2014. The
stacking of extreme gradient boosting classifiers, evaluative palette of verbal irony. Evaluation in con-
extra trees classifier and random forest classifier. text, 242:93.
4 Results Evaluation Rudolf Beran. 1977. Minimum hellinger distance esti-
mates for parametric models. The annals of Statis-
tics, pages 445–463.
For experimentation, we used efficient tool sklearn
(Machine Learning Library) to train machine David M Blei, Andrew Y Ng, and Michael I Jordan.
models mentioned above (Pedregosa et al., 2011). 2003. Latent dirichlet allocation. Journal of ma-
For both model hold on strategy was adopted. chine Learning research, 3(Jan):993–1022.
Training data contain 80% (3,833 instances) and Chris Cummins, Pavlos Petoumenos, Zheng Wang, and
testing sets 20% (958 instances). Our system Hugh Leather. 2017. Synthesizing benchmarks for
ranked 23 in the Coda Lab result of the binary predictive modeling. In Code Generation and Op-
timization (CGO), 2017 IEEE/ACM International
classification problem. The binary class system Symposium on, pages 86–99. IEEE.
achieves accuracy 0.6135, precision 0.5091, recall
0.7170 and F measure 0.5955. After the release Veronique Hoste Cynthia Van Hee, Els Lefever. 2018.
Semeval-2018 task 3: Irony detection in english
of the gold set, the model is again tuned by us- tweets. in proceedings of the 12th international
ing TPOT library and result are evaluated as seen workshop on semantic evaluation.
in Figure 3. Our system ranked 22 in the Coda
Delia Irazú Hernańdez Farı́as, Viviana Patti, and Paolo
Lab result of the multi-class problem. The multi- Rosso. 2016. Irony detection in twitter: The role
class model achieves the accuracy 0.4158, preci- of affective content. ACM Transactions on Internet
sion 0.4055, recall 0.3526 and f measure 0.3101. Technology (TOIT), 16(3):19.
After the release of the gold set model was re- George Giannakopoulos, Vangelis Karkaletsis, George
trained and evaluated. The result of the multiclass Vouros, and Panagiotis Stamatopoulos. 2008. Sum-
problem is shown in Figure 4 marization system evaluation revisited: N-gram
graphs. ACM Transactions on Speech and Language
Processing (TSLP), 5(3):5.
5 Conclusion and Analysis
H Paul Grice. 1975. Logic and conversationin p. cole
An innovative citation classification technique is and j. morgan (eds.) syntax and semantics volume 3:
proposed that combines the well-described struc- Speech acts.
585Irazú Hernández-Farı́as, José-Miguel Benedı́, and Pontus Stenetorp, Sampo Pyysalo, Goran Topić,
Paolo Rosso. 2015. Applying basic features from Tomoko Ohta, Sophia Ananiadou, and Jun’ichi Tsu-
sentiment analysis for automatic irony detection. In jii. 2012. Brat: a web-based tool for nlp-assisted
Iberian Conference on Pattern Recognition and Im- text annotation. In Proceedings of the Demonstra-
age Analysis, pages 337–344. Springer. tions at the 13th Conference of the European Chap-
ter of the Association for Computational Linguistics,
Brendan S Kelly, Ciaran E Redmond, Gregory J Na- pages 102–107. Association for Computational Lin-
son, Gerard M Healy, Niall A Horgan, and Eric J guistics.
Heffernan. 2016. The use of twitter by radiology
journals: an analysis of twitter activity and impact Akira Utsumi. 1996. A unified theory of irony and
factor. Journal of the American College of Radiol- its computational formalization. In Proceedings of
ogy, 13(11):1391–1396. the 16th conference on Computational linguistics-
Volume 2, pages 962–967. Association for Compu-
R Kreuz. 2001. Using figurative language to increase tational Linguistics.
advertising effectiveness. In Office of naval re-
search military personnel research science work- Cynthia Van Hee. 2017. Can machines sense irony?:
shop. Memphis, TN. exploring automatic irony detection on social media.
Ph.D. thesis, Ghent University.
Andrew L Maas, Raymond E Daly, Peter T Pham, Dan
Huang, Andrew Y Ng, and Christopher Potts. 2011. Cynthia Van Hee, Els Lefever, and Véronique Hoste.
Learning word vectors for sentiment analysis. In 2016. Exploring the realization of irony in twitter
Proceedings of the 49th annual meeting of the as- data. In LREC.
sociation for computational linguistics: Human lan-
guage technologies-volume 1, pages 142–150. Asso-
ciation for Computational Linguistics.
Randal S Olson, Nathan Bartley, Ryan J Urbanowicz,
and Jason H Moore. 2016. Evaluation of a tree-
based pipeline optimization tool for automating data
science. In Proceedings of the Genetic and Evolu-
tionary Computation Conference 2016, pages 485–
492. ACM.
Fabian Pedregosa, Gaël Varoquaux, Alexandre Gram-
fort, Vincent Michel, Bertrand Thirion, Olivier
Grisel, Mathieu Blondel, Peter Prettenhofer, Ron
Weiss, Vincent Dubourg, et al. 2011. Scikit-learn:
Machine learning in python. Journal of machine
learning research, 12(Oct):2825–2830.
Andrew Perrin. 2015. Social media usage: 2005-2015.
Antonio Reyes, Paolo Rosso, and Davide Buscaldi.
2009. Humor in the blogosphere: First clues for a
verbal humor taxonomy. Journal of Intelligent Sys-
tems, 18(4):311–332.
Antonio Reyes, Paolo Rosso, and Tony Veale. 2013.
A multidimensional approach for detecting irony
in twitter. Language resources and evaluation,
47(1):239–268.
Sara Rosenthal, Noura Farra, and Preslav Nakov.
2017. Semeval-2017 task 4: Sentiment analysis in
twitter. In Proceedings of the 11th International
Workshop on Semantic Evaluation (SemEval-2017),
pages 502–518.
Luı́s Sarmento, Paula Carvalho, Mário J Silva, and
Eugénio De Oliveira. 2009. Automatic creation of a
reference corpus for political opinion mining in user-
generated content. In Proceedings of the 1st interna-
tional CIKM workshop on Topic-sentiment analysis
for mass opinion, pages 29–36. ACM.
Twitter Usage Statistics. 2014. Internet live stats.
586You can also read