A 2-decade (1988-2009) record of diatom fluxes in the Mauritanian coastal upwelling: impact of low-frequency forcing and a two-step shift in the ...
←
→
Page content transcription
If your browser does not render page correctly, please read the page content below
Biogeosciences, 18, 1873–1891, 2021
https://doi.org/10.5194/bg-18-1873-2021
© Author(s) 2021. This work is distributed under
the Creative Commons Attribution 4.0 License.

A 2-decade (1988–2009) record of diatom fluxes in the
Mauritanian coastal upwelling: impact of low-frequency
forcing and a two-step shift in the species composition
Oscar E. Romero1,2 , Simon Ramondenc1,2 , and Gerhard Fischer1,3
1 MARUM     – Center for Marine Environmental Sciences, University of Bremen, Leobener Str. 8, Bremen 28359, Germany
2 AlfredWegener Institute, Helmholtz Centre for Polar and Marine Research,
Am Alten Hafen 26, Bremerhaven 27568, Germany
3 University of Bremen, Geosciences Department, Klagenfurter Str., Bremen 28359, Germany

Correspondence: Oscar E. Romero (oromero@marum.de)

Received: 9 September 2020 – Discussion started: 13 October 2020
Revised: 13 February 2021 – Accepted: 16 February 2021 – Published: 18 March 2021

Abstract. Eastern boundary upwelling ecosystems (EBUEs)         of AMO and the associated changes of the Atlantic Merid-
are among the most productive marine regions in the world’s     ional Overturning Circulation. Transported valves (siliceous
oceans. Understanding the degree of interannual to decadal      remains) from shallow Mauritanian coastal waters into the
variability in the Mauritania upwelling system is crucial       bathypelagic should be considered for the calculation and
for the prediction of future changes of primary productiv-      model experiments of bathy- and pelagic nutrients budgets
ity and carbon sequestration in the Canary Current EBUE         (especially Si), the burial of diatoms, and the paleoenviron-
as well as in similar environments. A multiyear sediment        mental signal preserved in downcore sediments. Addition-
trap experiment was conducted at the mooring site CBmeso        ally, our 1988–2009 data set contributes to the characteriza-
(“Cape Blanc mesotrophic”, ca. 20◦ N, ca. 20◦ 400 W) in         tion of the impact of low-frequency climate forcings in the
the highly productive coastal waters off Mauritania. Here,      northeastern Atlantic and will be especially helpful for es-
we present results on fluxes of diatoms and the species-        tablishing the scientific basis for forecasting and modeling
specific composition of the assemblage for the time inter-      future states of the Canary Current EBUE and its decadal
val between March 1988 and June 2009. The temporal dy-          changes.
namics of diatom populations allows the proposal of three
main intervals: (i) early 1988–late 1996, (ii) 1997–1999, and
(iii) early 2002–mid 2009. The Atlantic Multidecadal Oscil-
lation (AMO) appears to be an important driver of the long-     1   Introduction
term dynamics of diatom population. The long-term AMO-
driven trend is interrupted by the occurrence of the strong     As part of the latitudinally extended eastern boundary up-
1997 El Niño–Southern Oscillation (ENSO). The extraor-          welling ecosystem (EBUE) of the Canary Current (CC) in the
dinary shift in the relative abundance of benthic diatoms       subtropical northeastern Atlantic, the Mauritanian upwelling
in May 2002 suggests the strengthening of offshore advec-       is characterized by intense offshore Ekman transport and
tive transport within the uppermost layer of filament waters    strong mesoscale heterogeneity. This physical setting facil-
and in the subsurface and in deeper and bottom-near lay-        itates the vigorous exchange between the neritic and pelagic
ers. It is hypothesized that the dominance of benthic diatoms   realms off Mauritania (Chavez and Messié, 2009; Freón
was the response of the diatom community to the intensifi-      et al., 2009; Cropper et al., 2014). The nutrient trapping ef-
cation of the slope and shelf poleward undercurrents. This      ficiency of upwelling cells (Arístegui et al., 2009), the input
dominance followed the intensification of the warm phase        of wind-carried dust particles from the Sahara and the Sahel
                                                                (Romero et al., 1999b, 2003; Friese et al., 2017; Fischer et al.,

Published by Copernicus Publications on behalf of the European Geosciences Union.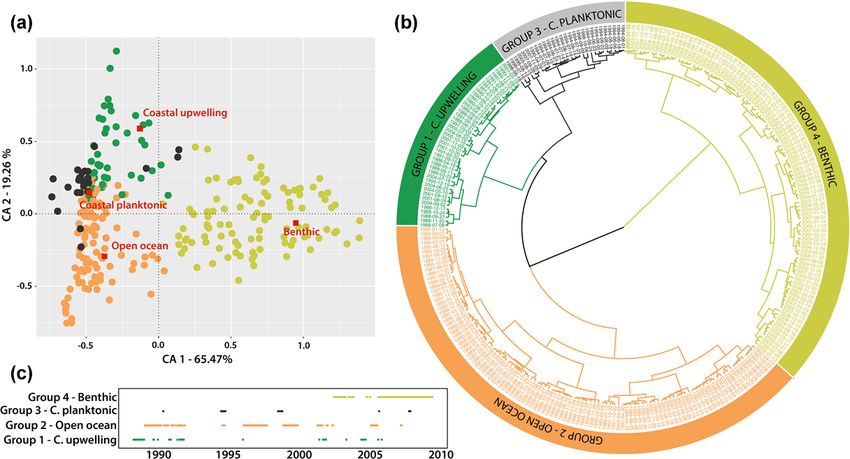
1874          O. E. Romero et al.: A 2-decade (1988–2009) record of diatom fluxes in the Mauritanian coastal upwelling

2016, 2019), and/or the wide shelf (Hagen, 2001; Cropper            CB, Fig. 1; Fischer et al., 1996). Several earlier studies ad-
et al., 2014) additionally impact the intensity of the primary      dressed either the variations in marine diatom fluxes between
production in surface waters and the subsequent export of           March 1988 and November 1991 (Romero et al., 1999a,
microorganism remains into the meso- and bathypelagic off           2002; Romero and Armand, 2010; Lange et al., 1998) or
Mauritania. This set of conditions varies strongly on differ-       the land-derived signal of siliceous remains (Romero et al.,
ent temporal patterns (from seasonal through decadal; Mit-          1999b, 2003). After a gap of 2.5 years (December 1991
telstaedt, 1983, 1991; Hagen, 2001; Nykjær and Van Camp,            through May 1994), the CBmeso trap experiment re-started
1994; Barton et al., 2013; Varela et al., 2015). Whether the        in June 1994 (Table 1). Here, we extend the diatom record
strong interannual and decadal variability of physical condi-       collected from early June 1994 until middle June 2009. The
tions off Mauritania is related to low-frequency, global-scale      main goal of this study is the description of the multiyear dy-
climatic variations or to an intrinsic level of basin-wide at-      namics of the total diatom flux and the shifts in the species-
mospheric and/or oceanic variability is still a matter of de-       specific composition of the assemblage at the site CBmeso
bate (Cropper et al., 2014; Varela et al., 2015; Fischer et al.,    during almost 20 years (1988–2009). Our study presents the
2016, 2019).                                                        longest sediment-trap-based time series on the temporal dy-
   EBUEs may prove more resilient to ongoing climate                namics of diatom fluxes in the world ocean. We discuss the
change than other ocean ecosystems because of their abil-           new results in view of the high frequency of climate indices,
ity to function under extremely variable conditions (Barton         which are proxies for atmospheric and hydrographic dynam-
et al., 2013; Varela et al., 2015). On the other hand, it is pre-   ics along the CC EBUE, and low-frequency climate variabil-
dicted that current global warming will impact atmospheric          ity in the North Atlantic, and we compare our new data set
pressure gradients and hence the strength of coastal winds          at the site CBmeso with previous diatom (Romero and Fis-
that cause upwelling (Bakun, 1990; Bakun et al., 2010). Al-         cher, 2017; Lange et al., 1998; Romero et al., 1999a, b, 2002,
though productivity variations in EBUEs are sensitive to the        2020) and bulk flux results off Mauritania (Helmke et al.,
amplitude and timing of upwelling-favorable winds (Varela           2005; Fischer et al., 2016, 2019). We also discuss our new
et al., 2015), the impact of ongoing ocean warming on the           results with recent results from the nearby coastal site CBeu
dynamics of upwelling-favorable winds is still contentious          (Cape Blanc eutrophic) (Romero and Fischer, 2017; Romero
(Bakun, 1990; Bakun et al., 2010; Varela et al., 2015). Long-       et al., 2020).
term trends in variations in upwelling intensity and related
productivity changes seem highly dependent on the length of
the data series, the selected study area, the season evaluated,     2     Material and methods
and the methods applied (Varela et al., 2015). The descrip-
tion of multiyear to interdecadal trends of upwelling inten-        2.1    Mooring location, sampling intervals, and sample
sity in the CC EBUE has been mostly based on variations                    treatment
in velocity and direction of winds and calculated upwelling
intensities. Cropper et al. (2014) found a non-significant in-      A total of 20 moorings were deployed off Mauritania (Fig. 1)
crease in upwelling-favorable winds along the CC EBUE be-           between March 1988 and June 2009. Details on sampling in-
tween 11 and 35◦ N. Using the same database as Cropper              tervals and trap depths are given in Table 1. Major gaps in the
et al. (2014), Narayan et al. (2010) and Patti et al. (2010) an-    diatom record are between (i) December 1991 and June 1994
alyzed the annual wind stress over 4 decades and found sig-         (no traps deployed), (ii) October 1994 and November 1995
nificant increasing trends across 24–32◦ N. Contradictory re-       (malfunctioning of the trap CBmeso6 upper), (iii) October
sults were also obtained using Ekman transport data. Gómez-         1997 and June 1998 (malfunctioning of the trap CBmeso8
Gesteira et al. (2008) detected a significant decreasing trend      upper), and November 1999 and March 2001 (malfunction-
in upwelling intensity across 20–32◦ N for all seasons be-          ing of traps CBmeso10 and 11 lower) (Table 1). The entire
tween 1967 and 2006, while Pardo et al. (2011) found a gen-         study interval extended over 7734 d between March 1988 and
eral weakening of upwelling intensity between 10 and 24◦ N          June 2009. During this interval, samples were collected for
for the time interval 1970–2009. Barton et al. (2013) found         5574 d. The gaps that occurred total 2160 d of the entire trap
no statistically significant change of the annual mean wind         experiment.
intensity off northwest Africa over the second half of the             We used deep-moored (> 700 m water depth), large-
20th century.                                                       aperture time-series sediment traps of the Kiel and Honjo
   A different approach for the characterization of multiyear       types with 20 cups and 0.5 m2 openings, equipped with
to interdecadal trends in EBUEs is assessing fluxes of par-         a honeycomb baffle (Kremling et al., 1996). As the traps
ticulates and microorganisms as captured by continuous sed-         were moored below intermediate water masses (CB1lower:
iment trap experiments. This study builds on earlier investi-       2195 m; CB2–5, 7, 9–12, 15–20lower: 3502–3633 m; and
gations of multiyear variability of the diatom flux captured        CB6, 8 and 14upper: 745–1246 m, Table 1), uncertainties
with sediment traps deployed at the mesotrophic mooring             with the trapping efficiency due to strong currents (e.g., un-
site CBmeso (Cape Blanc mesotrophic, formerly known as              dersampling) and/or due to the migration and activity of zoo-

Biogeosciences, 18, 1873–1891, 2021                                                   https://doi.org/10.5194/bg-18-1873-2021
O. E. Romero et al.: A 2-decade (1988–2009) record of diatom fluxes in the Mauritanian coastal upwelling                                         1875

Figure 1. (a) Map of the study area showing the locations of the sediment trap sites CBmeso and CBeu (dark blue dots). Major surface
currents are also shown (Canary Current: CC; Mauritanian Current: MC; North Equatorial Current: NEC; north Cabo Verde Current: nCVC).
The upwelling zones along the northwestern African margin are depicted after Cropper et al. (2014). The color scale (right-hand side) refers
to meters below surface water (0 m). (b–d) Satellite-gained images of average winter concentration of chlorophyll a in surface waters along
the northwestern African margin. The images depict chlorophyll a values in winters 1997, 2002, and 2008, gained with SeaWIFs (b, 1997)
and MODIS (c and d, 2002 and 2008; https://oceancolor.gsfc.nasa.gov/cgi/l3, last access: 31 July 2020). Note the high interannual variability
of chl a concentration. For interpretation of the references to color in this figure legend, the reader is referred to the web version of this article.

plankton migrators (“swimmer problem”) are assumed to be                      2.2    Assessment of diatom fluxes and species
minimal (Buesseler et al., 2007). Prior to the deployments,                          identification
the sampling cups were poisoned with HgCl2 (1 mL of conc.
HgCl2 per 100 mL of filtered seawater), and pure NaCl was                     The 1/64 and 1/125 splits of the original samples were
used to increase the density in the sampling cups to 40 ‰.                    used. Samples were rinsed with distilled water and prepared
Upon recovery, samples were stored at 4 ◦ C on board and                      for diatom studies following standard methods (Schrader
wet-split in the home laboratory (MARUM, University of                        and Gersonde, 1978). For this study, a total of 282 sedi-
Bremen) using a rotating McLane splitter system. Larger                       ment trap samples were processed. Each sample was chem-
swimmers – such as crustaceans – were handpicked at the                       ically treated with potassium permanganate, hydrogen per-
home lab by using forceps and were removed by filtering the                   oxide (33 %), and concentrated hydrochloric acid (32 %) fol-
sample carefully through a 1 mm sieve. All flux data here                     lowing previously used methodology (Romero and Fischer,
refer to the size fraction < 1 mm. In almost all samples, the                 2017; Romero et al., 1999a, b, 2002, 2009a, b, 2020). Qual-
fraction of particles > 1 mm was negligible (larger pteropods                 itative and quantitative analyses of the diatom community
were found only in a few samples; Fischer et al., 2016).                      were carried out on permanent slides of acid-cleaned ma-
   We compare our data with those previously published at                     terial (Mountex® mounting medium) at ×1000 magnifica-
the mooring location CBeu (ca. 20◦ 450 N, 18◦ 450 W), also                    tion by using a Zeiss® Axioscope with phase-contrast illu-
deployed off Mauritania (Romero and Fischer, 2017; Romero                     mination (MARUM, University of Bremen). Depending on
et al., 2020). It locates ca. 80 nautical miles (∼ 150 km) off-               valve abundances in each sample, several traverses across
shore over the continental slope in ca. 2750 m water depth.                   each slide were examined. The counting procedure and defi-
For site CBeu, only the upper trap fluxes are shown (Romero                   nition of counting units for valves follow Schrader and Ger-
and Fischer, 2017; Fischer et al., 2019; Romero et al., 2020).                sonde (1978). The total number of counted valves per slide
                                                                              ranged between ca. 400 and 1000. Two cover slips per sam-
                                                                              ple were scanned in this way. Counts of valves in replicate

https://doi.org/10.5194/bg-18-1873-2021                                                                  Biogeosciences, 18, 1873–1891, 2021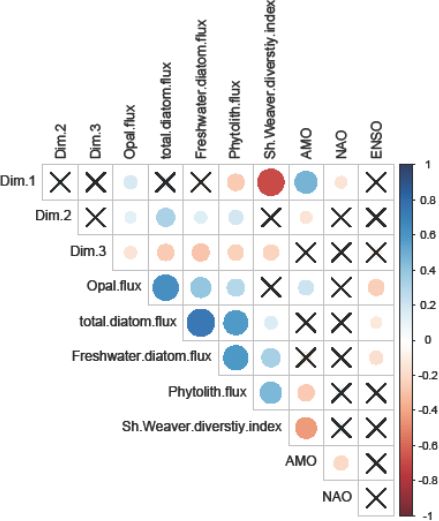
1876              O. E. Romero et al.: A 2-decade (1988–2009) record of diatom fluxes in the Mauritanian coastal upwelling

Table 1. Data deployment at the site CBmeso (Cape Blanc mesotrophic): trap name, coordinates (latitude and longitude), ocean bottom
depth, trap depth, sampling interval, and sample amount.

   Trap name                      Lat           Long         Bottom       Trap               Sampling              No. of   Diatom data
                                                              depth      depth                                   samples    previously published by
                                   N             W             m            m     start            end
   CBmeso1 lower              20◦ 45.30      19◦ 44.50        3646       2195     22 Mar 1988      8 Mar 1989         13    Lange et al. (1998),
                                                                                                                            Romero et al. (2002)
   CBmeso2 lower              21◦ 08.70      20◦ 41.20        4092       3502     15 Mar 1989      24 Mar 1990        22    Romero et al. (2002)
   CBmeso3 lower              21◦ 08.30      20◦ 40.30        4094       3557     29 Apr 1990      8 Apr 1991         17    Romero et al. (2002)
   CBmeso4 lower              21◦ 08.70      20◦ 41.20        4108       3562     3 Mar 1991       19 Nov 1991        13    Romero et al. (2002)
   CBmeso5 lower              21◦ 08.60      20◦ 40.90        4119       3587     6 Jun 1994       27 Aug 1994        19
   CBmeso6 upper∗             21◦ 15.00      20◦ 41.80        4137        771     2 Sep 1994       16 Oct 1994         2
   CBmeso7 lower              21◦ 15.40      20◦ 41.80        4152       3586     20 Nov 1995      29 Jan 1997        20
   CBmeso8 upper∗             21◦ 16.30      20◦ 41.50        4120        745     30 Jan 1997      4 Jun 1998          8
   CBmeso9 lower              21◦ 15.20      20◦ 42.40        4121       3580     11 Jun 1998      7 Nov 1999         20
   CBmeso12 lower∗            21◦ 16.00      20◦ 46.50        4145       3610     5 Apr 2001       17 Dec 2001        14
   CBmeso13 lower             21◦ 16.80      20◦ 46.70        4131       3606     23 Apr 2002      8 May 2003         20
   CBmeso14 upper             21◦ 17.20      20◦ 47.60        4162       1246     31 May 2003      2 Nov 2003         10
   CBmeso15 lower             21◦ 17.90      20◦ 47.80        4162       3624     17 Apr 2004      21 Jul 2005        20
   CBmeso16 lower             21◦ 16.80      20◦ 47.80        4160       3633     25 Jul 2005      28 Sep 2006        20
   CBmeso17 lower             21◦ 16.40      20◦ 48.20        4152       3614     24 Oct 2006      25 Mar 2007        20
   CBmeso18 lower             21◦ 16.90      20◦ 48.10        4168       3629     25 Mar 2007      5 Apr 2008         20
   CBmeso19 lower             21◦ 16.20      20◦ 48.70        4155       3617     22 Apr 2008      22 Mar 2009        20
   CBmeso20 lower∗            21◦ 15.60      20◦ 50.70        4170       3620     3 Apr 2009       12 Jun 2009         4
 ∗ Traps with malfunctioning, having caused gaps in the diatom record.

slides indicate that the analytical error of valve concentration                      ated using Ward’s aggregation link (Legendre and Legendre,
estimates is ≤ 10 %.                                                                  2012). This approach has been computed by using the vegan
   The resulting counts yielded abundance of individual di-                           package included in the R software. In addition, Kruskal–
atom taxa as well as daily fluxes of valves m−2 d−1 (DF), cal-                        Wallis tests, coupled with multiple comparison tests (pair-
culated according to Sancetta and Calvert (1988), as follows:                         wise Wilcoxon rank sum test), have been performed on cli-
                                                                                      matic indexes and total diatom flux according to sample
        [N] × [A/a] × [V ] × [Split]
DF =                                 ,                                      (1)       groups highlighted by the clustering analysis with the aim
               [days] × [D]                                                           of identifying relationships between environmental forcing
where [N] is number of valves in a known area [a] as a frac-                          indices and diatom communities.
tion of the total area of a petri dish [A] and the dilution vol-
ume [V ] in milliliters. This value is multiplied by the sample
split [Split], representing the fraction of total material in the                     3     Physical setting of the study area
trap, and then divided by the number of [days] of sample de-
ployment and the sediment trap collection area [D].                                   3.1    Oceanography, winds, and upwelling dynamics

2.3    Statistical analysis                                                           The CC EBUE is in the eastern part of the North Atlantic
                                                                                      subtropical gyre (Fig. 1, Chavez and Messié, 2009; Arístegui
Correspondence analysis (CA) was used to explore diatom                               et al., 2009; Cropper et al., 2014). Both the temporal oc-
communities’ changes. CA is an ordination technique that                              currence and the intensity of the upwelling along north-
enables description of the community structure from mul-                              western Africa depend on the shelf width, seafloor topog-
tivariate contingency tables with frequency-like data (i.e.,                          raphy, wind direction and strength (Mittelstaedt, 1983; Ha-
abundances derived from counting with integers and zeros)                             gen, 2001), Ekman-mediated transport, and mesoscale het-
that are dimensionally homogeneous (Legendre and Legen-                               erogeneity (Chavez and Messié, 2009; Fréon et al., 2009;
dre, 2012). Based on the CA samples’ scores, a hierarchi-                             Cropper et al., 2014). The Mauritanian shelf is wider than the
cal clustering analysis was performed to classify the sam-                            shelf northward and southward along the CC EBUE and gen-
ples’ date according to the diatom composition similari-                              tly slopes from the coastline into water depths below 200 m
ties. Euclidean distance was used to compute the distance                             (Hagen, 2001). The shelf break zone with its steep continen-
matrix from which a hierarchical dendrogram was gener-                                tal slope extends over approximately 100 km from the coast-

Biogeosciences, 18, 1873–1891, 2021                                                                      https://doi.org/10.5194/bg-18-1873-2021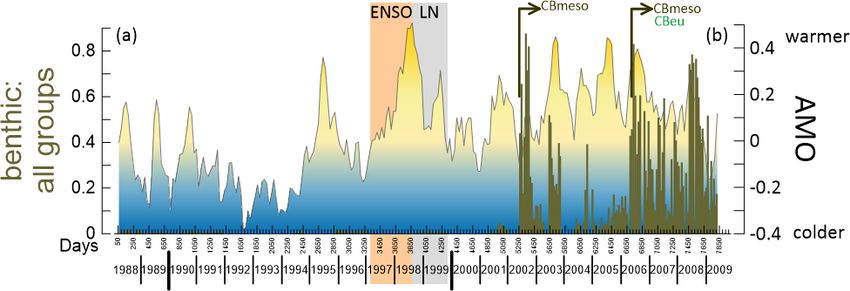
O. E. Romero et al.: A 2-decade (1988–2009) record of diatom fluxes in the Mauritanian coastal upwelling                     1877

line (Hagen, 2001). Because of the coastal topography, shelf          The SACW occurs in layers between 100 and 400 m depth
and slope bathymetry, ocean currents, and wind system, sur-        around the Banc d’Arguin and off Mauritania. The hydro-
face waters off Mauritania are characterized by almost per-        graphic properties of upwelled waters over the shelf sug-
manent upwelling with varying intensity year-round (Lath-          gest that they ascend from depths between 100 and 200 m
uilière et al., 2008; Cropper et al., 2014). The site CBmeso lo-   south off the Banc d’Arguin (Mittelstaedt, 1983). North of
cates at the westward end of this permanent upwelling zone.        the Banc d’Arguin, the SACW merges gradually into deeper
   The surface hydrography off Mauritania is influenced by         layers (200–400 m) below the CC (Mittelstaedt, 1983). The
two major surface currents: the southwestward-flowing CC           biological response is accelerated in upwelled waters when
and the poleward-flowing coastal countercurrent or Maurita-        the SACW of the upper part of the undercurrent feeds the
nia Current (MC) (Fig. 1). The surficial CC detaches from the      onshore transport of intermediate layers to form mixed-water
northern African continental slope between 25 and 21◦ N and        types on the shelf (Zenk et al., 1991).
supplies Si-poor waters to the North Equatorial Current. CC
waters are relatively cool because it entrains upwelled water      3.2     Large-scale, low-frequency climate and
from the coast as it moves southward (Mittelstaedt, 1991).                 oceanographic modes potentially affecting the
The Si-rich MC gradually flows northward along the coast                   Mauritanian upwelling area
up to about 20◦ N (Mittelstaedt, 1991) and brings warmer
surface waters from the equatorial realm into waters overly-       3.2.1    Atlantic Multidecadal Oscillation (AMO)
ing the site CBmeso. Towards late autumn, the MC is gradu-
                                                                   The AMO is the average of sea surface temperatures (SSTs)
ally replaced by a southward flow associated with upwelling
                                                                   of the North Atlantic Ocean (from 0 to 60◦ N, 80◦ W to
water due to the increasing influence of trade winds south of
                                                                   0◦ ), detrended to isolate the natural variability (Endfield
20◦ N (Zenk et al., 1991) and becomes a narrow strip of less
                                                                   et al., 2001). It is an ongoing series of multidecadal cyclic-
than 100 km wide in winter (Mittelstaedt, 1983). The MC
                                                                   ity, with cool and warm phases that might last between 20
advances onto the shelf in summer and is enhanced by the
                                                                   and 40 years with a difference of about 15 ◦ C between ex-
relatively strong Equatorial Countercurrent and the southerly
                                                                   tremes. These changes are natural and have been occurring
trade winds (Mittelstaedt, 1983).
                                                                   for at least the last 1000 years. Since AMO is linked to
   North of Cape Blanc (ca. 21◦ N; Fig. 1), the intense north-
                                                                   SST variations, it also plays a significant role in the decadal
easterly winds cause coastal upwelling to move further off-
                                                                   forcing of productivity changes (O’Reilly et al., 2016). Fis-
shore and the upper slope fills with upwelled waters. South
                                                                   cher et al. (2016) state that the correlation of sea level pres-
of Cape Blanc, northerly winds dominate year-round, but
                                                                   sure with area-averaged (0–70◦ N, 60–10◦ W) SST fluctua-
surface waters remain stratified, and the coastal Poleward
                                                                   tions over periods longer than 10 years highlights a center
Undercurrent (PUC) occurs as a subsurface current (Pelegrí
                                                                   of action in the tropical Atlantic with sea level pressure re-
et al., 2017). South of Cape Timiris (ca. 19◦ 300 N), the PUC
                                                                   ductions (weaker northeasterly winds) along with higher At-
intensifies during summer–fall and remains at the subsur-
                                                                   lantic Basin-wide sea level pressure during a positive AMO
face during winter–spring (Pelegrí et al., 2017). The conver-
                                                                   phase. This shows the importance of longer-term, Atlantic
gence of the northward-flowing MC–PUC system with the
                                                                   basin-scale SST variations for alongshore winds and up-
southward-flowing currents builds the Cabo Verde Frontal
                                                                   welling trends at the site CBmeso.
Zone (Zenk et al., 1991; Fig. 1), and the large offshore water
                                                                      Despite the indirect role of the atmosphere, the physi-
export is visible as the giant Mauritanian chlorophyll fila-
                                                                   cal connection between the Atlantic Meridional Overturning
ment (Gabric et al., 1993; Pelegrí et al., 2006, 2017).
                                                                   Circulation (AMOC) and the AMO is typically described in
   The chlorophyll filament extends offshore up to 400 km
                                                                   terms of oceanic processes alone: since the AMOC transports
(e.g., Arístegui et al., 2009; Cropper et al., 2014; Van Camp
                                                                   heat northward over the entire Atlantic, an increase in North
et al., 1991; Fig. 1b–d), carrying a mixture of North and
                                                                   Atlantic Deep Water (NADW) formation should increase the
South Atlantic Central Water (NACW and SACW, respec-
                                                                   strength of the AMOC, thus increasing oceanic meridional
tively) through an intense offshore jet-like flow (Meunier
                                                                   heat transport convergence in the North Atlantic, resulting in
et al., 2012). Intense offshore transport acts as an impor-
                                                                   a basin-scale warming of SSTs (Knight et al., 2005). AMOC
tant mechanism for the export of cool, nutrient-rich shelf and
                                                                   variability itself is often attributed to changes in NADW for-
upper-slope waters. It has been estimated that this giant fil-
                                                                   mation due to anomalous Arctic freshwater fluxes (Jungclaus
ament exports about 50 % of the coastal new production to-
                                                                   et al., 2005) and/or atmospheric modes such as the North At-
ward the open ocean during intervals of the most intense up-
                                                                   lantic Oscillation (NAO; e.g., Buckley and Marshall, 2016).
welling (Gabric et al., 1993; Lange et al., 1998; Van Camp
                                                                   In contrast, Clement et al. (2015) found that the pattern of
et al., 1991; Helmke et al., 2005). This transport impacts even
                                                                   AMO variability can be reproduced in a model that does
more distant regions in the deep ocean, since sinking parti-
                                                                   not include ocean circulation changes but only the effects of
cles are strongly advected by lateral transport in subsurface
                                                                   changes in air temperature and winds.
and deeper waters (Fischer and Karakaş, 2009; Karakaş et al.,
2006; Fischer et al., 2009).

https://doi.org/10.5194/bg-18-1873-2021                                                   Biogeosciences, 18, 1873–1891, 2021
1878 O. E. Romero et al.: A 2-decade (1988–2009) record of diatom fluxes in the Mauritanian coastal upwelling
3.2.2 El Niño–Southern Oscillation (ENSO) and Table 2. Estimates of annual total diatom fluxes. Values were cal-
La Niña culated for those calendar years with at least 300 d yr−1 of trap col-
lection.
ENSO is an irregularly periodic variation in winds and SST
over the tropical eastern Pacific Ocean that affects the cli- Year Interval Number Annual total
of days diatom flux
mate of much of the tropics and subtropics of other ocean
(n) (valves per square meter
basins via teleconnections. The warming phase is known as
per year)
El Niño and the cooling phase as La Niña. The Southern Os-
cillation is the accompanying atmospheric component, cou- 1988 22 Mar–31 Dec 303 375 396 364
pled with the SST variations. ENSO-related teleconnections 1989 1 Jan–31 Dec 365 213 264 682
in the CC EBUE upwelling system have been described by 1990 1 Jan–31 Dec 365 209 400 523
1991 1 Jan–31 Dec 365 137 419 778
several authors (Behrenfeld et al., 2001; Pradhan et al., 2006;
1996 1 Jan–31 Dec 365 91 909 532
Zeeberg et al., 2008) and can be illustrated by the negative
1997 1 Jan–28 Oct 300 26 149 573
correlation of sea level pressure with eastern tropical Pacific 2001 4 Mar–31 Dec 302 45 141 069
SST. 2002 23 Apr–31 Dec 252 55 852 514
The relationship between ENSO and other low-frequency 2003 1 Jan–2 Nov 305 214 578 146
forcings is still uncertain. It has been hypothesized that 2005 1 Jan–31 Dec 365 260 635 121
AMO could influence ENSO on multidecadal timescales 2006 1 Jan–31 Dec 365 75 713 333
(Dong et al., 2006); however, due to the comparatively low 2007 1 Jan–31 Dec 365 108 216 786
record of observations, the relationship between ENSO and 2008 1 Jan–31 Dec 366 183 759 846
other modes of multidecadal variability could just be ran-
dom (e.g., Wittenberg, 2009; Stevenson et al., 2012). Levine
et al. (2017) observed that AMO modifies the thermocline
effects on wind fields in the CC EBUEs and consequently on
in the tropical Pacific, which, in turn, affects ENSO vari-
upwelling, with potential implications for the magnitude of
ance. Zhang et al. (2019) found that the negative ENSO–
deep-ocean mass fluxes (Fischer et al., 2016).
NAO correlation in late boreal winter is significant only when
ENSO and AMO are in phase, while no significant ENSO-
driven atmospheric anomalies are observed over the North
Atlantic when ENSO and the AMO are out of phase. ENSO 4 Results
exhibits a considerable degree of diversity in its pattern of
SST anomalies, which also complicates its connection with 4.1 Total diatom fluxes
NAO. All these factors may increase the uncertainty of the
ENSO–NAO relationship (Zhang et al. (2019) and references Marine diatoms are the main contributors to the siliceous
therein). fraction in samples collected with the CBmeso traps between
March 1988 and June 2009. Silicoflagellates and radiolarians
3.2.3 North Atlantic Oscillation are secondary components of the siliceous fraction (data not
shown here), with a minor contribution of land-derived fresh-
The NAO characterizes the difference of atmospheric sea water diatoms and phytoliths. In terms of number of individ-
level pressure between the Icelandic Low and the Azores uals, the total diatom flux was always 1 order to 4 orders of
High (Hurrell, 1995). These fluctuations control the strength magnitude higher than that of the other siliceous organisms.
and direction of westerly winds and location of storm tracks The total diatom flux ranged from 2.7 × 10³ to 3.3 ×
across the North Atlantic. A positive phase of the NAO is as- 106 valves per square meter per day (average = 4.0 ×
sociated with anomalous high pressure in the Azores High re- 105 valves±4.4×10⁵ ) and shows strong interannual variabil-
gion and stronger northeasterly winds along the NW African ity (Fig. 2, Table 2). The highest fluxes (> 1.0 × 10⁶ valves
coast. Especially from November through April, the NAO is per square meter per day) occurred in 1988, late 1989, early
responsible for much of the weather variability in the North 2002, 2003, late 2004, early 2005, early 2007, and early
Atlantic region, affecting wind speed and wind direction 2008. The lowest total diatom flux was recorded between
changes, changes in temperature and moisture distribution, 1997 and 1999 (range = 2.3 × 10³ –5.1 × 10⁴ ).
and the intensity, number, and track of storms. Maxima of total diatom flux are defined here as those val-
As for ENSO, links between NAO and other low- ues that are higher than the total diatom flux average ±1
frequency forcings remain debatable. Yamamoto and Pal- standard deviation (SD) for the entire study period. Fluxes
ter (2016) show that some relation exists between NAO and in spring and summer show the highest number of above-
AMO, with northerly winds associated with a positive state the-average values. Although the same number of total di-
of AMO and zonal winds to a negative state of AMO. Winter atom flux maxima is recorded in fall as in summer and spring
correlations show that NAO and ENSO may have opposite (n = 17), the absolute values of fall maxima were predomi-
Biogeosciences, 18, 1873–1891, 2021 https://doi.org/10.5194/bg-18-1873-2021O. E. Romero et al.: A 2-decade (1988–2009) record of diatom fluxes in the Mauritanian coastal upwelling 1879
Figure 2. Total diatom flux (valves per square meter per day) and relative contribution of diatom groups (relative contribution, %) for
the interval from March 1998 to June 2009 at the CBmeso site. Groups of diatoms are benthic (light green), coastal planktonic (black),
coastal upwelling (dark green), and open ocean (orange). For the species-specific composition of each group, see Sect. 4.2. and Table 2. For
interpretation of the references to color in this figure legend, the reader is referred to the web version of this article.
nantly lower than those of spring and summer. Winter has the 1. The benthic group is dominated by Delphineis surirella.
lowest number of total diatom flux maxima (n = 12). As part of the epipsammic community, D. surirella is
Estimates of annual diatom fluxes were calculated for cal- a benthic marine species that commonly thrives in the
endar years with at least 250 d yr−1 of flux collections. Data shallow euphotic zone of sandy shores and shelf and
are presented in Table 2. Values range between 3.8 × 10⁸ uppermost-slope waters along temperate to cool seas,
and 2.6 × 10⁷ valves per square meter per year (1 SD = forming either short or long chains of small valves
1.0 × 10⁸ valves per square meter per year; average = 1.5 × (length = 5–15 µm) (Andrews, 1981).
108 valves per square meter per year). Values above the aver-
2. The coastal upwelling group is composed of several
age occurred in 1988–1990, 2003, 2005, and 2008. The low-
species of Chaetoceros resting spores (RSs) and the
est value was recorded in 1997 (Table 2).
vegetative cells of Thalassionema nitzschioides var.
4.2 Temporal variations in marine diatom populations nitzschioides. Both taxa are common components of
the coastal and hemipelagic upwelling assemblages in
A total of 203 diatom species were identified in CBmeso EBUEs (Romero and Armand, 2010; Nave et al., 2001;
samples between March 1988 and June 2009. To better un- Abrantes et al., 2002; Romero et al., 2002). Vegetative
derstand the temporal variations in the diverse community, cells of numerous Chaetoceros species (mainly those
we follow the same grouping approach as already applied assigned to the section Hyalochaete; Rines and Har-
in the nearby trap site CBeu (Romero and Fischer, 2017; graves, 1988) rapidly respond to the weakening of up-
Romero et al., 2020). Out of 203 taxa, 109 species (whose welling intensity and nutrient depletion by forming en-
average relative contribution is ≥ 0.50 % for the entire stud- dogenous resting spores; hence their high numbers in
ied interval) were distributed in four groups, according to trap samples are interpreted to represent the strongest
the main ecological and/or habitat conditions they represent: upwelling intensity (Romero and Armand, 2010; Nave
(1) benthic, (2) coastal upwelling, (3) coastal planktonic, and et al., 2001; Abrantes et al., 2002; Romero et al., 2002).
(4) open-ocean diatoms. Taxa assigned to each group are 3. Coastal planktonic species mostly thrive in neritic to
listed in Table 3 and described below. hemipelagic and oligo- to mesotrophic waters with
moderate levels of dissolved silica (DSi). These species
https://doi.org/10.5194/bg-18-1873-2021 Biogeosciences, 18, 1873–1891, 20211880 O. E. Romero et al.: A 2-decade (1988–2009) record of diatom fluxes in the Mauritanian coastal upwelling
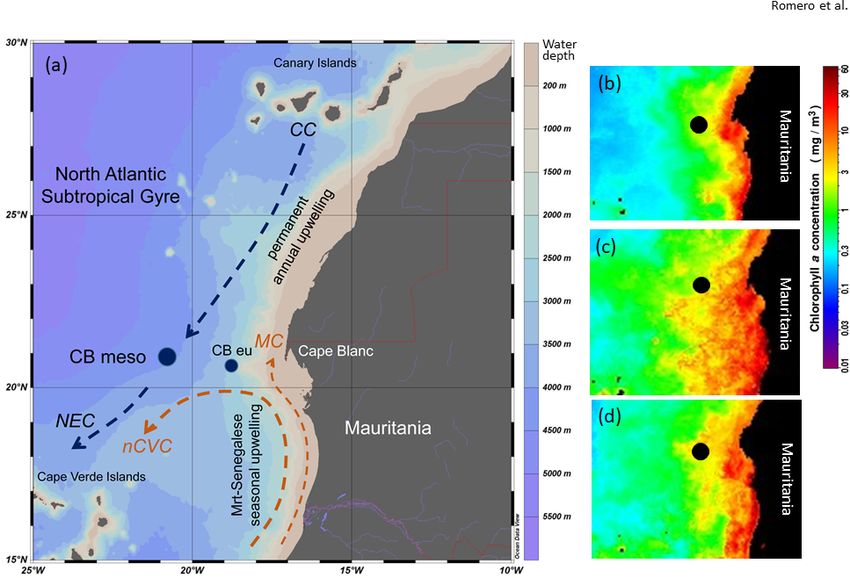
Figure 3. (a) Correspondence analysis (CA) of diatom groups found at the CBmeso site between March 1988 and June 2009, coupled
with (b) a hierarchical clustering analysis of samples’ score resulting from CA (see Sect. 2.3). Note that in (a) the red squares for each
group represent the centroid of dates and their placement within the corresponding group. The corresponding group’s name is written in
red. (c) The time series of the four diatom groups identified by both multivariate analyses (CA and clustering) is also represented. Colors
used for identifying each diatom group are the same as in Fig. 2b. Euclidean distance and Ward’s aggregation link were used to perform the
hierarchical dendrogram. For the species-specific composition of each group, see Sect. 4.2. and Table 2. For interpretation of the references
to color in this figure legend, the reader is referred to the web version of this article.
become more abundant during intervals of decreased terannual variability, with significant shifts within the diatom
mixing, when upwelling weakens (Romero and Ar- community between 1988 and 2009. The first CA component
mand, 2010; Romero and Fischer, 2017; Romero et al., covers 65.47 % of the total variance and opposes the sam-
2009a, b, 2020; Crosta et al., 2012). The well-silicified ples dominated by benthic and coastal planktonic diatoms
species Actinocyclus curvatulus, Cyclotella litoralis, (Fig. 3a). The second CA axis explains 19.16 % of the to-
Coscinodiscus radiatus, and Shionodiscus oestrupii var. tal variance and discriminate coastal upwelling and open-
venrickae are the main contributors at the CBmeso site. ocean diatoms. The clustering analysis allows the samples
to be statistically grouped, and the complete time series was
4. Open-ocean taxa thrive in pelagic, oligotrophic, and
segmented according to the four diatom communities’ affili-
warm to temperate waters with low siliceous produc-
ation (Fig. 3b). These clusters show clear changes of diatom
tivity due to low DSi availability and weak mixing in
populations’ contribution throughout the time series (Fig. 3c)
surface waters (Romero and Fischer, 2017; Nave et al.,
with the dominance of open-ocean and costal upwelling pop-
2001; Romero et al., 2005; Crosta et al., 2012). The
ulations between 1988 and 1996. Open-ocean diatoms domi-
term “low DSi” availability (< 5 µmol kg−2 ) is used in
nated from 1997 to 2001, while benthic taxa were main con-
comparison to the “high DSi” availability in coastal
tributors from 2002 to 2009.
waters of EBUEs, which is at least 4 to 10 times
A major shift in the relative contribution of the diatom
higher than in open-ocean waters of the mid-latitude
groups is seen from May 2002 onward. This shift occurred
North Atlantic (Ragueneau et al., 2000). The highly di-
in two steps (Figs. 2b and 3c). The percentage of benthic di-
verse group of open-ocen taxa are dominated by sev-
atoms strongly increased between the middle of May and the
eral species of Azpeitia, together with Fragilariopsis do-
middle of June 2002 (increase from 12.5 % to 68.6 %; trap
liolus, Nitzschia bicapitata, Nitzschia interruptestriata,
CBmeso13, samples 2 and 3, 12 May to 19 June 2002). Ben-
Roperia tesselata, and Planktoniella sol.
thic diatom contribution decreased below 40 % in early 2004.
The multivariate analyses performed on the relative abun- A second increase occurred in winter 2006, with values being
dance of diatom populations (Fig. 3) confirm the strong in-
Biogeosciences, 18, 1873–1891, 2021 https://doi.org/10.5194/bg-18-1873-2021O. E. Romero et al.: A 2-decade (1988–2009) record of diatom fluxes in the Mauritanian coastal upwelling 1881
Table 3. Species composition of the assemblage of diatoms at the site CBmeso between March 1988 and June 2009.
Group Species Main References
1. Benthic Actinoptychus senarius Andrews (1981), Round et al. (1990),
Actinoptychus vulgaris Hasle and Syvertsen (1996)
Biddulphia alternans
Cocconeis spp.
Delphineis surirella
Diploneis spp.
Gomphonema spp.
Odontella mobiliensis
Paralia sulcata
Psammodyction panduriformis
Rhaphoneris amphiceros
Tryblionella spp.
2. Coastal upwelling Chaetoceros affinis Hasle and Syvertsen (1996), Abrantes
Chaetoceros cinctus et al. (2002), Nave et al. (2001),
Chaetoceros compressus Romero et al. (2002), Romero and
Chaetoceros constrictus Armand (2010)
Chaetoceros coronatus
Chaetoceros debilis
Chaetoceros diadema
Chaetoceros radicans
Thalassionema nitzschioides var. nitzschioides
3. Coastal planktonic Actinocyclus curvatulus Romero and Armand (2010), Romero
Actinocyclus octonarius and Fischer (2017), Crosta et al. (2012),
Actinocyclus subtilis Romero et al. (2009, 2012, 2020)
Azpeitia barronii
Chaetoceros concavicornis (vegetative cell)
Coscinodiscus argus
Coscinodiscus centralis
Coscinodiscus radiatus
Cyclotella litoralis
Proboscia alata
Shionodiscus oestrupii var. venrickae
Stellarima stellaris
Thalassionema pseudonitzschioides
Thalassiosira binata
Thalassiosira conferta
Thalassiosira delicatula
Thalassiosira dyporocyclus
Thalassiosira elsayedii
Thalassiosira poro-irregulata
Thalassiosira rotula
4. Open ocean Alveus marinus
Aserolampra marylandica
Asteromphalus arachne
Asteromphalus cleveanus
Asteromphalus flabellatus
Asteromphalus heptactis
Asteromphalus sarcophagus
Azpeitia africana
Azpeitia neocrenulata
Azpeitia nodulifera
Azpeitia tabularis
Bacteriastrum elongatum
Bogorovia spp.
Coscinodiscus reniformis
https://doi.org/10.5194/bg-18-1873-2021 Biogeosciences, 18, 1873–1891, 20211882 O. E. Romero et al.: A 2-decade (1988–2009) record of diatom fluxes in the Mauritanian coastal upwelling
Table 3. Continued.
Group Species Main References
4. Open ocean Detonula pumila Romero and Armand (2010), Romero
Fragilariopsis doliolus and Fischer (2017), Romero
Guinardia cylindrus et al. (2005, 2020), Crosta et al. (2012)
Haslea spp.
Hemidiscus cuneiformis
Leptocylindrus mediterraneus
Nitzschia aequatoriale
Nitzschia bicapitata
Nitzschia capuluspalae
Nitzschia interruptestriata
Nitzschia sicula
Nitzschia sicula var. rostrata
Planktoniella sol
Pseudo-nitzschia spp.
Pseudosolenia calcar-avis
Pseudotriceratium punctatum
Rhizosolenia acuminata
Rhizosolenia bergonii
Rhizosolenia imbricatae
Rhizosolenia robusta
Rhizosolenia setigera
Rhizosolenia styliformis
Roperia tessellata
Shionodiscus oestrupii var. oestrupii
Thalassionema bacillare
Thalassionema frauenfeldii
Thalassionema nitzschioides var. capitulata
Thalassionema nitzschioides var. inflata
Thalassionema nitzschioides var. lanceolata
Thalassionema nitzschioides var. parva
Thalassiosira eccentrica
Thalassiosira endoseriata
Thalassiosira ferelineata
Thalassiosira lentiginosa
Thalassiosira leptopus
Thalassiosira lineata
Thalassiosira nanolineata
Thalassiosira parthenia
Thalassiosira plicata
Thalassiosira punctigera
Thalassiosira sacketii var. sacketii
Thalassiosira sacketii var. plana
Thalassiosira subtilis
Thalassiosira symmetrica
Thalassiothrix spp.
mostly above 50 % almost throughout until the end of the trap upwelling = ±10.46 %, (3) coastal planktonic = ±11.88 %,
experiment in June 2009 (Fig. 2b). The dominance of benthic and (4) open ocean = ±16.00 %).
diatoms at CBmeso also prevails after 2009 (Romero, un- The impact of the environmental variables on diatom com-
publ. data). The marked increase in variability of the benthic munities was investigated by comparing the sample cluster-
relative contribution is clearly evidenced by the highest vari- ing and the values of low-frequency forcings (Fig. 4). AMO,
ability among all diatom groups (1 SD of each group for the the Shannon diversity index, and total diatom flux show
whole study interval is (1) benthic = ±23.68 %, (2) coastal significant differences between groups (Kruskal–Wallis test;
p value < 0.05), whereas no statistical differences have been
Biogeosciences, 18, 1873–1891, 2021 https://doi.org/10.5194/bg-18-1873-2021O. E. Romero et al.: A 2-decade (1988–2009) record of diatom fluxes in the Mauritanian coastal upwelling 1883
Figure 4. Comparison of clusters extracted from multivariate analysis according to total diatom flux, AMO, and Shannon diversity measured.
observed for the NAO, ENSO, and Pacific Decadal Oscil-
lation indices. Only benthic diatoms (group 4) show higher
AMO values compared to the three other groups (pairwise
Wilcoxon rank sum test; p value < 0.05). In addition, a gradi-
ent in the Shannon diversity index of the diatom populations
(Fig. 4c) is observed with predominantly low values (1.7–
2.5) corresponding to benthic (group 4), intermediate val-
ues (2.7–3) for coastal planktonic (group 3), and high values
(3.1–3.45) in samples dominated by coastal upwelling and
open-ocean populations (groups 2 and 1) (pairwise Wilcoxon
rank sum test; p value < 0.05). The statistical analysis also
shows that, during intervals dominated by coastal upwelling
populations, the total diatom flux was higher compared to
values when other diatom groups dominated the community.
The correlogram performed between CA axes and the low-
frequency climate indices also confirms these trends (Fig. 5).
A significant positive and negative correlation was found be-
tween the first CA axis sample scores and AMO and Shan-
non diversity index (Fig. 3). Given that the first CA is posi-
tively driven by the benthic group, this confirms the outstand-
ing dominance of the benthic diatom D. surirella after May
2002, which also appears to be linked to the strengthening
of AMO. In the same way, the fact that the second CA axis
is positively correlated with total diatom flux confirms that
coastal upwelling diatoms deliver a large number of diatom
valves.
Figure 5. Correlogram representing Spearman’s correlation rank
between CA axes (i.e., Dim.1, Dim.2, Dim.3), environmental vari- 5 Discussion
ables, and climatic and diversity indexes. Color scale and circle size
indicate the strengths of the correlation. Squares without an “X” in- The long-term diatom record at the site CBmeso offers the
dicate significant relationships (p value < 0.05). For interpretation possibility of discussing population dynamics in the context
of the references to color in this figure legend, the reader is referred of the high-frequency atmospheric and hydrographic dynam-
to the web version of this article. ics along the CC EBUE and the low-frequency climate vari-
ability in the North Atlantic. In Sect. 5.1, we discuss the im-
pact of climate forcing on the long-term trends of the diatom
community and the total diatom flux and the two-step shift
https://doi.org/10.5194/bg-18-1873-2021 Biogeosciences, 18, 1873–1891, 20211884 O. E. Romero et al.: A 2-decade (1988–2009) record of diatom fluxes in the Mauritanian coastal upwelling
Figure 6. Time series of ratio benthic : all groups (olive bars, a) at the site CBmeso and the Atlantic Multidecadal Oscillation (AMO, b)
between March 1988 and May 2009. The fill in (b) represents the colder phase (blue) and the warmer phase (yellow) of AMO. Inverted
arrows in the lower panel below the benthic : all group bars represent the abrupt increase in relative contribution of benthic diatoms, first seen
at CBmeso in early winter 2002 and in winter 2006 at CBmeso and at CBeu (Romero and Fischer, 2017; Romero et al., 2020). Shadings in
the background: light orange, El Niño–Southern Oscillation (ENSO); grey, La Niña (LN). For interpretation of the references to color in this
figure legend, the reader is referred to the web version of this article.
in the species-specific composition of diatom populations. In Zhang, 2013; Knight et al., 2005; McCarthy et al., 2015). It
the second subsection (Sect. 5.2), we compare the CBmeso is widely accepted that AMO is largely induced by AMOC
data with those previously published at the eutrophic site variations and the associated fluctuations of heat transport
CBeu (Romero and Fischer, 2017; Romero et al., 2020) and (Knight et al., 2005; Medhaug and Furevik, 2011; Wang and
discuss (i) the effect of the giant chlorophyll filament and Zhang, 2013; McCarthy et al., 2015; details in Sect. 3.2.1).
(ii) the impact of lateral advection from the shallow coastal Using observational data and model experiments, Wang and
area off Mauritania upon the hemi- and pelagic realms along Zhang (2013) concluded that the cooling of the subtropical
the NE Atlantic Ocean. North Atlantic (where the CBmeso is deployed) is largely
Based on outstanding shifts in the species-specific com- due to the meridional advection by the anomalous northward
position of the diatom assemblage that occurred throughout current. The anomalous cooling appears below 100 m and
the study (Figs. 2b and 3), we propose three main intervals extends down to ca. 1500 m water depth, with a maximum
in the multiyear evolution of populations and discuss them cooling around 200 m between 8 and 20◦ N. During the cold
in view of major environmental forcings: (i) early 1988–late phase of the AMO, the anomalous southward meridional cur-
1996 (gradually decreasing trend of coastal upwelling di- rent is responsible for the subsurface ocean warming (Wang
atoms), (ii) 1997–1999 (highest contribution of diatoms typ- and Zhang, 2013).
ical of low- to moderate-productivity waters), and (iii) 2002– An additional effect of the AMO impact is the signifi-
the middle of 2009 (major shift in the species-specific com- cant long-term weakening (strengthening) of the gyre during
position: extraordinary increase in and dominance of benthic warm (cold) phase of AMO. This weakening contributes to
diatoms). the anomalous northward MC in subsurface waters (ca. 100–
200 m), while its strengthening causes an anomalous south-
5.1 The impact of low-frequency forcing on the ward current. The decreasing contribution of upwelling di-
variability of diatom populations off Mauritania atoms between 1988 and 1996 (Figs. 2b and 3c) matches
the transition from a predominantly cool into a warm AMO
5.1.1 AMO and the two-step increase in benthic phase during the late 1990s (Fig. 6; Wang and Zhang, 2013,
diatoms’ contribution and references therein). The simultaneous increase in the
contribution of open-ocean diatoms is additional evidence for
Based on the long-term trends of our data and their statisti-
decreased diatom productivity (Fig. 2) and the predominant
cal analysis (Figs. 2–5), we propose that the three intervals
occurrence of oligo-mesotrophic waters bathing the CBmeso
reflect the response of the diatom populations to the impact
site towards the earliest 1990s, with the stronger input of the
of low-frequency environmental forcing. As described above
silica-depleted NACW (see Sect. 3.1).
in Sect. 4.2, the benthic diatom community appears posi-
In addition to AMO forcing, the possible impact of NAO
tively correlated with AMO (Fig. 6). Among low-frequency
on the seasonal dynamics of the biogenic silica (opal) fluxes
forcings affecting the subtropical North Atlantic (see above
and eolian input off Mauritania has been previously dis-
Sect. 3.2), the AMO plays a key role in determining decadal
cussed in Fischer et al. (2016). They observed that winter
variations in SST and meridional circulation (e.g., Wang and
Biogeosciences, 18, 1873–1891, 2021 https://doi.org/10.5194/bg-18-1873-2021O. E. Romero et al.: A 2-decade (1988–2009) record of diatom fluxes in the Mauritanian coastal upwelling 1885 biogenic silica fluxes had an increasing trend with an increas- the vigorous mixing in the uppermost water column due to ing NAO index (Fischer et al., 2016). However, our statistical the confluence of northward and southward water masses approach (clustering and the Kruskal–Wallis tests) does not and strong, predominantly westward winds off Mauritania show any clear relationship between each individual diatom (Fig. 1; see Sect. 3.1), the offshore transport from shallow group and the NAO index. Nevertheless, the correlogram into deeper waters is most intense between 20.5 and 23.5◦ N (Fig. 5) shows that the samples’ scores of first CA axis (Dim. along the northwestern African margin. Erosional processes 1, which discriminates the benthic diatoms from the other di- in the very dynamic coastal realm significantly contribute atom groups) seem to be impacted by the NAO, but with a to the downward transport of particulates and microorgan- low percentage of variance explained (low R 2 ) compared to ism remains (Meunier et al., 2012) and are responsible for AMO. Interestingly, the correlogram also showed a reverse sporadic particle clouds advected up to several hundreds of correlation between AMO and NAO (Fig. 5). These results kilometers offshore within intermediate and bottom near- match previous observations and modeling experiments and nepheloid layers (Fischer and Karakaş, 2009; Fischer et al., support the fact that the linkage between AMO and NAO is 2009; Nowald et al., 2015). This nepheloid-layer-mediated still debatable. An indication of some relation between NAO transport additionally benefits from the bathymetry of the and AMO, with northerly winds associated with a positive Mauritanian shelf and slope (Nowald et al., 2015). The sub- AMO and zonal winds with a negative state of AMO, has surface layer (100 to 300 m water depth), in turn strongly been proposed (Yamamoto and Palmer, 2016). At this stage, affected by the AMOC intensification due to AMO impact we conclude that AMO seems to impact stronger on the mul- (Wang and Zhang, 2013), might be the place of mixing pro- tiyear pattern of variability of diatom communities off Mau- cesses of laterally advected materials from the shelf (where ritania than NAO and confirm a potential link between both benthic diatoms predominantly thrive) by the activity of the climatic indexes. giant chlorophyll filament, with relatively fresh material de- An extraordinary feature of the multiyear dynamics of rived from the open-ocean surface (as represented by the diatom populations at the CBmeso site is the sharp shift other three diatom groups; Fig. 2). As the nepheloid-layer- in the species contribution between May and June 2002 mediated transport contributes more intensively to the depo- (Fig. 2b). The species shift leading to larger contribution of sition of diatom remains upon the lower slope and beyond benthic diatoms follows a two-step increase pattern: the first than direct vertical settling from the euphotic layer does after abrupt increase is observed in late May–early June 2002. 2001, the area of final burial of diatom valves is effectively The second increase occurs in winter 2006, with values displaced from their production environment in surface wa- mostly above 50 % almost until the end of the trap exper- ters overlying the CBmeso site into their area of final depo- iment (June 2009, Fig. 6). The dominance of benthic taxa sition in deep-sea sediments below 4000 m water depth. also prevails throughout until recently recovered traps at the site CBmeso (Oscar E. Romero, unpublished data). As al- 5.1.2 The occurrence of the strong 1997 ENSO and the ready observed in previous studies at the neritic site CBeu response of the diatom community off Mauritania (Romero and Fischer, 2017; Romero et al., 2020; see further discussion in Sect. 5.2), the diatom D. surirella also domi- CB8 and CB9, the traps temporally corresponding to the nates the benthic community at the site CBmeso. This small 1997–1999 ENSO and La Niña, were deployed at different diatom (length = 5–15 µm) occurs predominantly attached to depths (Table 1; see also above Sect. 2.1). Although this sand grains in shallow marine habitats within the euphotic depth difference might have impacted on the total diatom zone and is an occasional component of the thycoplanktonic flux (stronger dissolution in deeper waters, Romero and Ar- community (Andrews, 1981). Delphineis surirella originally mand, 2010; larger catchment area of lower traps, Fischer thrives in shallow waters (above 50 m depth), overlying the et al., 2016), the total diatom flux is low in both traps and wide Mauritanian upper shelf, and its valves are suspended hardly shows any dramatic increase or decrease with depth and transported downslope until reaching the traps at the (CB9, Fig. 2a). Additionally, the species-specific composi- deep mesotrophic CBmeso site. tion of the diatom community shows a significant match be- The intensification of the transport of AMOC intermedi- tween traps CB8 and CB9 (Fig. 2b). The dominance of open- ate waters during the warm phase of the AMO (Wang and ocean and coastal planktonic diatoms – common in waters of Zhang, 2013) might have also contributed to the strength- moderate- to low-nutrient conditions – matches well with the ening of lateral transport from subsurface shelf waters in the occurrence of low total diatom flux. This evidences that no Mauritanian offshore region. Earlier time-series studies at the significant difference in the record of diatom fluxes between CBmeso site (Fischer et al., 2009, 2016) and observation- the upper and lower traps occurred despite different depth based model experiments conducted along the Mauritanian deployments. upwelling (Helmke et al., 2005; Karakaş et al., 2006; Nowald The long-term trends mainly determined by the low- et al., 2015) already discussed the role of intermediate and frequency AMO (see Sect. 5.1.1) were altered in the second deep nepheloid layers in the lateral transport of particles and half of the 1990s by the impact of the strong 1997 ENSO microorganisms remains upon the pelagic realm. Based on (McPhaden, 1999). We postulate that both low coastal up- https://doi.org/10.5194/bg-18-1873-2021 Biogeosciences, 18, 1873–1891, 2021
1886          O. E. Romero et al.: A 2-decade (1988–2009) record of diatom fluxes in the Mauritanian coastal upwelling

welling diatom values (≤ 4 %) and total diatom flux between         5.2   Comparison of diatom fluxes and population
February 1997 and November 1999 (Fig. 2) are the response                 dynamics within the giant Mauritanian chlorophyll
of the diatom community off Mauritania to the impact of                   filament (CBmeso vs. CBeu)
ENSO upon the low-latitude NE Atlantic. The dominance
of taxa predominantly related to waters of low to moderate
productivity (1997: highest contribution of open-ocean di-          In this subsection, we compare the total diatom flux and the
atoms and lowest of coastal upwelling diatoms; 1998–1999:           assemblage composition at the site CBmeso with previous
highest contribution of coastal planktonic and open-ocean di-       results from the nearby trap site CBeu gained between 2003
atoms, typical of oligo-mesotrophic waters) evidences con-          and 2009 (Romero and Fischer, 2017; Romero et al., 2020).
siderable changes in the physical setting of the Mauritanian        The CBeu site locates ca. 80 nautical miles (∼ 150 km) off-
upwelling. Since the interval 1996–1999 records the lowest          shore at the continental slope below the giant Mauritanian
total diatom flux for the entire study (Fig. 2a, Table 2), we ar-   chlorophyll filament and hence between the coastline and
gue that ENSO negatively impacted on diatom productivity            the outer CBmeso site (Fig. 1). These two trap locations are
off Mauritania.                                                     under different nutrient availability and upwelling intensity
   A positive ENSO goes along with the weakening of E–              (Romero and Fischer, 2017; Fischer et al., 2016, 2019).
NE winds off Mauritania (Pradhan et al., 2006; Fischer et al.,         The less favorable conditions for diatom productivity in
2016). Weakened E–NE trades lead to the deepening of the            waters overlying the site CBmeso (Fig. 1b–d) are evidenced
thermocline below the depth of the source of upwelled wa-           by lower total diatom flux than at the site CBeu. In the sea-
ter, thus hindering the mixing of the water column and caus-        sonal pattern, the total diatom flux at the site CBmeso is al-
ing upwelling intensity off Mauritania to decrease until early      ways 2 orders of magnitude lower than values obtained at
1998 (Pradhan et al., 2006). Additionally, the size of the          the site CBeu (Fig. 7a). This also happens during fall, when
Mauritanian chlorophyll filament decreased between winter           the highest average seasonal flux is recorded at CBmeso
1997 and spring 1998, while becoming unusually large from           (5.6×10⁵ valves per square meter per day vs. 3.3×10⁶ valves
autumn 1998 to spring 1999 (Fischer et al., 2009). Com-             per square meter per day). We hypothesize that these flux dif-
plementary support of this ENSO-mediated impact on sur-             ferences reflect (i) the more intense upwelling in waters over-
face water productivity off Mauritania is provided by varia-        lying the Mauritanian slope (Mittelstaedt, 1983, 1991; Crop-
tions in bulk biogenic fluxes at the CBmeso site. The almost        per et al., 2014), (ii) the weakening of the offshore transport
2.5 times higher organic carbon flux during 1998–1999 than          via the chlorophyll filament (Fig. 1b), (iii) the seaward de-
in 1997 (Helmke et al., 2005) led to the proposal that, after       creasing concentration of nutrients within the filament (Lath-
weakening of wind intensity due to the impact of ENSO on            uilière et al., 2008; Meunier et al., 2012), and (iv) the off-
the physical setting, upwelling intensified immediately after-      shore weakening of the lateral transport (Karakaş et al., 2006;
ward during La Niña (Fischer et al., 2016). Similarly, the sea-     Nowald et al., 2015). According to satellite imagery (Van
sonal cycle of surface chl a distribution in waters above the       Camp et al., 1991; Gabric et al., 1993; Fischer et al., 2016;
CBmeso site reveals a noticeable event (∼ 250 % increase)           Fig. 1b–d), the CBmeso mooring locates only occasionally
in Mauritanian coastal waters (Pradhan et al., 2006).               beneath the giant chlorophyll filament. In general, the larger
   ENSO has a significant global impact on the dynamics             DSi availability (approximately 10 vs. 5 µM) and the higher
of primary producers via teleconnections (McPhaden, 1999;           Si : N ratios of the source waters (SACW vs. NACW = 0.6 vs.
Levine et al., 2017). Aperiodic, pronounced decreases in the        0.3; Arístegui et al., 2009) in coastal water bathing site CBeu
total diatom flux matching the occurrence of strong EN-             are reflected in ca. 3-fold-higher biogenic silica fluxes at the
SOs in other ocean basins have been previously associated           coastal CBeu – whose particle downward transport is addi-
with limiting nutrient levels due to ENSO-derived perturba-         tionally affected by strong ballasting due to higher lithogenic
tions. The diatom production in hemipelagic waters in the           input from the nearby western African continent – compared
Chilean EBUE decreased extraordinarily during the strong            to the offshore CBmeso site (Fischer et al., 2019).
1997 ENSO compared to earlier years (Romero et al., 2001).             Complementary support of the scenario of lower (higher)
Similar negative impacts linked to ENSO teleconnections             productivity levels at CBmeso (CBeu) is provided by the
have been proposed for other ocean areas, including the             species-specific composition of the assemblage: relative con-
southern Californian EBUE (Lange et al., 2000), the Cari-           tribution of groups related with oligo-mesotrophic waters is
aco Basin (Romero et al., 2009b), the western Mediterranean         higher at CBmeso than at CBeu (coastal planktonic and open
Sea (Bárcena et al., 2004; Rigual-Hernández et al., 2013),          ocean, Fig. 7d and e), while the opposite is true for diatoms
and the subarctic Pacific Ocean (Takahashi, 1987).                  typical of eutrophic waters (Fig. 7c). Despite the difference
                                                                    in the relative contribution, the species-specific composition
                                                                    of diatom groups is remarkably similar at both sites. All the
                                                                    main taxa of diatom groups at the site CBmeso (Table 3; see
                                                                    also Sect. 4.2) are also found in CBeu samples (see Table 2 in
                                                                    Romero and Fischer, 2017). Both trap sites are linked via lat-

Biogeosciences, 18, 1873–1891, 2021                                                    https://doi.org/10.5194/bg-18-1873-2021
You can also read