A brighter tomorrow begins with better demand data - by J. Scott Susich | January 2021 - DTN
←
→
Page content transcription
If your browser does not render page correctly, please read the page content below

A brighter tomorrow begins
with better demand data
by J. Scott Susich | January 2021

    www.dtn.com • 800.660.2675
    ©2021 DTN, LLC, all rights reserved. “DTN” and the degree symbol
    logo are trademarks of DTN, LLC.
For the energy industry, 2021 will likely bring significant
operational challenges. The standard metrics, KPIs,
and assumptions traditionally used to make key
business decisions may suddenly fall short against the
unprecedented realities of today’s economic landscape.
When the models, processes, and information you
previously depended on are no longer sufficient, how do
you plan, prepare, and effectively manage your business?

1

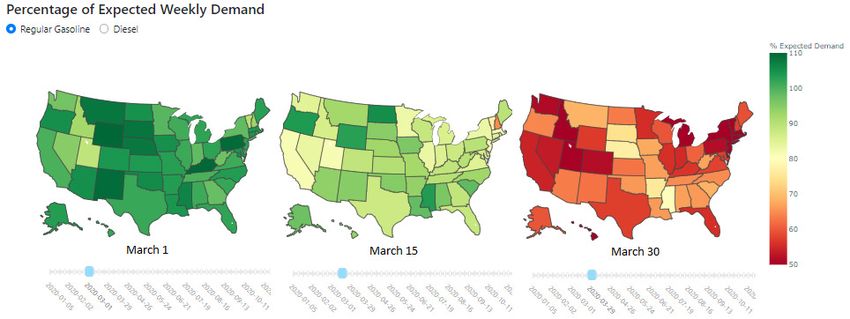
A new world
In the spring of 2020, as states shut down to slow the transmission of COVID-19,
the United States observed dramatic, negative impacts on its economic activity,
including fuel demand destruction. In the percentage of expected weekly demand
chart, you can see the deviation from expected demand, as forecast, based on
volume from the prior year. In a single month, most states dropped to 50-70%
of expected demand. How could the forecasts be so far off?

Declining expected weekly demand during March 2020.

2

We’ve all heard the age-old investment disclaimer, “past performance
does not guarantee future results.” While this disclaimer is wisely wielded
by investment advisors to absolve themselves of responsibility should
performance vary, past performance is still very much a key factor
when attempting to predict demand for refined fuels. And why not?
Historically, it’s been a great place to start.

One of the easiest forecasting methods is to look at the results for the
same day or same week of the previous year and adjust. Below is a 2019
chart of daily regular gasoline volume for Chicago from our new Refined
Fuels Demand solution. While it looks quite noisy on the surface, anyone
familiar with gasoline marketing recognizes the familiar spikey intra-
week pattern associated with the various days of the week.

Moving averages for Chicago regular gasoline in 2019, shown in DTN ProphetX®.

When we put on our forecasting hat, we can “smooth” much of that daily
noise with a 20-day moving average showing us that Chicago moved
about 4.6 million gallons of regular gasoline per day in 2019.

As defined here, “Chicago” is just one of several supply points serving
the metropolitan area. In looking forward, you might ask how much
of that volume is yours? How have you performed this year relative to
last? How do your internal trendlines and moving averages look? Were
there event-based impacts on last year’s performance — such as storms,

3
outages, or holidays — that will or won’t reoccur this year? Under typical
circumstances, you could build such a forecast for the following year, and
it would perform with a reasonably high degree of certainty.

And then in 2020: an unforeseeable global pandemic. On March 9, all
Illinois counties were declared disaster areas. By March 20, executive
stay-at-home orders were issued for residents. Suddenly, our 2020 chart
looks a lot different than we thought it would, dramatically departing
from the actual consumption volumes of 2019 — rendering the 2020
projections, based upon 2019, virtually useless.

Moving averages for Chicago regular gasoline in 2020, shown in DTN ProphetX.

Without a crystal ball, how can 2021 projections be trusted? Will the
impacts of COVID-19 still be felt as strongly? Will demand destruction be
as great in 2021? Or will it look more like 2019? How can historical models
guide our way into the future during unprecedented times?

What is becoming painfully obvious is that previous methods for
forecasting and determining demand impact are no longer sufficient, and
the challenge is clear. Even if the direct effects of the pandemic disappear,
other factors will likely take their place. Electric vehicle adoption rates
are increasing as commuters re-think mass transit while fleeing densely-
populated urban areas. Refiners themselves have made big COVID-induced
pushes toward the tax-favored increased margins associated with bio-
based refining. These trends will continue to impact gasoline and diesel
demand. Energy companies need a new way to make better decisions. How
can refined product demand be forecast more accurately?

4
A new way forward
To make better decisions, you need better data. What do we mean by better data? It
can mean a lot of things. It can mean that your data is “fresher.” It can mean that it
represents a greater sample size. It can also mean it is more accurate. Better yet, it
should capture all of these traits.

Year-over-year data will always have value in the forecasting process as it captures
calendar events like seasonality and fuel specification changes. However, “nearby”
data is critical for successful demand management. Market participants have
long searched for the intelligence necessary to adapt to rapidly-changing market
conditions; for example, access to daily city-level demand data, which had never been
available before.

Now, imagine a tool that could provide demand volumes, measured down to the
grade, meaning actionable strategies could be executed against independent regular,
midgrade, and premium gasoline objectives. What’s more, imagine the same detail
expressed in distillate grades. Perhaps most important is that this intelligence
is derived by electronically capturing nearly 85% of U.S. downstream petroleum
transactions. Picture the possibilities. This exclusive capability eliminates sampling
bias and manual survey errors translating into actual market measurements.

5
With such detail and accuracy, the opportunities for managing and
forecasting your business grow exponentially. Consider these scenarios:

    Assess market share
    In an attempt to increase market share, you can aggressively reduce pricing, yielding a
    4% increase in gasoline volumes over four days. However, better demand intelligence indicates
    that total market volume increased by 6.4% over the same period. Aware that market share
    was actually lost, you can promptly adjust your strategy.

    Avoid run-outs
    Nearby trending data shows distillate volumes skyrocketing at a rate that will exceed pipe
    replenishment capacity. Racks are soon destined for outages during peak agriculture demand.
    Management has the foresight to pull as much product into storage as possible ahead of the
    market. Additionally, barge deliveries to nearby waterborne terminals may be possible, or
    additional capacity on adjacent pipelines may be available.

    Increase profitability
    A company’s trading shop has seen daily regional and national gasoline volumes accelerate
    dramatically over the previous week and above last year’s level. It is very likely the market will
    react to the resulting EIA Weekly Petroleum Status Report with surprise, pushing NYMEX and
    corresponding physical market values higher. The shop uses better demand intelligence to
    position itself, protecting margins and potential profits from the move.

Better demand intelligence already exists. With solutions like the new
Refined Fuels Demand from DTN, companies up and down the supply
chain will soon be better equipped to manage physical supply and address
long-standing challenges in new ways.

6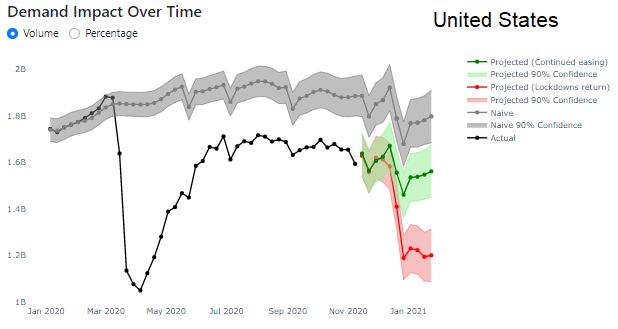
A step further
We know more accurate, timely data improves your nearby decisions, and we’ve just
discussed some of the ways it can help your business. As we reset our discussion on
forecasting, better, more flexible data can also improve your analysis by layering your
enhanced demand data with additional data sets to provide deeper insights and
more meaningful context.

To illustrate what better analysis might look like, let’s compare a baseline forecast
for 2020, utilizing five years of DTN historical demand data to build a naïve forecast
that uses classic analytics and no other outside data. Put another way, imagine it
is 2019, and you’re building your 2020 forecast. When applied to our state of Illinois
example, we get a naïve forecast that looks like this:

7
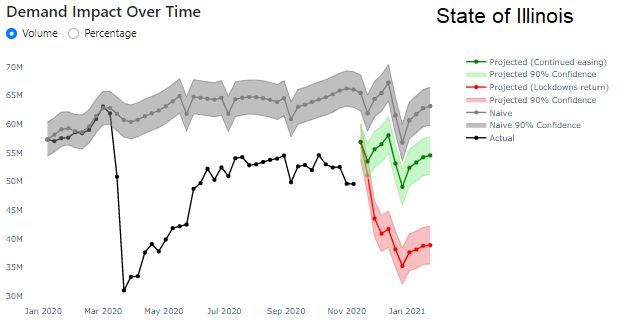
The gray-dotted naïve line is banded by the 90% confidence level. The
black dotted line is the actual regular gasoline demand for Illinois in
2020. After getting pummeled in March, demand was steadily advancing
its way back to the naïve expectations for 2020 — until September,
when the line begins to flatten and diverge. Part of the downturn was
expected, as it can be seen in the November naïve downturn. But, the
divergent trend is troubling. All of this then brings us back to forecasting
and what will happen next.

Let’s explore two potential paths forward and what impacts they
might have on the market. The first is that restrictions will continue to
ease, and the second is that lockdowns will return. Combining the DTN
historical Refined Fuels Demand intelligence and health metrics from the
Institute for Health Metrics and Evaluation (IHME), the following chart
shows Illinois with the two added perspectives mentioned.

8
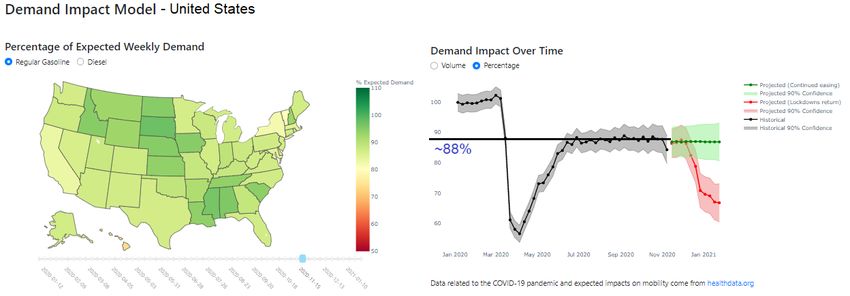
The two forecasts are added to the chart, bounded by their 90%
confidence levels. The green dotted line is the model’s expectation for
demand in Illinois if the state moves toward continued easing. That
divergent quality discussed earlier disappears, and the line moves closer
to the naïve forecast of a “normal” 2020. This would be the case if
restrictions continue to abate, businesses are allowed to return to normal
practices and occupancies, and public mobility trends back to 2019 levels.
On the other hand, the red dotted line represents demand should current
health trends and forecasts result in the return of lockdowns and stay-
at-home orders. Sadly, the actual numbers are trending toward the
lockdowns’ return forecast, which is not surprising given the staggering
return of COVID-19’s second wave.

Nationally, the chart of expected demand shows the country at a pivotal
crossroads, where demand could head down either path, depending on
the direction of its health trends.

Since July 2020, actual demand has very closely followed along the
pattern established by the DTN naïve forecast — albeit at reduced
levels. Nationally, regular gasoline demand is running at about 88%
of expectations.

9
The DTN naïve forecast model uses its proprietary market-level demand data.

The model uses proprietary market-level demand data from DTN and
is processed against six health-related metrics from all 50 states. It
demonstrates that energy companies could have the capability to
position the right amounts of the right products, at the right places, at
the right time. Better data can deliver greater insight and more powerful
context to guide better decisions.

Planning, managing, and profitably operating a business is challenging
under the best of circumstances. Despite huge gains in data science and
analytics over the last 10 years, outcomes are still limited by the quantity
and quality of available data. The addition of daily, market-specific
demand data is a game-changer in providing a critical perspective to any
commodity-based business. But in the downstream petroleum market,
whose best alternatives have been months-old or spotty in coverage,

Refined Fuels Demand from DTN is a paradigm shift. The intelligence
enhances business decisions up and down the vertical from supply and
distribution to trading to sales and marketing. Surviving in the chaotic
world of a global pandemic requires every advantage one can muster.
Thriving in the aftermath will be left to those best equipped with the
intelligence to manage their success.

     Explore the solution
     Visit www.dtn.com/refined-fuels-demand to learn more
     about our new Refined Fuels Demand solution.

10
You can also read