A Chair-Based Unconstrained/Nonintrusive Cuffless Blood Pressure Monitoring System Using a Two-Channel Ballistocardiogram
←
→
Page content transcription
If your browser does not render page correctly, please read the page content below
sensors
Article
A Chair-Based Unconstrained/Nonintrusive Cuffless
Blood Pressure Monitoring System Using a
Two-Channel Ballistocardiogram
Kwang Jin Lee 1 , Jongryun Roh 2 , Dongrae Cho 1 , Joonho Hyeong 2 and Sayup Kim 2, *
 1   Deepmedi Research Institute of Technology, Deepmedi Inc., Seoul 06232, Korea;
     kjlee@deep-medi.com (K.J.L.); dongrae30@deep-medi.com (D.C.)
 2   Human Convergence Technology Group, Korea Institute of Industrial Technology (KITECH),
     143 Hanggaulro, Ansan 15588, Korea; ssaccn@kitech.re.kr (J.R.); freegore@kitech.re.kr (J.H.)
 *   Correspondence: sayub@kitech.re.kr; Tel.: +82-31-8040-6873

 Received: 21 December 2018; Accepted: 29 January 2019; Published: 31 January 2019

 Abstract: Hypertension is a well-known chronic disease that causes complications such as
 cardiovascular diseases or stroke, and thus needs to be continuously managed by using a simple
 system for measuring blood pressure. The existing method for measuring blood pressure uses a
 wrapping cuff, which makes measuring difficult for patients. To address this problem, cuffless
 blood pressure measurement methods that detect the peak pressure via signals measured using
 photoplethysmogram (PPG) and electrocardiogram (ECG) sensors and use it to calculate the pulse
 transit time (PTT) or pulse wave velocity (PWV) have been studied. However, a drawback of these
 methods is that a user must be able to recognize and establish contact with the sensor. Furthermore,
 the peak of the PPG or ECG cannot be detected if the signal quality drops, leading to a decrease in
 accuracy. In this study, a chair-type system that can monitor blood pressure using polyvinylidene
 fluoride (PVDF) films in a nonintrusive manner to users was developed. The proposed method
 also uses instantaneous phase difference (IPD) instead of PTT as the feature value for estimating
 blood pressure. Experiments were conducted using a blood pressure estimation model created via an
 artificial neural network (ANN), which showed that IPD could estimate more accurate readings of
 blood pressure compared to PTT, thus demonstrating the possibility of a nonintrusive blood pressure
 monitoring system.

 Keywords: cuffless blood pressure monitoring system; hypertension; photoplethysmogram

1. Introduction
     Hypertension is a well-known chronic disease, which affects approximately 25% of all adults in
the world according to the World Health Organization (WHO) [1]. Unfortunately, most patients do
not know they have hypertension because they do not experience any symptoms until they suffer a
cardiovascular disease or stroke, making hypertension a silent killer. Campaigns to measure blood
pressure are conducted worldwide to alert people about the importance of its management [2].
     Since hypertension is a fatal disease that can result in death or disabilities due to cardiovascular
diseases or stroke, it requires an accurate diagnosis and response. A system that can continuously
measure blood pressure to alert patients to the dangers of hypertension is required. However,
the existing method to measure blood pressure uses a cuff wrapped around the arm, making it
cumbersome, and hence, most patients do not measure their blood pressure regularly. Recently,
cuffless blood pressure measurement techniques have been continuously researched to improve
the convenience of measurement [3–5]. The most popular methods for cuffless blood pressure

Sensors 2019, 19, 595; doi:10.3390/s19030595                                    www.mdpi.com/journal/sensors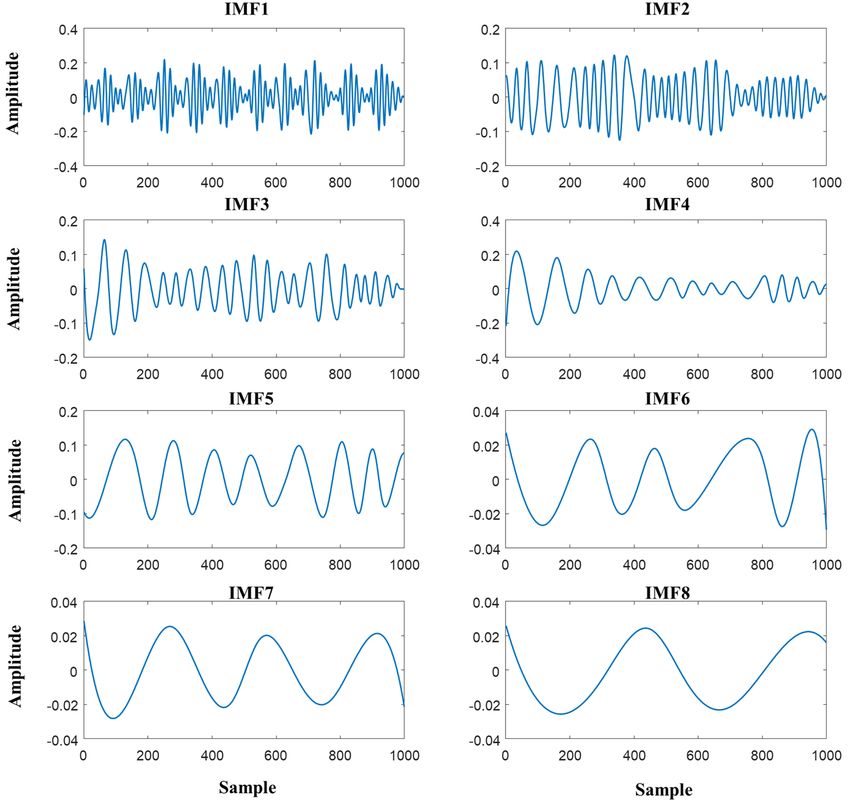
Sensors 2019, 19, 595                                                                            2 of 9

measurement involve the use of pulse transit time (PTT), which is calculated using electrocardiogram
(ECG) and photoplethysmogram (PPG) signals.
     The PTT has a significantly high correlation with blood pressure [5], and regression analysis
methods for measuring blood pressure using PTT have been researched [6–8]. However, these methods
failed to show sufficient accuracy to be applied in medical devices. Hence, estimation methods using
machine learning and deep learning algorithms have been evaluated to improve the accuracy of blood
pressure estimation [9,10].
     However, while estimating blood pressure using PTT, users must consciously make measurements
using ECG and PPG sensors to obtain their blood pressure. To address this issue, techniques for
non-intrusive measuring of biometric signals have been developed, thus improving the convenience
of measurement [11–13]. One of the biometric signals used is the ballistocardiogram (BCG) signal,
which measures the movement of the body during cardiac contraction and relaxation. Studies have
been actively carried out using radar and polyvinylidene fluoride resin (PVDF) films to measure
blood pressure using BCG signals. Further, other studies have estimated blood pressure by calculating
PTT using BCG, PPG, or ECG signals for users seated on a chair [14,15]. However, measuring blood
pressure using PPG cannot be considered as a fully nonintrusive/unrestricted system because the
users must be conscious while measuring their blood pressure, which is inconvenient. This is because
users or patients must attach their finger to PPG sensors in order to enable the measurement of PPG
signals. Therefore, they would be consciously rigid while having their blood pressure measured via
PPG. Moreover, BCG signals are combined with breathing or motion noises, which make it difficult
to capture the maximum peak of BCG, resulting in an error in the calculation of PTT using BCG and
ECG signals.
     To solve this problem, this study developed a fully nonintrusive/unrestricted chair-type cuffless
blood pressure monitoring system that utilizes two PVDF films. After measuring two BCG signals from
the two PVDF films, the phase difference between the two signals was calculated using the Hilbert
transform. Blood pressure was estimated via an artificial neural network (ANN) using this phase
difference as a feature value. The applicability of the developed system was verified by comparing the
estimated blood pressure with the results from the existing PTT calculation method.

2. Materials and Methods

2.1. System Summary
     In this study, a sofa-type experimental apparatus was fabricated to ensure the measurement of a
stable biometric signal. The weight was supported by a steel plate on an aluminum frame, and PVDF
films were attached to a urethane foam back and a cushion on the seat, which were then covered with
natural leather to create a structure similar to a sofa. The BCG signals were measured in real time
using the PVDF films attached to the experimental apparatus. To confirm that the BCG signals were
measured accurately, the PPG signals were simultaneously measured as a reference by using a PPG
sensor (RP520, Laxtha). The Atmega256 chip (Atmel Corporation, San Jose, CA, USA) was used as
a microcontroller and the sampling frequency was set at 100 Hz. The raw BCG signals were sent to
a computer system (Core i7, Window 10) via Bluetooth (Parani ESD-200, Sena technologies, Seoul,
Korea). The software developed in this study provides features such as noise processing extraction,
as well as modeling and functions of blood pressure estimation. The software was developed on a
MATLAB base. After the training stage, it can estimate blood pressure at intervals of 10 s through the
signals measured via the chair. The concept of the system is illustrated in Figure 1.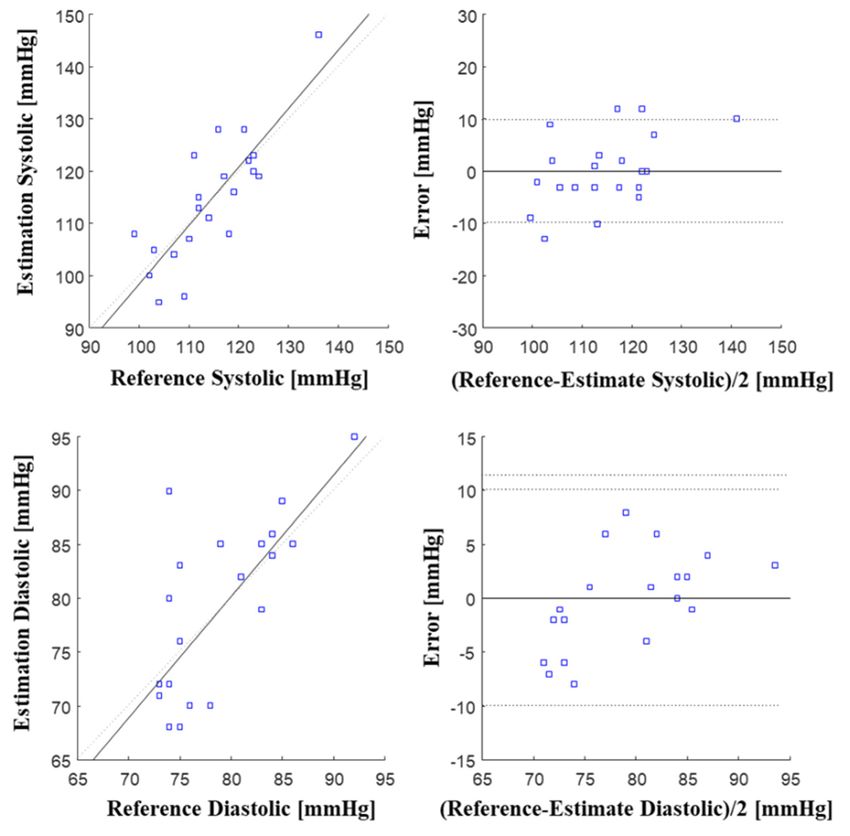
Sensors 2019, 19, 595 3 of 9
Sensors 2018, 16, x 3 of 4
Figure 1. Conceptual diagram of the chair-type unrestricted/nonintrusive blood pressure measurement
Figure 1. Conceptual diagram of the chair-type unrestricted/nonintrusive blood pressure
system. The entire system consists of a sensor interface device and a computational unit.
measurement system. The entire system consists of a sensor interface device and a computational
Ballistocardiograms (BCGs) are measured through the polyvinylidene fluoride (PVDF) films from the
unit. Ballistocardiograms (BCGs) are measured through the polyvinylidene fluoride (PVDF) films
chair’s back and seat plates and are sent to the computational unit (as indicated by a fine line), which
from the chair’s back and seat plates and are sent to the computational unit (as indicated by a fine
then estimates the blood pressure by extracting the features from the two BCG signals.
line), which then estimates the blood pressure by extracting the features from the two BCG signals.
2.2. Experimental Procedure
2.2. Experimental Procedure
This study conducted experiments on 30 adults aged 20–50 years (14 men, 16 women) with wide
Thisattributes
ranging study conducted
(35.3 ± 12.5 experiments on 30166.1
years, height: adults aged
± 9.4 cm,20–50
weight:years63.3(14
± men, 16 women)
12.8 kg). The subjectswith
wide selected
were rangingfrom attributes
a group (35.3 ± 12.5 with
of people years,
noheight: 166.1 ±The
hypertension. 9.4 study
cm, weight:
was approved63.3 ± 12.8
by thekg). The
Public
subjects were selected from a group of people with no hypertension. The
Institution Bioethics Committee designated by the Ministry of Health and Welfare of South Korea study was approved by
the Public
(IRB Institution Bioethics Committee designated by the Ministry of Health and Welfare of
P01-201812-12-001).
South Korea (IRB P01-201812-12-001).
In the experiments, the stable blood pressures of the subjects were measured simultaneously
In the experiments,
using the experimental sofa the stable
and blood pressures
a cuff-type of themonitor
blood pressure subjects were measured
(HEM-7121, Omron, simultaneously
Kyoto, Japan)
using the experimental sofa and a cuff-type blood pressure monitor (HEM-7121,
after the subjects were given a sufficient rest. The blood pressure was measured five times at intervals Omron, Kyoto,
Japan)
of 1 min. after the subjects were given a sufficient rest. The blood pressure was measured five times at
intervals of 1 min.
2.3. BCG Signal Processing Using Empirical Mode Decomposition
2.3. BCG Signal Processing Using Empirical Mode Decomposition
BCG signals consist of various other signals such as breathing signals and motion noises,
BCG signals
particularly consistnoises
many motion of various other
that occur signals
at low such as Since
frequencies. breathing signals
heartbeat andcan
signals motion noises,
be measured
particularly
in the bandwidthmanyofmotion
0.5–6 Hz, noises
BCGthat occur
signals at lowmotion
without frequencies.
noises Since heartbeatinsignals
were obtained this studycan by be
measured in the bandwidth of 0.5–6 Hz, BCG signals without motion noises
applying a third-order Butterworth band-pass filter with cut-off frequencies of 0.5–6 Hz. Figure 2 were obtained in this
study by
shows theapplying
comparison a third-order
of PPG signalsButterworth
with theband-pass
filtered BCGfiltersignals
with cut-off
from thefrequencies
back andofseat 0.5–6 Hz.
plates.
Figure 2 shows
Although the comparison
the signals underwentof PPG signals with
preprocessing throughthe afiltered BCGfilter,
band-pass signals
it isfrom the back
difficult and seat
to effectively
plates. Although
remove the signals underwent
the cardiorespiratory signals frompreprocessing
the BCG signals. through a band-pass
Empirical filter, it is difficult
mode decomposition (EMD) to
effectively
was used to remove the thenoise
cardiorespiratory
signals because EMD signals from to
is known thebe BCG
a better signals.
methodEmpirical
when compared mode
decomposition
to (EMD) was[16].
wavelet decomposition usedAstoone
remove
of thethe noise signalsmethods
decomposition becauseproposed
EMD is known by Huang to beet aal.better
[17],
method
EMD when compared
decomposes the signalsto wavelet decomposition
via intrinsic mode functions[16]. As one depending
(IMFs) of the decomposition
on the levelmethods
of local
proposed byThe
frequencies. Huang et al. [17],
decomposed EMDaredecomposes
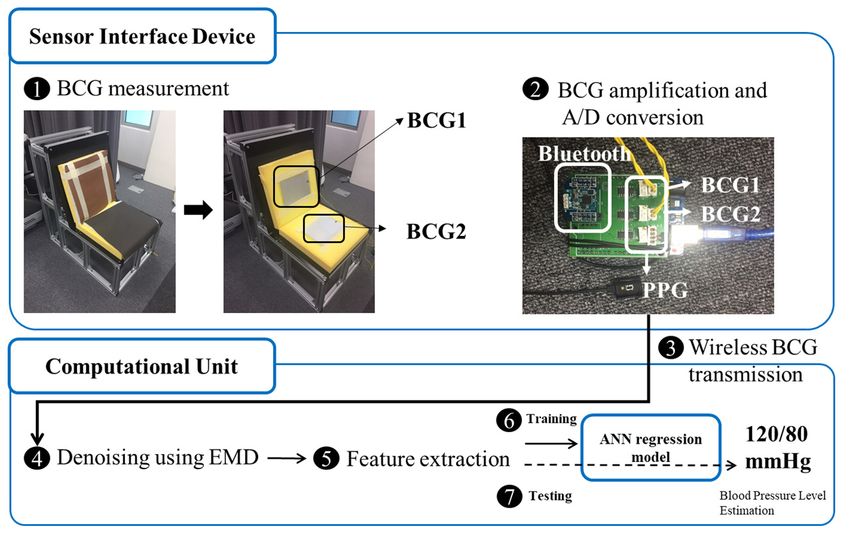
signals shown in Figurethe signals
3. Onlyviatheintrinsic
first IMFmode signalfunctions
was used (IMFs)
in this
depending on the level of local frequencies. The decomposed
study. The EMD method performs analysis according to the following procedure: signals are shown in Figure 3. Only
the first IMF signal was used in this study. The EMD method performs analysis according to the
(1) Identify
following the local maxima and local minima of the given time-series signals.
procedure:
(2) Use interpolation to estimate the upper and lower envelopes by connecting the local maxima and
(1) Identify the local maxima and local minima of the given time-series signals.
minima values, respectively.
(2) Use interpolation to estimate the upper and lower envelopes by connecting the local maxima
(3) Calculate the mean envelope by averaging the upper and lower envelopes determined in the
and minima values, respectively.
above point.
(3) Calculate the mean envelope by averaging the upper and lower envelopes determined in the
above point.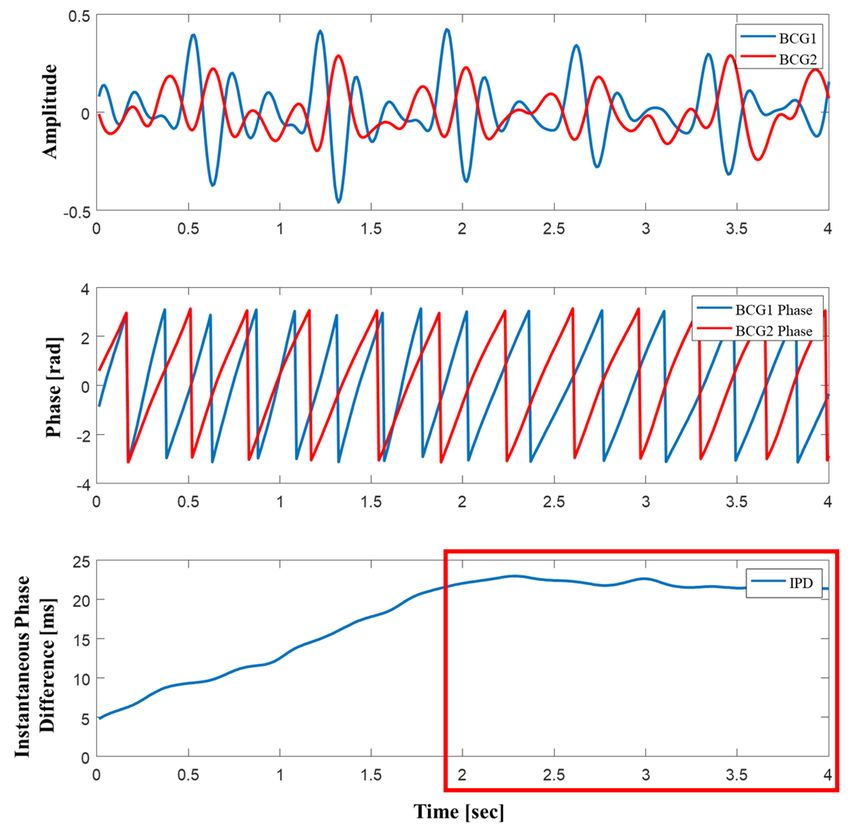
Sensors 2019, 19, 595 4 of 9
Sensors 2018,
Sensors 16, x16, x
2018, 4 of44of 4
(4) (4)Extract new
Extract newtime-series signals
time-series by by
signals subtracting
subtractingthethe
mean envelope
mean envelopedetermined
determined in thethe
above
(4) Extract new time-series signals by subtracting the mean envelope determined in theinabove above
point
point from
point thethe
from original signals.
original These
signals. Theseextracted signals
extracted areare
signals defined as IMF.
defined as IMF.
from the original signals. These extracted signals are defined as IMF.
(5) (5)SetSet
thethe
time-series signals
time-series from
signals which
from whichthethe
extracted
extractedIMF is removed
IMF is removedas new
as neworiginal signals
original signals
(5) Set the time-series signals from which the extracted IMF is removed as new original signals
andandrepeat steps (1) to (4). Define the new IMF until the newly designated original
repeat steps (1) to (4). Define the new IMF until the newly designated original signals signals areare
and repeat steps (1) to (4). Define the new IMF until the newly designated original signals are
expressed
expressed as as
a monotone
a monotone function
functionor or
have
haveonly oneone
only extreme
extreme value andand
value no nomore
morenewnew
expressed as a monotone function or have only one extreme value and no more new time-series
time-series signals can be extracted.
time-series signals can be extracted.
signals can be extracted.
Figure
Figure
Figure 2.2. Photoplethysmogram
2. Photoplethysmogram
Photoplethysmogram (PPG)
(PPG) signals
(PPG) measured
signals
signals measured
measured using thethe
using
using developed
the system
developed
developed as as
system
system reference
asreference
reference
signals,
signals,
signals, which
which indicate
which
indicatewhether
indicate whether
whether the peaks
thethe
peaks of
peaks the BCG
of the
of the BCG are
BCG working
areare properly.
working
working BCG1
properly.
properly. BCG1 and
BCG1 BCG2
andand
BCG2 refer
BCG2 refer
refer to
to the
the signals
tosignals
the measured
signals measured
measured from
from theback
from
the back
the andseat
back
and seatplates,
and plates,
seat respectively.
plates, respectively.
respectively.
Figure
Figure 3.3. BCG1
Figure BCG1
3. signals
signals
BCG1 decomposed
decomposed
signals decomposedthrough
throughempirical
empirical
through mode
mode
empirical decomposition
mode (EMD),
decomposition
decomposition outout
(EMD),
(EMD), of of
out which
ofwhich
which
IMF1
IMF1 (intrinsic
IMF1(intrinsic mode
mode
(intrinsic function)
modefunction)was
was
function) used.
used.
was used.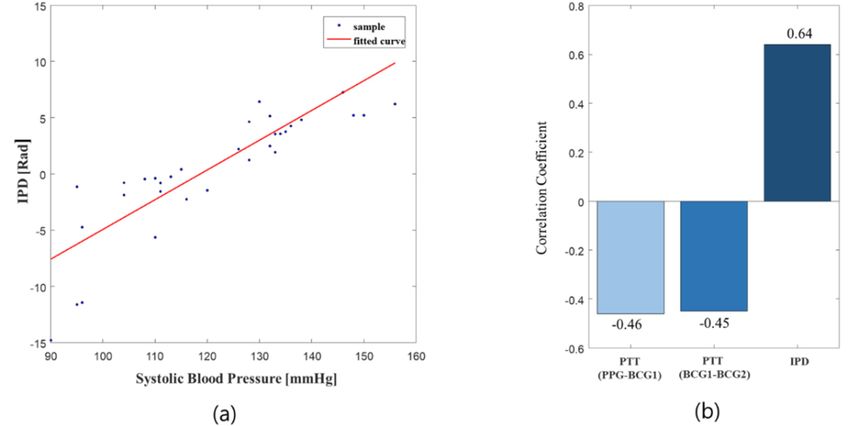
Sensors 2018,2019,
Sensors 16, x19, 595 5 of 45 of 9
2.4. BCG Data Analysis and Feature Extraction
2.4. BCG Data Analysis and Feature Extraction
The estimation of blood pressure using PTT is greatly affected by the accuracy of finding the
peak i.e.,The
the estimation of blood
blood pressure cannotpressure using PTT
be estimated is greatly
correctly if the affected by the from
peak is missed accuracy of finding
signals. Hence, the
peak
while thei.e., thewas
peak bloodnotpressure
sought, cannot
the samebe estimated
features ascorrectly
PTT were if the peak isfrom
extracted missed
thefrom
BCGsignals.
signals Hence,
by
while
using the the peak was not
instantaneous sought,
phase the same
difference (IPD)features
method.asManyPTT were extracted
researchers havefrom
usedthe BCG
this signals
method to by
using blood
estimate the instantaneous
pressure fromphasePPGdifference
signals,(IPD) method. Many
demonstrating researchers correlation
its significant have used thiswithmethod
PTT to
estimate
[18,19]. The blood pressure phase
instantaneous from PPGwassignals,
obtaineddemonstrating
from the first itsIMF
significant
of the correlation with PTT
two BCG signals [18,19].
using
The transform,
Hilbert instantaneous and phase was obtained
then deducted from the
to determine thefirst
IPD IMF of the 4).
(see Figure twoAsBCG signals
shown using4,Hilbert
in Figure we
transform,
extracted and then
features fromdeducted
the parttobetween
determine thetwo
the IPDBCG
(see Figure
signals4).with
As shown in Figure
less phase 4, we extracted
difference. To
determine the PTT for comparison with IPD, the peak was found by using adaptive threshold detectionPTT
features from the part between the two BCG signals with less phase difference. To determine the
[20].for comparison with IPD, the peak was found by using adaptive threshold detection [20].
Figure 4. Process
Figure to calculate
4. Process instantaneous
to calculate phase
instantaneous difference
phase (IPD).
difference (IPD).
2.5. 2.5.
ANN ANN
To create
To create a blood
a blood pressure
pressure estimation
estimation model,model, a regression
a regression analysisanalysis
modelmodel was created
was created using anusing
ANN. An ANN is a mathematical model consisting of numerous processing elements with a a
an ANN. An ANN is a mathematical model consisting of numerous processing elements with
hierarchical
hierarchical structure
structure ininwhich
which the
the relationships
relationshipsbetween
betweeninputs
inputs andand
outputs are studied
outputs by adjusting
are studied by
the weighted values repeatedly across previous input data and the corresponding
adjusting the weighted values repeatedly across previous input data and the corresponding output output data. It can
data. It can be used to estimate a very complex nonlinear function. In fact, a multilayerback
be used to estimate a very complex nonlinear function. In fact, a multilayer feed-forward
propagation
feed-forward ANN
back with one hidden
propagation ANN withlayerone
is sufficient for fitting
hidden layer a continuous
is sufficient function.
for fitting The median
a continuous
of the IPD value of two BCG signals and personal information (height, weight,
function. The median of the IPD value of two BCG signals and personal information (height, weight, age) was entered in
the ANN input layer as the feature values, and 25 neurons of the hidden layer
age) was entered in the ANN input layer as the feature values, and 25 neurons of the hidden layer were used. The SBP
wereand DBPThe
used. values
SBP were
and DBPestimated
valuesfrom
werethe two output
estimated fromneurons
the twoinoutput
the output layer.
neurons in The
the ANN
outputwas
trained using the Levenberg–Marquardt algorithm with 70% of the sample
layer. The ANN was trained using the Levenberg–Marquardt algorithm with 70% of the sample data as training set, 15% as
data as training set, 15% as validation set, and the remaining 15% as testing set. The model was then via
validation set, and the remaining 15% as testing set. The model was then trained and evaluated
10-fold
trained andcross validation
evaluated to obtain
via 10-fold thevalidation
cross optimum to model.
obtain the optimum model.
3. Results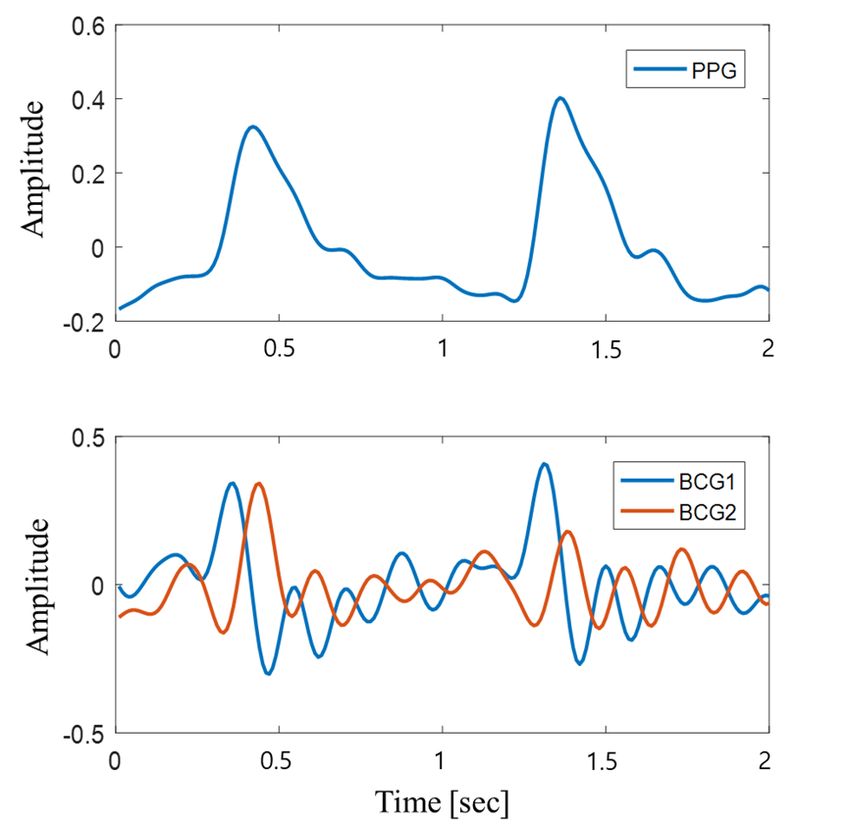
Sensors 2019, 19, 595                                                                                             6 of 9

3. Results
Sensors 2018, 16, x                                                                                           6 of 4

     IPD
3.1. IPD
     To examine
         examinethe therelationship
                         relationshipbetween
                                        between  IPDIPD
                                                      andand
                                                           blood pressure,
                                                               blood       the relationship
                                                                      pressure,              between
                                                                                 the relationship      the median
                                                                                                      between   the
of the IPD
median       andIPD
         of the   theand
                      systolic  blood pressure
                           the systolic              was observed
                                         blood pressure             [19]. As
                                                            was observed      shown
                                                                           [19].       in Figure
                                                                                 As shown         5, the5,IPD
                                                                                             in Figure         was
                                                                                                           the IPD
correlated
was         with with
     correlated  the blood   pressure
                        the blood       i.e., the
                                    pressure      higher
                                               i.e.,      the blood
                                                     the higher     pressure,
                                                                the blood      the greater
                                                                           pressure,        the difference
                                                                                      the greater           of IPD.
                                                                                                    the difference
The
of   correlation
   IPD.           coefficient
        The correlation        betweenbetween
                            coefficient   PTT andPTT  the systolic
                                                           and theblood  pressure
                                                                   systolic blood also   suggests
                                                                                    pressure   also that the blood
                                                                                                     suggests  that
pressure  correlates  more   with  IPD  compared      to PTT.
the blood pressure correlates more with IPD compared to PTT.

      Figure 5. Relationships
                 Relationshipsbetween
                                betweensystolic
                                           systolicblood
                                                     blood pressure
                                                         pressure   and
                                                                  and   PTT/IPD,
                                                                      PTT/IPD, (a) (a) systolic
                                                                                    systolic    blood
                                                                                             blood     pressure
                                                                                                   pressure and
      IPD,IPD,
      and  (b) correlation coefficient
                (b) correlation        of systolic
                                coefficient         blood
                                            of systolic   pressure
                                                        blood      withwith
                                                              pressure PTT/IPD.
                                                                            PTT/IPD.

3.2. BP Estimation Model
3.2. BP Estimation Model
      Table 1 shows the mean error (ME) and standard deviation (STD) calculated using the
      Table 1 shows the mean error (ME) and standard deviation (STD) calculated using the results of
results of the BP estimation model created using ANN and the BP results measured with a
the BP estimation model created using ANN and the BP results measured with a commercial
commercial cuff-based blood pressure monitor. In this table, the ME and STD values are evaluated
cuff-based blood pressure monitor. In this table, the ME and STD values are evaluated according to
according to the American National Standards Institute/Association for the Advancement of Medical
the American National Standards Institute/Association for the Advancement of Medical
Instrumentation/International Organization for Standardization (ANSI/AAMI/ISO) 2013 protocol
Instrumentation/International Organization for Standardization (ANSI/AAMI/ISO) 2013 protocol
(ME < 5 mmHg, STD < 8 mmHg) [21]. As shown in Table 1, the mean deviations of the systolic and
(ME < 5 mmHg, STD < 8 mmHg) [21]. As shown in Table 1, the mean deviations of the systolic and
diastolic blood pressures are 0.01 mmHg and 0.05 mmHg respectively, and the standard deviations are
diastolic blood pressures are 0.01 mmHg and 0.05 mmHg respectively, and the standard deviations
6.7 mmHg and 5.8 mmHg respectively, which are within the recommended criteria. These values were
are 6.7 mmHg and 5.8 mmHg respectively, which are within the recommended criteria. These values
also within the recommended criteria when the BP estimation model was created with PTT as input
were also within the recommended criteria when the BP estimation model was created with PTT as
values. However, the BP estimation model that used IPD as input values showed a higher accuracy for
input values. However, the BP estimation model that used IPD as input values showed a higher
the systolic blood pressure, whereas for the diastolic pressure, the model created using PTT obtained
accuracy for the systolic blood pressure, whereas for the diastolic pressure, the model created using
from two BCGs showed a higher accuracy. Figure 6 shows the Bland-Altman plot and the regression
PTT obtained from two BCGs showed a higher accuracy. Figure 6 shows the Bland-Altman plot and
plot of the estimation model using IPD, which display high accuracy.
the regression plot of the estimation model using IPD, which display high accuracy.
      Table 1. Mean error (ME) and standard deviation (STD) values of systolic and diastolic blood pressures
          Table 1. Mean error (ME) and standard deviation (STD) values of systolic and diastolic blood
      estimated via pulse transit time (PTT) and instantaneous phase difference (IPD).
           pressures estimated via pulse transit time (PTT) and instantaneous phase difference (IPD).
                                                    Systolic                 Diastolic
                                                   Systolic         Diastolic
                                            ME          STD       ME        STD
                                                 ME       STD     ME       STD
                          PTT (PPG-BCG1)   0.9805      7.6471   −0.1467    5.5148
                           PTT
                         PTT     (PPG-BCG1)−0.7616
                             (BCG1-BCG2)       0.9805 7.5696
                                                         7.6471 −0.1467
                                                                0.0341    5.5148
                                                                           4.0625
                                IPD
                          PTT (BCG1-BCG2)  0.0123
                                               −0.7616 6.7452
                                                         7.5696 0.0532     5.8317
                                                                 0.0341 4.0625
                                   IPD         0.0123 6.7452 0.0532 5.8317
Sensors 2019, 19, 595 7 of 9
Sensors 2018, 16, x 7 of 4
Figure 6. Bland–Altman
Figure 6. Bland–Altman plot
plot and
and regression
regression plot
plot in
in systolic
systolic and
and diastolic
diastolic periods.
periods.
4. Discussion and Conclusions
4. Discussion and Conclusions
In this study, a chair-type system that can measure blood pressure in a nonintrusive manner
In this study, a chair-type system that can measure blood pressure in a nonintrusive manner
using PVDF films and two BCG sensors was developed. While chair-type blood pressure monitoring
using PVDF films and two BCG sensors was developed. While chair-type blood pressure
systems have been developed in the past [14,15], most of them had low utility because they require
monitoring systems have been developed in the past [14,15], most of them had low utility because
users to be conscious during measurement. However, the system developed in this study can measure
they require users to be conscious during measurement. However, the system developed in this
blood pressure even if the user simply sits on a chair via BCG sensors installed on the back and seat
study can measure blood pressure even if the user simply sits on a chair via BCG sensors installed
plates, thus improving convenience. BCG signals have a limitation toward increasing the accuracy of
on the back and seat plates, thus improving convenience. BCG signals have a limitation toward
blood pressure estimation because they are mixed with various noises, and hence cannot accurately
increasing the accuracy of blood pressure estimation because they are mixed with various noises,
detect peak positions and often fail to capture the PTT. However, the system proposed in this study
and hence cannot accurately detect peak positions and often fail to capture the PTT. However, the
could accurately estimate blood pressure (as shown in Table 1) even if it did not capture the location
system proposed in this study could accurately estimate blood pressure (as shown in Table 1) even
of the peak because it uses IPD, which is highly correlated with blood pressure as shown in Figure 4.
if it did not capture the location of the peak because it uses IPD, which is highly correlated with
The system developed in this study also has certain limitations. The number of test subjects is smaller
blood pressure as shown in Figure 4. The system developed in this study also has certain limitations.
than the number of subjects (a minimum of 85) recommended for evaluating blood pressure monitors
The number of test subjects is smaller than the number of subjects (a minimum of 85) recommended
by the AAMI, and the accuracy for detection of hypertension and hypotension is sometimes low.
for evaluating blood pressure monitors by the AAMI, and the accuracy for detection of
This may likely be due to the small sample size, which leads to the belief that the performance can be
hypertension and hypotension is sometimes low. This may likely be due to the small sample size,
improved if more data are collected.
which leads to the belief that the performance can be improved if more data are collected.
The experimental results of this study showed the possibility of a nonintrusive/unrestricted
The experimental results of this study showed the possibility of a nonintrusive/unrestricted
blood pressure estimation system, which utilizes IPD. This system can continuously monitor blood
blood pressure estimation system, which utilizes IPD. This system can continuously monitor blood
pressure in a nonintrusive manner while the user is simply sitting on a chair. Since this study only
pressure in a nonintrusive manner while the user is simply sitting on a chair. Since this study only
estimated blood pressure in a state of rest, further research is needed in the future to determine whether
estimated blood pressure in a state of rest, further research is needed in the future to determine
the proposed system can accurately measure blood pressure for varying situations, such as a blood
whether the proposed system can accurately measure blood pressure for varying situations, such as
pressure that has returned to a normal level after having been increased during exercise. It should also
a blood pressure that has returned to a normal level after having been increased during exercise. It
be verified for applicability to use for both home and hospital living.
should also be verified for applicability to use for both home and hospital living.
Author Contributions:
Acknowledgments: K.J.L.
This drafted
study the manuscript,
has been conducted withdeveloped the source
the support of thecode, andInstitute
Korea processed the ECG,
of Industrial
PPG, and BCG data. D.C. configured the hardware for our system. J.R. and J.H. designed and configured the
Technology (KITECH JA-19-0010) and the Gyeongi-Do Technology Development Program (KITECH
experimental protocol and hardware for the chair. S.K. supervised the entire research process and revised the
IZ-19-0030) as “Development of smart textronic products based on electronic fibers and textiles”.Sensors 2019, 19, 595 8 of 9
manuscript. All authors contributed to the research design, interpretation of results, and proofreading of the
final manuscript.
Acknowledgments: This study has been conducted with the support of the Korea Institute of Industrial
Technology (KITECH JA-19-0010) and the Gyeongi-Do Technology Development Program (KITECH IZ-19-0030)
as “Development of smart textronic products based on electronic fibers and textiles”.
Conflicts of Interest: The authors declare no conflict of interest.
Abbreviations
The following abbreviations are used in this manuscript:
WHO World Health Organization
PTT Pulse Transit Time
ECG Electrocardiogram
PPG Photoplethysmogram
BCG Ballistocardiogram
PVDF Polyvinylidene fluoride resin
ANN Artificial Neural Network
EMD Empirical mode decomposition
IMF Intrinsic mode function
IPD Instantaneous phase difference
ME Mean error
STD Standard deviation
ANSI American National Standards Institute
AAMI Association for the Advancement of Medical Instrumentation
ISO International Organization for Standardization
References
1. World Health Organization. World Health Statistic 2015; World Health Organization: Geneva,
Switzerland, 2015.
2. World Health Organization. A Global Brief on Hypertension, Silent Killer, Global Public Health Crisis; World
Health Organization: Geneva, Switzerland, 2014.
3. Peter, L.; Noury, N.; Cerny, M. A review of methods for non-invasive and continuous blood pressure
monitoring: Pulse transit time method is promising. IRBM 2014, 35, 271–282. [CrossRef]
4. Ahmad, S.; Chen, S.; Soueidan, K.; Batkin, I.; Bolic, M.; Dajani, H.; Groza, V. Electrocardiogram-assisted
blood pressure estimation. IEEE Trans. Biomed. Eng. 2012, 59, 608–618. [CrossRef] [PubMed]
5. Mukkamala, R.; Hahn, J.O.; Inan, O.T.; Mestha, L.K.; Kim, C.S.; Toreyin, H.; Kyal, S. Toward ubiquitous
blood pressure monitoring via pulse transit time: Theory and practices. IEEE Trans. Biomed. Eng. 2015, 62,
1879–1901. [CrossRef] [PubMed]
6. Poon, C.; Zhang, Y. Cuff-less and noninvasive measurements of arterial blood pressure by pulse transit
time. In Proceedings of the 27th Annual International Conference of the IEEE Engineering in Medicine and
Biology Society (EMBC), Shanghai, China, 17–18 January 2006; pp. 5877–5880.
7. Kumar, N.; Agrawal, A.; Deb, S. Cuffless BP measurement using a correlation study of pulse transient time
and heart rate. In Proceedings of the International Conference on Advances in Computing, Communications
and Informatics (ICACCI), New Delhi, India, 24–27 September 2014; pp. 1538–1541.
8. Ding, X.; Yan, B.P.; Zhang, Y.; Liu, J.; Zhao, N.; Tsang, H.K. Pulse Transit Time Based Continuous Cuffless
Blood Pressure Estimation: A New Extension and A Comprehensive Evaluation. Sci. Rep. 2107, 7, 11554.
[CrossRef] [PubMed]
9. Kachuee, M.; Kinani, M.M.; Mohammadzade, H.; Shabany, M. Cuff-less Blood Pressure Estimation
Algorithms for Contentious Health-care Monitoring. IEEE Trans. Biomed. Eng. 2017, 64, 859–869. [CrossRef]
[PubMed]
10. Su, P.; Ding, X.; Zhang, Y.; Liu, J.; Miao, F.; Zhao, N. Long-term blood pressure prediction with deep recurrent
neural networks. In Proceedings of the IEEE EMBS International Conference on Biomedical & Health
Informatics (BHI), Las Vegas, NV, USA, 4–7 March 2018; pp. 323–328.Sensors 2019, 19, 595 9 of 9
11. Kranjec, J.; Beguš, S.; Drnovšek, J.; Geršak, G. Novel Methods for Noncontact Heart Rate Measurement:
A Feasibility Study. IEEE Trans. Instrum. Meas. 2014, 63, 838–847. [CrossRef]
12. Shu, Y.; Li, C.; Wang, Z.; Mi, W.; Li, Y.; Ren, T. A Pressure Sensing System for Heart Rate Monitoring
with Polymer-Based Pressure Sensors and an Anti-Interference Post Processing Circuit. Sensors 2015, 15,
3224–3235. [CrossRef] [PubMed]
13. Liu, M.; Jiang, F.; Jiang, H.; Ye, S.; Chen, H. Low-power, noninvasive measurement system for wearable
ballistocardiography in sitting and standing positions. Comput. Ind. 2017, 91, 24–32. [CrossRef]
14. Kim, C.; Carek, A.M.; Mukkmala, R.; Inan, O.T.; Hahn, J. Ballistocardiogram as Proximal Timing Reference for
Pulse Transit Time Measurement: Potential for Cuffless Blood Pressure Monitoring. IEEE Trans. Biomed. Eng.
2014, 62, 2657–2664. [CrossRef] [PubMed]
15. Tang, Z.; Tamura, T.; Sekine, M.; Huang, M.; Chen, W.; Yoshida, M.; Sakatani, K.; Kobayashi, H.; Kanaya, S.
A Chair-based Unobtrusive Cuffless Blood Pressure Monitoring System Based on Pulse Arrival Time. IEEE J.
Biomed. Health Inform. 2017, 21, 1194–1205. [CrossRef] [PubMed]
16. Sadek, I. Ballistocardiogram Signal Processing: A Literature Review. arXiv 2018, arXiv:1807.00951.
17. Huang, N.E.; Shen, Z.; Long, S.R.; Wu, M.C.; Shih, H.H.; Zheng, Q.; Liu, H.H. The empirical mode
decomposition and the Hilbert spectrum for nonlinear and non-stationary time series analysis. Proc. R. Soc.
Lond. A Math. Phys. Eng. Sci. 1998, 454, 903–995. [CrossRef]
18. Sugita, N.; Obara, K.; Yoshizawa, M.; Abe, M.; Tanaka, A.; Homma, N. Techniques for estimating blood
pressure variation using video images. Conf. Proc. IEEE Eng. Med. Biol. Soc. 2015, 2015, 4218–4221. [PubMed]
19. Rapalis, A.; Janušauskas, A.; Marozas, V.; Lukoševičius, A. Estimation of blood pressure variability during
orthostatic test using instantaneous photoplethysmogram frequency and pulse arrival time. Biomed. Signal
Process. Control 2017, 32, 82–89. [CrossRef]
20. Shin, H.S.; Lee, C.; Lee, M. Adaptive threshold method for the peak detection of photoplethysmographic
waveform. Comput. Biol. Med. 2009, 39, 1145–1152. [CrossRef] [PubMed]
21. Association for the Advancement of the Medical Instrumentation. American National Standard for Electronic or
Automated Sphygmomanometers; ANSI/AAMI SP 10 2201; AAMI: Arlington, VA, USA, 2002.
© 2019 by the authors. Licensee MDPI, Basel, Switzerland. This article is an open access
article distributed under the terms and conditions of the Creative Commons Attribution
(CC BY) license (http://creativecommons.org/licenses/by/4.0/).You can also read