A challenging year successfully managed - Roadshow presentation - Covestro

Page created by Reginald Andrews
 
CONTINUE READING
A challenging year successfully managed - Roadshow presentation - Covestro
A challenging year
successfully managed
Roadshow presentation

covestro.com    FY 2020 │ IR Roadshow Presentation
A challenging year successfully managed - Roadshow presentation - Covestro
Covestro investment highlights

        Group financials 2020

        Segment overview

        Acquisition DSM-RFM

        Background information

covestro.com      FY 2020 │ IR Roadshow Presentation   1
A challenging year successfully managed - Roadshow presentation - Covestro
Covestro is diversified across geographies and end-markets
Key performance indicators and sales split

       €11bn                                   2%                                     €0.5bn                                         7%                                             €1.5bn
    Sales                                 Core volume growth                     FOCF                                           ROCE                                           EBITDA
    2020                                  CAGR 2015 - 2020                       2020                                           2020                                           2020

    2020 sales
                                                                Sports / Leisure,                                    Auto &
      Polycarbonates                           Polyurethanes   Cosmetics, Health,                                   Transport
                                                                                                                                                       APAC                                        EMLA
      (PCS)                                    (PUR)           diverse industries                           19%
                   28%                                                                28%
                                                                                                                                                                32%
                                                                                                                                                                                               43%
                                           47%
                                                                                                                   16% Furniture &
                                                                                    7%                                   Wood
                                                                        Chemicals
     Coatings,     19%
     Adhesives,                                                                           13%
                            6%                                                                           16%                                                             25%
     Specialties                                                                                                  Construction
     (CAS)                                                                        Electro                                                                   NAFTA
                           Other

2                   FY 2020 │ IR Roadshow Presentation         Notes:      Based on Covestro Annual Report 2020; EMLA = Europe, Middle East Africa, Latin America; NAFTA = USA, Canada, Mexico; APAC = Asia-Pacific
                                                                           Numbers rounded
                                                                           Sales split by industry for your convenience only; shown numbers are approximations on full year basis
A challenging year successfully managed - Roadshow presentation - Covestro
Covestro is a global leader across its entire portfolio
World-wide industry positions and production capacities

                                                           #1 in Polyurethanes                                                      #1 in Polycarbonates                          #1 in Coatings, Adhesives & Specialties

                                                                                                                                                                                     Aliphatic                    Polyurethane
                                   MDI                                TDI                       Polyether polyols                                 PC                               isocyanates                     dispersions
    Capacity share in 2020(a)

                                Others                                                                                                                                               Others
                                 11%                        Others                                                                                                                    14%
                                                                                                                                     Others
                                                             23%                               Others                                                                                                                        15%
                                                                               24%                                                    28%                 26%
                                                                                                59%                                                                                                 47%
                                                                                                                     10%                                                                                     Others
                                                                                                                                                                                                              59%

                                  19%

                                Top 5: 89%                      Top 5: 77%                         Top 5: 41%                              Top 5: 72%                              Top 5: 86%                         Top 5: 41%
                                                    2025e: Top 5 shares expected                                                    2025e: Top 5 shares                                       2025e: Industry structures
                                                      to remain broadly stable                                                      expected to decrease                                      expected to remain stable

                                                                                                                                                                           Entry requirements
                                Global #3                    Joint global #1                        Global #2                               Global #1
    Covestro(a)

                                                                                                                                                                           • Economies of scope
                                                                                                                                                                           • Formulation and application know-how
                                 1,670kt                             790kt                              1,420kt                               1,600kt
                                                                                                                                                                           • Close customer relationships and long-term
                                                                                                                                                                             R&D collaborations
                                  6 sites                            3 sites                            9 sites                                5 sites
                                                                                                                                                                           • Operation of global business platform

3                                   FY 2020 │ IR Roadshow Presentation               Notes:     (a) Covestro position based on total nameplate capacity at year end 2020 relative to competitors
                                                                                     Source:    Covestro estimates
A challenging year successfully managed - Roadshow presentation - Covestro
Our new strategy – setting the path for tomorrow

    BECOME THE BEST                                     DRIVE SUSTAINABLE                                                                BECOME FULLY
    OF WHO WE ARE                                       GROWTH                                                                           CIRCULAR
    Transform the company                               Address sustainability                                                           Accelerate the transition
    to exploit its full potential                       in a profitable way                                                              to a fossil-free economy
                                                                 ADVANCE DIGITALIZATION

                                                                EXPAND ‘WE ARE 1’ CULTURE

        MILESTONE 2020                                          MILESTONE 2020                                                                 MILESTONE 2020
    !   LEAP transformation initiated                    !      Acquisition of RFM(a) announced                                          !     First alternative feedstock sourced

4                  FY 2020 │ IR Roadshow Presentation   Note:     (a) Announced acquisition of DSM’s Resins and Functional Material (RFM) business subject to regulatory approval
A challenging year successfully managed - Roadshow presentation - Covestro
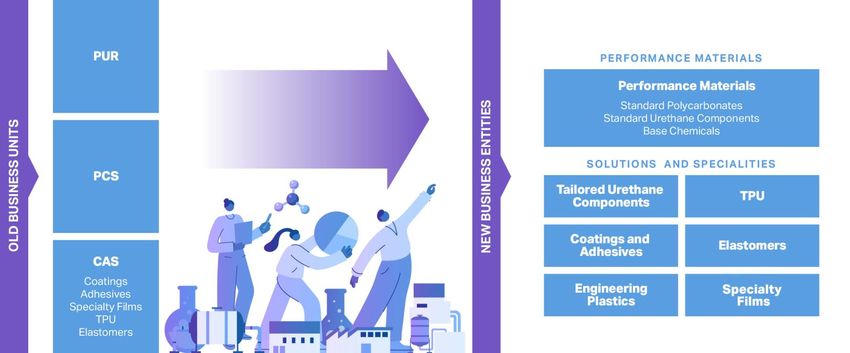
Accelerate the transition to a fossil-free economy
We will be fully circular

ALTERNATIVE RAW MATERIALS INNOVATIVE RECYCLING                                             RENEWABLE ENERGIES                        JOINT SOLUTIONS

Replacing fossil resources                     Energy-efficient technologies               Wind energy                               Cross-industry collaboration
Example Bio-based car top coat                 Example Recycled polycarbonates             Example Ørsted wind energy supply         Example PUReSmart consortium

▪ Enabling customers to optimize the           ▪ New polycarbonate grades from post-       ▪ World‘s largest corporate supply        ▪ PUReSmart to seek ways of
  CO2 footprint of their products                consumer recycled (PCR) content,            contract for offshore wind energy         transition from current linear lifecycle
▪ New hardener for automotive                    e.g. water bottles, CDs and auto-           entered with Ørsted in Dec. 2019          of polyurethane (PU) products to a
  coatings with carbon basis up to               motive lighting                           ▪ Starting in 2025, Ørsted to provide       circular economy model
  70% from renewable raw materials             ▪ Closed loop recycling system to             100 MW of electricity for 10 years      ▪ Consortium as an end-to-end
▪ No compromises with regards to                 collect, sort, shred and clean material   ▪ Newly built wind farm in North Sea,       collaboration spanning the entire PU
  protective functions and appearance          ▪ Recycled granules are finally               implemented without public funding        reprocessing value chain
▪ Collaboration with automotive group            compounded with virgin resins             ▪ Supply to cover c. 10% of electricity   ▪ Nine partners from six different
  Audi and the coating experts at              ▪ PCR grades are used in various              consumed by Covestro in Germany           countries, coordinated by the
  BASF Coatings                                  electr. applications for a second life                                                Belgian company Recticel

5                FY 2020 │ IR Roadshow Presentation
A challenging year successfully managed - Roadshow presentation - Covestro
Becoming more customer-centric
Transformation program LEAP in 2021-2023

LEAP                                                                                                                   HIGHLIGHTS

    “
                                                                                                                         • Comprehensive redesign of structures

                                                         ”
                                                                                                                           and processes as well as manage-
       Become the best of who we are                                                                                       ment and governance mechanisms
                                                                                                                         • By July 2021, new organizational set-
                                                                                                                           up to be implemented
                                                                                                                         • Bundle entities based on business
                                                                                     Thermoplastic                         specifics and customer needs while
                                                                                     Polyurethanes                         fostering entrepreneurship:
                                                         Coatings and                                                      ̶ Solutions and specialties
                                                          Adhesives                                                           differentiated chemical products and
                                                                                                                              application technology services, with
                                                                                                                              focus on innovation and customer
                                                                                                                              interaction
                                                                                                                            ̶ Performance materials
                                                                                                                              focus on reliable supply of standard
                                                                                                                              products at competitive market
                                                                                                                              prices with lowest internal costs

6          FY 2020 │ IR Roadshow Presentation   Notes:   TPU = Thermoplastic Polyurethanes
                                                         Shown future entities and structures do not necessarily reflect segmentation of future financial reporting
A challenging year successfully managed - Roadshow presentation - Covestro
Keeping fixed costs flat
Transformation program LEAP in 2021-2023

FIXED COST DEVELOPMENT Y/Y EXCLUDING INCENTIVE SCHEMES                                                                          HIGHLIGHTS
in € million                                                                                                                      • Savings target: maintain fixed costs
                                                                                                                                    unchanged until 2023, excluding STI
                                   402                                                                                              and LTI schemes, based on FY 2020
                                                                                                                                  • Historical savings initiatives
                                                                                                                                    ̶ ‘PEP’ initiated during IPO in 2015
                                                                                                                                     ̶ ‘Perspective’ initiated end of 2018
                                                                     100 to
                                                                      200
                                                                                                                                      ̶ ‘Short-term savings’ in 2020
                                                                                                                                  • Investments into growth in 2018
                                                                                                                                  • Cost in 2021e mainly driven by higher
       27          5                                                                                                                maintenance costs, merit increase,
                                                                                                                                    investments in digitalization and
                                                    -45                                                                             circularity
                                                                                                                                  • LEAP cost savings to be realized in
                                                           -150                         -100 to
                                                                                                                                    2022e and 2023e
                                                                                         -200                                     • Counterbalancing fix costs inflation,
                                                                                                                                    like merit increases, until 2024
     2016       2017              2018              2019   2020      2021e            2022e -
                                                                                       2023e

7              FY 2020 │ IR Roadshow Presentation            Note:   Fixed cost development calculated as ‘Other items’ (Y/Y) from EBITDA bridge, corrected by Y/Y changes in STI & LTI
                                                                     STI = Short-term incentive; LTI = Long-term incentive
A challenging year successfully managed - Roadshow presentation - Covestro
Headcount reduced by 700 FTE, further reductions planned
Development of full-time equivalent (FTE)

             SG&A(a)                           PRODUCTION                               TOTAL                               HIGHLIGHTS

                                                                                          -4.1%        17,900                 • Year end 2020 FTE reduced by 700 to ~16,500
                                                                                                                                beyond original target of 16,800 through execution
                                                                                     17,201            RFM(C)                   of Perspective program
                                                                            16,770
                                                                                              16,501
                                                                                                       16,100
                                                                                                                              • Plan to further reduce by ~400 to ~16,100 FTE
                                                                                                                                until year end 2021
                                                11,162              (C)
                                       10,479            10,753 RFM                                                           • Announced RFM acquisition to add ~1,800 FTE to
                                                                                                                                total headcount in 2021e

    5,168
            4,822 4,543
                        RFM(C)

    2018 2019 2020 2021e                 2018 2019 2020 2021e                 2018 2019 2020 2021e

8                  FY 2020 │ IR Roadshow Presentation                     Note:       (a) SG&A = Marketing and general administration
                                                                                      (b) Total = SG&A + Production + R&D
                                                                                      (c) Indicative illustration only
A challenging year successfully managed - Roadshow presentation - Covestro
ESG ambitions support growth strategy
Covestro non-financial targets for 2025

       80% of project expenditures for R&D go toward areas that contribute to UN SDGs
       Achievement: 51% of R&D project expenditures in 2020

       100% of our suppliers comply with our sustainability requirements
       Achievement: 79% by end of 2020

       Reduce specific greenhouse gas emissions by 50% from the benchmark in 2005
       Achievement: -46.2% by end of 2020

       Ten million people in underserved markets benefit from our solutions
       Achievement: 1.1 million people by end of 2020

       Extract the maximum benefit from carbon and increase carbon productivity
       Achievement: Company vision to become fully circular announced in 2020, corporate goal setting under way

9           FY 2020 │ IR Roadshow Presentation   Notes:   ESG = Environmental, Social, Governance
                                                          Covestro non-financial targets established in 2016
                                                          See 2020 Combined Management Report for further details
Covestro innovative products tap into attractive new markets
Structural growth drivers

UN SDGs(a)                                                                      NEEDS                                             SAMPLE APPLICATIONS                               DEMAND OUTLOOK
                                                                                                                                                                                   Core volume growth
 related to climate change:
                                                                                  • Alternative energy sources                      • Energy consumption
                                                                                                                                       CAGR: ~3%1
                                                                                  • Zero emission concepts
                                                                                                                                    • Offshore wind energy
                                                                                  • Low-energy buildings                               CAGR: ~19.5%2
                                                                                                                                                                                        Polyurethanes

                                                                                                                                                                                         ~5% CAGR
                                                                                                                                                                                             2020-2025
 related to increasing mobility:
                                                                                  • Energy-efficient mobility                       • Global car production
                                                                                                                                       CAGR: ~1.2%3
                                                                                  • E-mobility
                                                                                                                                    • Global hybrid & EV prod.
                                                                                  • Autonomous driving                                 CAGR: ~35%4
                                                                                                                                                                                        Polycarbonates

                                                                                                                                                                                         ~5%      CAGR
                                                                                                                                                                                                  2020-2025
 related to growing population and prosperity:
                                                                                  • Sustainable fashion                             • Textile coating market
                                                                                                                                       CAGR: ~2.2%5
                                                                                  • Food preservation                                                                                    Coatings, Adhesives,
                                                                                                                                    • Covestro relevant market
                                                                                  • Medical applications                               CAGR: ~3.6%5                                      Specialties(c)
                                                                                                                                                                                          ~4%     CAGR
                                                                                                                                                                                                  2020-2025
 related to increasing urbanization:
                                                                                  • Energy-efficient lighting                       • Luminaire market
                                                                                                                                       CAGR: ~3%6
                                                                                  • Affordable housing
                                                                                                                                    • Luminaire LED
                                                                                  • Public infrastructure                              CAGR: ~12%7                                 Covestro industry demand outlook assumes
                                                                                                                                                                                   global GDP CAGR of 3 - 4% in 2020 - 2025e

                                                        Notes:   (a) Most impacted goals out of 17 Sustainable Development Goals, set by the United Nations’ “2030 Agenda for Sustainable Development”
                                                                  1) Covestro estimates for 2020-2025, based on BP, Energy Outlook, 2017 for 2015-2020 based on million tons oil equivalent
10                 FY 2020 │ IR Roadshow Presentation             2) GWEC, Global Wind Executive Council: Annual-Wind-Report 2019 for 2020-2025
                                                                  3) LMC, Aug 2020, for years 2019-2023; 4) LMC, Aug 2020, for years 2018-2023; 5) Covestro estimates for 2019-2023; 6) Covestro estimates for 2020-2025;
                                                                  7) Covestro estimates based on LEDinside report H2 Y2020 (CAGR 2018-24) and Global Luminaires and Lighting Market Analysis and Forecast 2016, PennWell for 2015-2022
Leading cost positions across business segments and regions
Covestro cash cost positions

         NORTH AMERICA                                                    EUROPE                                                                                                           ASIA                                                                 HIGHLIGHTS
         Cash cost                                                        Cash cost                                                                                                        Cash cost
                                                                                                                                                                                                                                                                • Covestro MDI is one of the
                                                                                                                                                                                                                                                                  low-cost producers.
                                                                                                                                                                                                                                                                  Investment in Tarragona
MDI(a)

                                                                                                                                                                                                                                                                  plant will significantly further

                                                                                                                                                                                               leader

                                                                                                                                                                                                                                                       China)
                                                                                                                                                                                              Chinese

                                                                                                                                                                                                                     Chinese
                                                                                                                                                                                                                     laggard

                                                                                                                                                                                                                                                      (landed
                                               North
                                           American
                                            follower

                                                                 North
                                                              American
                                                               laggard

                                                                                                              Tarragona

                                                                                                                                                                                                                                                    ME player
                                                                                leader

                                                                                              Covestro
                                                                                             Uerdingen

                                                                                                               Covestro

                                                                                                                                                                                                                                        Asian
                                                                                                                                                                                                                                      laggard
                                                                             European

                                                                                                                                         Covestro

                                                                                                                                                          European
                                                                                                                                                            laggard

                                                                                                                                                                               ME player
                                                                                                                                                                            (landed WE)
               Covestro
               Baytown

                                                                                                                                                                                                         Covestro
                                                                                                                                                                                                          Caojing
                                                                                                                                      Brunsbuettel
                                                                                                                                                                                                                                                                  improve cost position. MDI
                                                                                                                                                                                                                                                                  industry with cost advantage
                                                                                                                                                                                                                                                                  of ~35% between the best
                                                                                                                                                                                                                                                                  and the average 5 least
                                                                                                                                                                                                                                                                  competitive plants
                                                                                                                                                                                                                                                                • Covestro TDI is the global
TDI(a)

                                                                                                                                                                                                                                                                  cost leader with cost

                                                                                                                                                                                                          leader
                                                                                                                                                                                                         Chinese

                                                                                                                                                                                                                      (landed
                                                                                                                                                                                                                       China)

                                                                                                                                                                                                                                      Chinese
                                                                                                                                                                                                                                      laggard
                                                           North

                                                                                                                                                                                                                    ME player

                                                                                                                                                                                                                                                       Asian
                                                                                                                                                                                                                                                     laggard
                                                       American
                                                        follower

                                                                                  Covestro
                                                                                 Dormagen

                                                                                                                                                                         ME player
                                                                                                                                                                      (landed WE)
                                                                                                          European

                                                                                                                                            European
                                                                                                                                              laggard
                          Covestro
                          Baytown

                                                                                                                                                                                              Covestro
                                                                                                                                                                                               Caojing
                                                                                                           follower
                                                                                                                                                                                                                                                                  advantage of ~55% versus
                                                                                                                                                                                                                                                                  the average of 5 least
                                                                                                                                                                                                                                                                  competitive plants
                                                                                                                                                                                                                                                                • Covestro Polycarbonates
                                                                                                                                                                                                                                                                  is one of the two joint cost
PC(b)

                                                                                                                                                                                                                                                                  leaders with cost advantage
                                                                                                   Covestro
                                                                                                  Uerdingen

                                                                                                                                                                                                                                                       Asian
                                                                                                                                                                                                                                                     laggard
                                                                                                                                                                                                                     (landed China)
                                                                                                                          European
                                                                                                                           follower

                                                                                                                                                                         European
                                                                                                                                                                           laggard
                                                                                 ME player
                                                                              (landed WE)

                                                                                                                                                                                                                          ME player
                                                                                                                                                      Covestro
                                                                                                                                                     Antwerpen

                                                                                                                                                                                              Covestro
                                                                                                                                                                                               Caojing

                                                                                                                                                                                                           Asian
                                                                                                                                                                                                         follower

                                                                                                                                                                                                                                         Covestro
                                                                                                                                                                                                                                      Map Ta Phut
                                                       Covestro
                                                       Baytown
                       North

                      leader
                    American

                                                                                                                                                                                                                                                                  of ~25% versus the average
                                                                                                                                                                                                                                                                  of 5 least competitive plants

              Cash cost improvements based on investment projects

11                                   FY 2020 │ IR Roadshow Presentation                         Notes:                    (a) Cost of production based on total raw material costs less co-product credits, variable and fixed conversion costs at 100% utilization based
                                                                                                                              on nameplate capacity for FY 2019
                                                                                                                          (b) FY 2019 Cash cost ex gate, 82% utilization rate for all plants based on nameplate capacity; integrated players are shown without contribution
                                                                                                                              margins for BPA, phenol, acetone etc.
Approaching mid-cycle level in 2021
EBITDA development between 2014 and 2021e

in € billion                                                                                                 HIGHLIGHTS
                                             3.4                                                              Historic development
                                                       3.2                                                    • Cyclicality driven by supply-demand balance
                                                                                       M2M ~2.7               • 2017 peak due to very high industry utilization
                                                                                                              • 2020 burdened by globally declining GDP

                             2.0                                                                              EBITDA guidance of €1,700m – 2,200m in FY 2021
                                                                                                   1.7 –      • Includes announced RFM acquisition
               1.6
                                                                1.6                                 2.2       • Mark-to-market (M2M) EBITDA in FY 2021 of
                                                                           1.5
                                                                                                                ~€2.7bn based on January 2021
      1.2
                                                                                                              EBITDA sensitivities for FY 2021
                                                                                                              • Volume sensitivity: 1pp change in core volumes equals
                                                                                                                around +/- €60m, excluding RFM
                                                                                                              • FX sensitivity: 1pp change equals +/- €6m for
                                                                                                                CNY/EUR and +/- €4m for USD/EUR
     2014(a)   2015(a)        2016          2017      2018   2019        2020           2021e
                                                                                       Guidance

                     Implied mid-cycle EBITDA trend line (without RFM)

12               FY 2020 │ IR Roadshow Presentation             Note:    (a) EBITDA before one-time items in 2014 and 2015
                                                                         Basic assumptions FY 2021: Exchange rate of EUR/USD ~1.20 and a global GDP growth of 4-5% Y/Y
2021 expected above pre-pandemic level of 2019
FY 2021 guidance including announced RFM acquisition

                                                                    FY 2019                                        FY 2020                              Guidance FY 2021e

 Core volume growth                                                  +2.0%                                           -5.6%                         10 – 15% (t/o ~6%p RFM)

 FOCF                                                                €473m                                          €530m                                  €900m – 1,400m

 ROCE                                                                 8.4%                                            7.0%                                        7 – 12%

 Additional financial expectations

 EBITDA FY                                                           €1,604                                        €1,472m                               €1,700m – 2,200m

 EBITDA Q1                                                           €442m                                          €254m                                    €700m – 780m

 D&A                                                                 €752m                                          €776m                                         ~€900m

 Financial result                                                    €-91m                                           €-91m                                        ~€-100m

 P&L (effective) tax rate                                            26.8%                                           25.0%                                       24 – 26%

 Capex(a)                                                            €910m                                          €704m                                         ~€800m

 Average number of outstanding shares (in million)                    182.7                                          184.9                                          193.2

                                                     Note:   (a) Cash-relevant capex
13              FY 2020 │ IR Roadshow Presentation           Basic assumptions FY 2021: Exchange rate of EUR/USD ~1.20 and a global GDP growth of 4-5% Y/Y
                                                             One-time costs that could arise in conjunction with the LEAP transformation program have not been considered
Majority of cash allocated to growth
Balanced use of cash

     CAPEX                                          DIVIDEND                                PORTFOLIO                                      SHARE
                                                                                                                                           CAPITAL

                                                                       €
                                                                                                                                                                   €
     • Covestro’s industry and cost                • New policy: 35-55% payout              • Targeting value-enhancing                   • Capital increase of €447m
       leadership make growth                        of net income                            acquisitions with attractive                  executed in 2020 in context
       investment the most value-                  • 2020 dividend of €1.30 per               IRR                                           of announced RFM
       creating use of cash                          share proposed to upcoming             • Announced acquisition of                      acquisition
     • Maintenance capex to                          AGM                                      DSM’s Resins and                            • Share buy-back of €1.5bn
       secure safe, reliable and                   • Dividend yield 2020 of                   Functional Material (RFM)                     executed in 2017-2018
       efficient operations                          2.6%(a)                                  business for EV €1.55bn                     • Authorization for share buy-
                                                                                              with attractive high margins                  back program for up to 10%
                                                                                              (~€1.0bn sales)                               of share capital in place,
                                                                                            • Less attractive low-margin                    to be used in an
                                                                                              businesses divested                           opportunistic and anti-
                                                                                              (~€0.6bn sales)                               cyclical way
        €3.2bn invested in capex                         €1.5bn dividends                         €1.5bn net investments                   €1.1bn share capital reduced

14                 FY 2020 │ IR Roadshow Presentation              Note:    (a) Based on share price of €50.48 at year end 2020   Sum of FY 2016 to FY 2020
Investment into organic growth to deliver attractive returns
Covestro capex development

CAPEX(a)                                                                                                                HIGHLIGHTS
in € million

                                                                                                                         Future capex
                                                                                                                         • FY 2021e includes announced RFM acquisition
                                                                910                                                      • Single largest capex project Tarragona Chlorine
                                                                                              ~800                         (~€0.2bn)
                                                         707                  704                                        • Almost 100 projects with capex of more than
                                                                                                                           €10m, with spending spread over several years
                                     518
      509                                                                                                                Maintenance capex at ~€350-400m p.a.
                     419
                                                                                                                         • Securing safe, reliable and efficient operations
                                                                                                                         • Including announced RFM acquisition

     2015          2016            2017             2018       2019           2020            2021e

               Maintenance capex              Growth capex

15                  FY 2020 │ IR Roadshow Presentation                Note:     (a) Cash-relevant capex, prior to initial application of updated accounting standard IFRS 16 Leases, effective January 1, 2019
New dividend policy: 35-55% payout ratio of net income
Historical dividend development

in € million                                                                                                                   HIGHLIGHTS
payout ratio in %                                                                   55%                    55%
                                                                                                                               • Commitment to a payout ratio of 35% to 55%,
                                                            40%                                                                  related to dividend over net income
      34%
                                            24%
                                                                                                                                 ̶ Higher payout in years with peak earnings, while
                       22%
                                                                     Old    New                            35%                      ratio towards lower end
                                                                dividend    dividend                                              ̶ Lower payout in years with trough earnings, while
                           2,009                                   policy   policy
                                               1,823                                                                                ratio towards upper end

                                                                                                                               • For FY 2020 dividend, proposal of €1.30 per share
           795
                                                                                                                                 to the upcoming AGM on April 16, 2021
                                                                  552                   459
                    436                  438
     273                                                  219                  251                                             • Corresponding FOCF of €530m in FY 2020 fully
                                                                                                                                 covers dividend payout of €251m
      2016            2017                 2018             2019                2020(a)                Future

      1.35             2.20                 2.40            1.20                    1.30

           Dividend of Covestro AG                 Net income           €           Dividend per share in €

16                  FY 2020 │ IR Roadshow Presentation                      Note:          (a) Proposed dividend for FY 2020
Securing profitable growth
Why invest in Covestro

      Leading and defendable global industry positions
         as innovation and cost leader

      Sustainable volume growth above GDP
         driven by innovation and sustainability trend

      Transformation program LEAP to exploit Covestro’s full potential
         maintaining fixed costs unchanged until 2023

      “We will be fully circular”
         accelerating the transition to a fossil-free economy aligned with ESG criteria

      Capital allocation focused on value creation
         with commitment to profitable growth

17         FY 2020 │ IR Roadshow Presentation
Covestro investment highlights

        Group financials 2020

        Segment overview

        Acquisition DSM-RFM

        Background information

covestro.com       FY 2020 │ IR Roadshow Presentation   18
Significantly increasing margins towards year end
Group results

SALES AND CORE VOLUME GROWTH(a)                                                                                                       HIGHLIGHTS
in € million / changes Y/Y                                                                                                              • Severe negative impact from coronavirus
                 1.1%
                               5.3%           3.8%                                           3.0%              1.7%
                                                                                                                                          pandemic particularly in Q2 2020, core volumes
      -1.8%                                                -4.1%
                                                                                                                                          again above previous year in H2 2020
                                                                            -22.7%                                                      • Q4 2020 core volume growth reflects solid
                                                                                                                                          underlying demand globally, hampered by
      3,175      3,211         3,162          2,864        2,783             2,156           2,760             3,007                      constrained availability of products in PUR and
     Q1 2019    Q2 2019      Q3 2019        Q4 2019       Q1 2020           Q2 2020         Q3 2020          Q4 2020                      PCS
                                Sales                  Core volume growth Y/Y

EBITDA AND MARGIN                                                                                                                     HIGHLIGHTS
in € million                                                                                                                            • Q1 2020 and particularly Q2 2020 burdened by the
                                                                                             16.5%
                                                                                                              21.2%                       effects of the coronavirus pandemic
      13.9%      14.3%        13.4%
                                              9.7%         9.1%
                                                                             5.8%                                                       • In Q3 2020, EBITDA of €456m again above prior
                                                                                                                                          year, strongly benefitting from saving measures
                                                                                                                                        • Q4 2020 EBITDA driven by €388m positive pricing
       442        459           425            278          254                               456               637
                                                                             125                                                          delta Y/Y, mainly in PUR
     Q1 2019    Q2 2019      Q3 2019        Q4 2019       Q1 2020           Q2 2020         Q3 2020          Q4 2020

                                EBITDA                 EBITDA Margin

19                FY 2020 │ IR Roadshow Presentation               Notes:      (a) Reference values calculated on the basis of the definition of the core business effective March 31, 2020
Volumes burdened by impact from coronavirus pandemic
FY 2020 – Regional split

Sales in € million                                                                                             CORE VOLUME GROWTH Y/Y
Core volume growth Y/Y in %
                                                                                                                • Globally broad-based recovery in H2 after severe
                                                                                                                  negative impact from coronavirus pandemic in Q2:
                    China
                     2,250                                                                                         ̶ Furniture/wood c. -6%, while NAFTA up 2%
                                                                           EMLA
                   Vol. -3.3%                                                                                       ̶ Construction c. -2%, while APAC up 2%
                                                                            4,600
                                                                          Vol. -6.2%                                 ̶ Auto/transport c. -14%, while China virtually flat
                                                                                                                      ̶ Electro c. -3%, while EMLA up 3%
                                                 GLOBAL                                                                ̶ Divers c. -3% including medical c. +13%
                                                  10,706
                                                 Vol. -5.6%                                                     • APAC: low to mid-single digit declines in all key
             APAC
             3,552
                                                                                                                  industries, except growth in construction
           Vol. -4.4%
                                                                         Germany                                • EMLA: mixed dynamics, with double-digit declines in
                                                                           1,342
                                                                                                                  auto and furniture/wood, while electro grew; volumes in
                                                                         Vol. -9.8%
                                                                                                                  Germany driven by double-digit declines in auto and
                                        U.S.                                                                      construction
                                       2,128                   NAFTA
                                     Vol. -4.8%                 2,554                                           • NAFTA: double-digit decline in auto, while
                                                              Vol. -6.4%                                          furniture/wood grew

20               FY 2020 │ IR Roadshow Presentation              Note:         Core volume growth not adjusted for portfolio changes
Sales burdened by lower prices and volumes
FY 2020 – Sales bridge

in € million                                                                          HIGHLIGHTS
                                                -13.7%                                Volume negative
     12,412                                                                           • Volume decline of -5.1% Y/Y (in €) driven by PUR
                                                                                        and CAS
                                                                                      Negative pricing
                   -637                                                               • Lower selling prices, mainly in PUR and PCS,
                                                                            10,706
                                       -709                                             negatively impacted sales by -5.7% Y/Y
                                                         -195    -165                 Negative FX
                                                                                      • FX affected sales by -1.6% Y/Y mainly driven by
                                                                                        weaker BRL, USD, CNY and MXN
                                                                                      Portfolio changes
                                                                                      • Negative impact of -1.3% Y/Y
                                                                                      • PCS: European sheets divested as of 2nd January
                                                                                        2020 (FY 2020: €-115m)
                                                                                      • PUR: European systems houses divested as of 1st
                                                                                        November 2019 (FY 2020: €-56m)
                                                                                      • CAS: Thermoplastic PU business DCP fully
     FY 2019     Volume                Price             FX     Portfolio   FY 2020     consolidated as of 1st April 2019 (FY 2020: €+7m)

21             FY 2020 │ IR Roadshow Presentation
Cost saving measures as largest positive EBITDA contributor
FY 2020 – EBITDA bridge

in € million                                                                                                                     HIGHLIGHTS
                                                                                                                                   Negative volume leverage(a)
                                                     -8.2%
                                                                                                                                   • Negative volume leverage of 63% due to
      1,604                                                                                                                           unfavorable product mix effect
                                     Pricing delta
                                         +132                                          +162                 1,472                  Positive pricing delta
                                                 +841                                                                              • Main contribution from PUR, PCS slightly positive
                                                                                                                                      whereas CAS slightly negative
                                                                     -26
                                                                                                                                   Slightly negative FX
               -400
                                                                                                                                   • Mainly translational effects
                                                                                                                                   Other items
                                                                                                                                   • €+350m net contribution of short-term savings and
                                                                                                                                      Perspective efficiency program
                                 -709                                                                                              • €-128m net impact of one-time effects: 2020
                                                                                                                                      €-12m (€-33m RFM acquisition, €+21m insurance
                                                                                                                                      reimbursements) vs. 2019 €+116m
               Volume            Price        Raw material           FX            Other items
                                                                                                                                   • €-60m various items including merit increase
     FY 2019                                                                                             FY 2020
                                                 price

22              FY 2020 │ IR Roadshow Presentation           Note:         (a) Method of calculation: EBITDA volume contribution / sales volume contribution
Volume growth despite constrained supply
Q4 2020 – Regional split

Sales in € million                                                                                           CORE VOLUME GROWTH Y/Y
Core volume growth Y/Y in %
                                                                                                              • While demand in Q4 was robust globally, supply was
                                                                                                                constrained and limited volume growth:
                    China
                      680                                                                                        ̶ Furniture/wood c. -1%, while NAFTA up double-digit
                                                                           EMLA
                   Vol. -1.2%                                                                                     ̶ Construction c. +2%, driven by EMLA
                                                                           1,288
                                                                         Vol. +2.5%                                ̶ Auto/transport c. +6%, growth in all regions
                                                                                                                    ̶ Electro c. +8%, growth in all regions
                                                 GLOBAL                                                              ̶ Divers c. -3% including medical c. +11%
                                                  3,007
                                                Vol. +1.7%                                                    • APAC: declining volumes in furniture/wood and diverse
             APAC
             1,065
                                                                                                                industries, while volumes in auto and electro grew
           Vol. -2.2%
                                                                        Germany                               • EMLA: all key industries grew, except furniture/wood
                                                                            353
                                                                        Vol. +3.2%
                                                                                                              • NAFTA: highest growth of all regions, with positive
                                        U.S.                                                                    contributions from all key industries; double-digit growth
                                         535                  NAFTA                                             rates in furniture/wood and electro
                                     Vol. +6.9%                  654
                                                             Vol. +7.1%

23               FY 2020 │ IR Roadshow Presentation             Note:        Core volume growth not adjusted for portfolio changes
Higher prices and volumes push sales growth
Q4 2020 – Sales bridge

in € million                                                                         HIGHLIGHTS
                                                +5.0%                                Volume positive
                                                                                     • Growth of +4.7% Y/Y (in €) driven by all three
                                       +156                                            segments, with largest contribution from PCS
                  +134                                                      3,007
      2,864                                                                          Positive pricing
                                                        -115     -32
                                                                                     • Higher selling prices in PUR were partly
                                                                                       compensated by lower prices in PCS and CAS,
                                                                                       positively impacted sales by +5.4% Y/Y
                                                                                     Negative FX
                                                                                     • FX affected sales by -4.0% Y/Y mainly driven by a
                                                                                       weaker USD
                                                                                     Portfolio changes
                                                                                     • Slightly negative impact of -1.1% Y/Y
                                                                                     • PUR: European systems houses divested as of 1st
                                                                                       November 2019 (Q4 2020: €-8m)
                                                                                     • PCS: European sheets divested as of 2nd January
     Q4 2019     Volume                Price             FX    Portfolio   Q4 2020     2020 (Q4 2020: €-24m)

24             FY 2020 │ IR Roadshow Presentation
Strong positive pricing delta drives EBITDA growth
Q4 2020 – EBITDA bridge

in € million                                                                                                                    HIGHLIGHTS
                                                +129.1%                                                                           Positive volume leverage(a)
                                                                                                                                  • Relatively low volume leverage of 20% due to
                                                     +232                                                                            unfavorable product mix effect
                                                                                                           637
                                                                 -25                                                              Contribution margin largely increased
                                                                                       -31
                                                                                                                                  • Strong positive pricing delta as a result of lower
                                +156                                                                                                 raw material prices and higher selling prices, with
                                                                                                                                     majority contribution from PUR
                                                                                                                                  Slightly negative FX
                +27
       278                                                                                                                        • Mainly translational effects
                                      Pricing delta                                                                               Other items
                                          +388                                                                                    • Cost saving measures contributed positively
                                                                                                                                  • Negative one-time effect of €-33m related to
                                                                                                                                     announced RFM acquisition
                                                                                                                                  • Previous year included positive one-time effect of
               Volume            Price        Raw material           FX           Other items
                                                                                                                                     book gain from PUR divestment (€+34m)
     Q4 2019                                                                                           Q4 2020
                                                 price

25              FY 2020 │ IR Roadshow Presentation           Note:        (a) Method of calculation: EBITDA volume contribution / sales volume contribution
Strong cash performance in a tough environment
Historical FOCF development

in € million                                                                                                     HIGHLIGHTS

                          1,843
                                                                                                                   • In FY’20, FOCF increased by 12.1% to €530m
                                                       1,669                                                         despite lower earnings, supported by €206m lower
                                                                                                                     Capex
                                                                473                    530                         • In Q4’20, FOCF up by 19.4% to €394m (€330m in
                                                                                                                     Q4’19) driven by significantly higher earnings, while
                                                                                                                     positive effects from trade working capital were
                        FY 2017                  FY 2018       FY 2019              FY 2020                          significantly lower than previous year
                                                                                                                   • Working capital to sales ratio(b) at 18.2%,
EBITDA                    3,435                    3,200        1,604                 1,472                          temporarily above 15-17% target corridor
                                                                                                                   • Compared to previous full year, trade accounts
Changes in
working capital
                           -475                        -167    +437(c)                 -100                          receivable tied up €344m more cash, cash released
                                                                                                                     from inventories was €162m lower
                                                                                    ≥900(b)
Capex(a)                   -518                        -707     -910                  -704                         • Capex of €704m in line with FY 2020 guidance
                                                                                                                   • Income tax paid of €155m in line with P&L income
Income tax paid            -510                        -574     -296                   -155                          taxes of €151m

Other effects               -89                        -83     -362(c)                  +17

                                                                Note:    Working capital includes changes in inventories, trade accounts receivable and trade accounts payable
26                FY 2020 │ IR Roadshow Presentation                     (a) Cash-relevant capex
                                                                         (b) Method of calculation: Working Capital on December 31, 2020, divided by sales of last four quarters
                                                                         (c) Prior year figure restated following change in presentation for rebates granted to customers, affecting trade accounts payable
Strong liquidity position in preparation for RFM closing
December 31, 2020 – Total net debt

in € million                                                                                                          HIGHLIGHTS
                                                                                                                        • Total net debt to EBITDA ratio(a) of 1.7x end of
       2,954                                                                                                              2020 vs. 1.8x end of 2019
                                              219                                                                       • Equity ratio of 44% end of 2020 vs. 46% end of
                               47                                                   158             2,479                 2019
       989                                                              78
               (530)                                                                                  356               • Committed to a solid investment grade rating
                                                        (447)                                                           • 2019 dividend of €219m paid out in Aug. 2020
                                                                                                                        • Capital increase of €447m executed in Oct. 2020
                                                                                                                          in context of announced RFM acquisition

                                                                                                                        Liquidity at attractive rates
      1,965                                                                                         2,123
                                                                                                                        • Balance sheet with ~€2.5bn in cash, cash
                                                                                                                          equivalents and current financial assets
                                                                                                                        • Strong liquidity position in preparation for closing
                                                                                                                          of announced RFM acquisition
               FOCF       Net interest      Dividend    Capital       Other      Changes
                                                                                                                        • Undrawn syndicated revolving credit facility (RCF)
     DEC 31,                                                                                       DEC 31,
      2019                                             increase                 in pension          2020                  of €2.5bn in place with ESG element
                                                                                provisions

                              Net financial debt          Pension provisions

27               FY 2020 │ IR Roadshow Presentation                  Note:     (a) Method of calculation: Total net debt on December 31, 2020, divided by EBITDA of last four quarters
Covestro investment highlights

        Group financials 2020

        Segment overview

        Acquisition DSM-RFM

        Background information

covestro.com       FY 2020 │ IR Roadshow Presentation   28
Number one producer globally and inventor of PU(a)
Polyurethanes (PUR) at a glance

     PRODUCTS                                                                SAMPLE APPLICATIONS

     Polyurethane rigid foam is an excellent insulation                                                                                                                       1.4%
     material and adds to high energy efficiency in
     cooling units and buildings.                                                                                                                                        Core volume
                                                                                                                                                                         CAGR in 2015 - 2020(b)
     As soft foam polyurethane provides comfort, for
     example in mattresses, car seats and upholstery.

     Covestro develops and produces the components
                                                                                    For comfortable
                                                                                          cars
                                                                                                                             For sustainable
                                                                                                                                 houses                                       €5.0bn
     of this versatile material.
                                                                                                                                                                         Sales
                                                                                                                                                                         2020

     KEY CUSTOMER INDUSTRIES:                                                                                                                                                 €625m
                                                                                          For cozy                         For highly efficient
                                                                                          furniture                            appliances                                EBITDA
                                                                                                                                                                         2020

29                FY 2020 │ IR Roadshow Presentation   Notes:   (a) Based on total combined nameplate capacity for MDI, TDI and polyether polyols at year end 2020 as per Covestro estimates
                                                                (b) Adjusted 2017 figures to reflect the transfer of the specialty elastomers business from the Polyurethanes segment to the
                                                                    CAS segment as of January 1, 2018
                                                                    CAGR determined by negative core volume growth in 2020 impacted by the Coronavirus pandemic
Polyurethanes – earnings strongly up on higher margin
Segment results

SALES AND CORE VOLUME GROWTH                                                                          HIGHLIGHTS
in € million / changes Y/Y                                                                            • Core volume growth (in kt) of +0.8% Y/Y, driven by
     -0.2%                      5.1%          3.6%                                 4.3%
                  0.7%
                                                           -3.6%
                                                                                             0.8%       polyols while MDI and TDI supply was constrained
                                                                                                      • Core volume growth in auto and appliances, while
                                                                        -25.9%
                                                                                                        furniture/wood and construction declined slightly
                                                                                                      • Sales increased by 13.7% Y/Y as price (+16.2%)
      1,476      1,489         1,478          1,336         1,274        913       1,315     1,519
                                                                                                        and volume (+2.9%) contributed positively, while
     Q1 2019    Q2 2019       Q3 2019        Q4 2019      Q1 2020       Q2 2020   Q3 2020   Q4 2020
                                                                                                        FX (-4.8%) and portfolio (-0.6%) were negative
                                 Sales                  Core volume growth Y/Y

EBITDA AND MARGIN                                                                                     HIGHLIGHTS
in € million / margin in percent                                                                      • Strong sequential EBITDA and margin
                                                                                             25.0%      development
                                                                                   16.7%
      10.6%      11.6%         13.3%           9.2%
                                                            3.9%                                      • Compared to prior year, EBITDA increased mainly
                                                                         -2.6%
                                                                                                        due to a strong positive pricing delta in all three
       157         172           196            123          50                     220       379
                                                                                                        product groups MDI, TDI and polyols
                                                                          -24
                                                                                                      • Effects from FX slightly negative (Y/Y)
     Q1 2019     Q2 2019      Q3 2019        Q4 2019       Q1 2020      Q2 2020   Q3 2020   Q4 2020

                                 EBITDA                 EBITDA Margin

30                 FY 2020 │ IR Roadshow Presentation
Polyurethanes broadly positioned for growth
Sales by business, end-markets and regions

SALES SPLIT BY BUSINESS                              SALES SPLIT BY END-MARKETS                                                  SALES SPLIT BY REGIONS
% of 2020 PUR sales                                  % of 2020 PUR sales                                                        % of 2020 PUR sales

                                                      Diverse industries
                                          TDI         (incl. Chemicals)
                                                                                                            Comfort /
                                 ~20%                                                                                                      APAC
                                                                        24%                                 Furniture
                                                                                                                                                    29%
                                                                                                     32%
     MDI ~40%
                                                                                                                                                                                     43%      EMLA

                                                                   9%
                                                      Appliances

                                 ~40%                                      12%
                                                                                             23%                                                           28%
                                         Polyether               Auto &
                                          Polyols               Transport                           Construction                                  NAFTA

        Growth driven by MDI and TDI                          Growth driven by several industries                                              Growth driven by all regions

31              FY 2020 │ IR Roadshow Presentation   Notes:    Based on Covestro Annual Report 2020; EMLA = Europe, Middle East Africa, Latin America; NAFTA = USA, Canada, Mexico; APAC = Asia, Pacific
                                                               Sales split by industry for your convenience only; shown numbers are approximations on full year basis
MDI industry supply and demand ongoing favorable
Historical industry development and outlook

MDI DEMAND DEVELOPMENT (2015 - 2025e)                                                                 MDI SUPPLY DEVELOPMENT (2015 - 2025e)
(kt)(a)                                                                                              (kt)(b)
% growth as CAGR                                                                                     % growth as CAGR                                   BASE
                                                        BASE
                                                                                                                                                                       5%   HIGH
                                                                                                                                                        ~4%
                                                        ~5%
                                                                                 6%      HIGH

                                                                                                                                         3.5%                          3%   LOW
                          4.3%                                                   4%      LOW

                                                                                                                                                8,722
                                        7,385

           2015                          2020                    2025e                                                  2015                    2020           2025e

INDUSTRY HIGHLIGHTS
 • Structurally sound demand of ~5% based on global GDP growth and substitution trends, European Green Deal could add another
   percentage point to annual demand growth once fully materializing
 • Additions(c) expected until 2025e: Wanhua/Connel/BorsodChem (1,300kt), Juli Heshan (400kt in China) and BASF (200kt in USA)
 • Covestro additions: Caojing, PRC (100kt, 2021e) and Tarragona, Spain (50kt, 2023e)

32                 FY 2020 │ IR Roadshow Presentation          Notes:    (a) Assumes global GDP CAGR 2020 - 2025e of 3 - 4%
                                                                         (b) Based on historical and announced future nameplate capacities
                                                                         (c) Based on corporate announcements
                                                               Source:   Covestro estimates
TDI industry absorbing oversupply over time
Historical industry development and outlook

TDI DEMAND DEVELOPMENT (2015 - 2025e)                                                                 TDI SUPPLY DEVELOPMENT (2015 - 2025e)
(kt)(a)                                                                                              (kt)(b)
% growth as CAGR                                                                                     % growth as CAGR

                                                                                                                                                        BASE

                                                        BASE                                                                                                           ~3%   HIGH
                                                                                                                                                        ~3%
                                                        ~5%
                                                                                 6%      HIGH
                                                                                                                                         3.8%
                          2.3%                                                                                                                                         1%    LOW

                                                                                 4%      LOW

                                                                                                                                                3,350
                                        2,350

           2015                          2020                    2025e                                                  2015                    2020           2025e

INDUSTRY HIGHLIGHTS
 • Structurally sound demand of ~5% based on global GDP growth supported by low basis due to Coronavirus pandemic in 2020
 • Major additions(c) expected until 2024e: Wanhua-Fujian (150kt in China)
 • Announced Cangzhou Dahou plant (+200kt) expected as of 2025e

33                 FY 2020 │ IR Roadshow Presentation          Notes:    (a) Assumes global GDP CAGR 2020 - 2025e of 3 - 4%
                                                                         (b) Based on historical and announced future nameplate capacities
                                                                         (c) Based on corporate announcements
                                                               Source:   Covestro estimates
Number one producer globally and inventor of PC(a)
Polycarbonates (PCS) at a glance

     PRODUCTS                                                                SAMPLE APPLICATIONS

     As a true high-tech material, polycarbonate is not                                                                                         3.5%
     only very robust, break-proof and light-weight, but
     also offers a high degree of design flexibility.                                                                                         Core volume
                                                                                                                                              CAGR in 2015 - 2020(b)
     Polycarbonate is available in all colors ranging
     from crystal clear to deep black. It is an excellent
     substitute for traditional material such as glass
     or metal.
                                                                                       For trendy
                                                                                      smartphones
                                                                                                                                For bright
                                                                                                                                buildings       €3.0bn
                                                                                                                                              Sales
     This allows for a wide variety of application
                                                                                                                                              2020
     possibilities ranging from vehicles to smartphones
     and laptops as well as lenses or large roofs.

     KEY CUSTOMER INDUSTRIES:                                                                                                                   €553m
                                                                                    For light-weight                          For safe
                                                                                          cars                             medical products   EBITDA
                                                                                                                                              2020

34                FY 2020 │ IR Roadshow Presentation   Notes:   (a) Based on nameplate capacity at year end 2020 as per Covestro estimates
Polycarbonates – margin driven by improving product mix
Segment results

SALES AND CORE VOLUME GROWTH                                                                          HIGHLIGHTS
in € million / changes Y/Y                                                                            • Core volume growth (in kt) of 3.2% Y/Y driven by
                                9.3%
                  4.4%                        3.5%                                 3.6%      3.2%       all key industries; double-digit growth in
      -6.3%                                                -4.9%                                        construction including protective gear
                                                                        -14.4%                        • Sales decreased by -1.4% Y/Y as positive volume
                                                                                                        effect (+7.4%) was compensated by FX
      860         898           901            814          733          648       801        803
                                                                                                        (-3.7%), portfolio (-3.0%) and price (-2.1%)
     Q1 2019    Q2 2019       Q3 2019        Q4 2019      Q1 2020       Q2 2020   Q3 2020   Q4 2020   • Difference of core volume growth and volume
                                 Sales                  Core volume growth Y/Y                          effect in sales due to favorable product mix

EBITDA AND MARGIN                                                                                     HIGHLIGHTS
in € million / margin in percent                                                                      • Strong sequential EBITDA growth, margin further
                                                                                            24.9%       improved driven by improving product mix
      18.0%      17.1%                                                            18.5%
                               14.7%          11.7%        14.9%        14.8%                         • Compared to prior year, EBITDA increased Y/Y
                                                                                                        mainly as a result of (i) positive pricing delta due
       155        154            132            95          109           96       148       200        to lower feedstock prices and (ii) higher volumes
     Q1 2019    Q2 2019       Q3 2019        Q4 2019      Q1 2020       Q2 2020   Q3 2020   Q4 2020

                                  EBITDA                EBITDA Margin

35                 FY 2020 │ IR Roadshow Presentation
Execution risks may limit future capacity additions
Historical industry development and outlook

PC DEMAND DEVELOPMENT (2015 - 2025e)                                                                  PC SUPPLY DEVELOPMENT (2015 - 2025e)
(kt)(a)                                                                                              (kt)(b)
% growth as CAGR                                                                                     % growth as CAGR                                   BASE

                                                                                                                                                        6 - 7%           9%   HIGH
                                                        BASE

                                                                                 6%      HIGH
                                                        ~5%                                                                              4.5%                            5%   LOW

                          2.0%
                                                                                 4%      LOW

                                                                                                                                                6,110
                                        4,220

           2015                          2020                    2025e                                                  2015                    2020             2025e

INDUSTRY HIGHLIGHTS
 •   Structurally sound demand growth of ~5% based on global GDP growth supported by low basis due to Coronavirus pandemic in 2020
 •   Major additions(c) expected until 2025e: Hainan Huasheng, ZPC, SABIC-Sinopec, Wanhua, Shemna
 •   Numerous announced projects with high uncertainties regarding actual timing and scope
 •   Covestro additions: Mid-term expansion plans generally accomplished, current focus on strengthening differentiated business

36                 FY 2020 │ IR Roadshow Presentation          Notes:    (a) Assumes global GDP CAGR 2020 - 2025e of 3 - 4%
                                                                         (b) Based on historical and announced future nameplate capacities
                                                                         (c) Based on corporate announcements
                                                               Source:   Covestro estimates
EBITDA margin increase despite industry utilization deteriorating
PCS portfolio management

                                                                                                         PRODUCT PORTFOLIO IMPROVEMENT
                                                                                                           • Covestro performance detaching from development of
                          Industry                                Further growth                             overall PC industry utilization by outgrowing the industry in
                        supply growth                               of industry
                          11% y/y                                     supply                                 differentiated (high-value) applications
      82%                                                                                                  • Differentiated business with more than 500 different PC
                                                                                                             grades and prices ranging up to eight times higher than
                             69%                                                                             standard grades
                                                                                                           • Industry newcomers need – if they succeed at all – many
                                                                                                             years to enter the differentiated segment
                            18.5%                                                                          • Possibility to reallocate volumes among customer industries
     15.4%                                                                                                   allows high asset utilization and EBITDA margin also in
                                                                                                             case of single industry’s weakness like automotive in 2020
                                                                                                           • Mid-term, goal to further increase differentiated portion of
                                                                                                             PC volumes with structural improvement of average
                                                                                                             contribution margin and standard business as remainder for
                                                                                                             high asset utilization
                                                                                                           • Focus on differentiated business with further detachment
      2019                   2020                                    mid-term                                from mid-term further declining industry utilization
             Covestro EBITDA margin               PC industry utilization rate

37           FY 2020 │ IR Roadshow Presentation        Notes:   Approximate PC industry utilization rates based on Covestro estimates and corporate announcements;
                                                                including impact of potential competitor responses: timing / scaling / suspending projects, reducing / mothballing capacities et al
Performance materials for coatings, adhesives and specialties
Coating, Adhesives, Specialties (CAS) at a glance

     PRODUCTS                                                                 SAMPLE APPLICATIONS

     There is a vast application range of coatings                                                                                                                                 -1.2%
     and finishes made of Covestro polyurethane
     raw materials. They are used for protection                                                                                                                              Core volume
     and decoration.                                                                                                                                                          CAGR in 2015 - 2020(b)

     In addition, the company produces pre-products
     for adhesives, sealants and elastomers as well as
     specialty films.
                                                                                      For long-lasting
                                                                                        cosmetics
                                                                                                                                    For robust
                                                                                                                                      floors                                       €2.0bn
                                                                                                                                                                              Sales
     Coating, Adhesives, Specialties (CAS) also
                                                                                                                                                                              2020
     supplies materials for cosmetics, textiles and
     medical goods.

     KEY CUSTOMER INDUSTRIES:                                                                                                                                                      €341m
                                                                                          For fancy                              For functional
                                                                                            cars                                    textiles                                  EBITDA
                                                                                                                                                                              2020

38                FY 2020 │ IR Roadshow Presentation   Notes:   (a) Based on nameplate capacity at year end 2020 as per Covestro estimates
                                                                (b) All figures adjusted to reflect the transfer of the specialty elastomers business from the Polyurethanes segment to Coatings, Adhesives,
                                                                    Specialties segment as of January 1, 2018 as well as the termination of trading activities and reduced contract manufacturing
                                                                    CAGR determined by negative core volume growth in 2020 impacted by the Coronavirus pandemic
Coatings, Adhesives, Specialties – back to volume growth
Segment results

SALES AND CORE VOLUME GROWTH                                                                                          HIGHLIGHTS
in € million / changes Y/Y                                                                                            • Core volume growth (in kt) of 2.8% Y/Y driven by
                                                                                                                        growth in all key industries except construction
                                              6.2%
      -0.1%      -4.7%         -4.0%                       -5.2%                        -6.9%
                                                                                                     2.8%
                                                                                                               0.1    • Sales decreased by -0.8% Y/Y, as positive volume
                                                                                                               0

                                                                        -25.3%                                 -0.1     effect (+7.5%) was compensated by price (-4.9%)
                                                                                                               -0.2
                                                                                                               -0.3
                                                                                                                        and FX (-3.4%)
      627         621           588            533          572          443             495          529      -0.4
                                                                                                               -0.5
                                                                                                                      • Difference of core volume growth and volume
     Q1 2019    Q2 2019       Q3 2019        Q4 2019      Q1 2020       Q2 2020        Q3 2020      Q4 2020             effect in sales due to favorable product mix
                                 Sales                  Core volume growth Y/Y

EBITDA AND MARGIN                                                                                                     HIGHLIGHTS
in € million / margin in percent                                                                                      • Q4’20 EBITDA includes negative one-time effect of
                                                                                                                        €-33m related to announced RFM acquisition
       23.3%      24.2%                                     22.7%                      20.0%
                                18.9%
                                               11.6%                     13.5%
                                                                                                     9.8%
                                                                                                                      • Q4’20 EBITDA of €85m and margin at 16.1%
                                                                                                                        excluding RFM-related one-time effects
                                                                                                                      • Compared to prior year, volume growth contributed
        146        150           111                         130          60             99
                                                 62                                                   52                positively to EBITDA while pricing delta was
      Q1 2019    Q2 2019       Q3 2019        Q4 2019      Q1 2020      Q2 2020        Q3 2020      Q4 2020             negative
                                 EBITDA                 EBITDA Margin            RFM-related one-time effect

39                 FY 2020 │ IR Roadshow Presentation
Growth determined by coronavirus pandemic
Outperformance of High Growth Specialties business

CAS SALES SPLIT BY BUSINESSES                                                                                                 HIGHLIGHTS
Covestro sales share FY 2020
Core volume growth, CAGR 2015-2020 (a)
                                                                                                                                • Flat core volume CAGR in 2015-2020(a) with
                                           Diverse High                                                                           negative core volume growth in 2020 impacted by
                                         Growth Specialties
                                                                                                                                  the Coronavirus pandemic
                                            Vol. +4%
                                Elastomers                                                                                      • Coatings Raw Materials particularly burdened by
                                 Vol.+2%           4%                                                                             Coronavirus impact in 2020 with weak end-
                                            9%                                                                                    markets, particularly Automotive
                                                                                                                                • High Growth Specialties businesses generate
                   Specialty Films                                                                                                ~39% of sales: Thermoplastic Polyurethanes,
                       Vol. +1%        12%                                              Coatings
                                                                           41%                                                    Specialty Films and Elastomers
                                                                                      Raw Materials
                                                                                                                                • Solid growth of High Growth Specialties despite
                                                                                         Vol. -3%
                                                                                                                                  Coronavirus set-back
                  Thermoplastic
                  Polyurethanes
                                        14%
                    Vol. +5%

                                                         19%
                        Adhesives & Sealants
                           Raw Materials
                                Vol. +2%

40                  FY 2020 │ IR Roadshow Presentation         Notes:   (a) All figures adjusted to reflect the transfer of the specialty elastomers business from the Polyurethanes segment to Coatings,
                                                                        Adhesives, Specialties segment as of January 1, 2018 as well as planned termination of trading activities and reduced contract manufacturing
Grow above market with innovative specialty products
CAS Aliphatic isocyanates strategies

DEVELOPMENT OF MARKET CAPACITY (in kton)                                                                                             DISTRITUBUTION                 DISTRIBUTION BY
                    ALI Covestro       ALI Others
                                                                                                                                     BY SUPPLIER                    BASIC MONOMER
                                                                                                                                                       Covestro
 500                                                                                                                                                   Wanhua
                                                                                                                                                                                      HDI
 400
 300                                                                                                                                                   Vencorex                       IPDI

 200                                                                                                                                                                                  H12MDI
                                                                                                                                                       Evonik
 100                                                                                                                                                                                  Other
                                                                                                                                                       Other
   0
                    2010    2011       2012        2013       2014       2015     2016   2017     2018   2019      2020    2021e            Global ALI capacity in 2021e: ~500 kt
                                             Covestro                   Wanhua             Vencorex
                                             investments                investments        investments

                      “Growth”                                                           “Value-over-volume”        Differentiated strategy for standardized vs specialty products
     CAS STRATEGY

                     • Until 2017, CAS accompanied market growth with                    • Severe capacity         • Differentiated strategy to defend standard business while
                       own investments                                                     increases by Wanhua       strengthening specialties
                     • Generate strong growth                                              and Vencorex putting    • Balance market share and absolute margin for more standardized
                     • Maintain market leadership                                          market shares under       products with flexible pricing
                                                                                           pressure                • Grow above market with innovation driven specialty product portfolio
                                                                                         • Prioritize value over   • Capex program geared towards specialty products
                                                                                           volume

41                                 FY 2020 │ IR Roadshow Presentation
Covestro investment highlights

        Group financials 2020

        Segment overview

        Acquisition DSM-RFM

        Background information

covestro.com       Q3 2020 │ IR Roadshow Presentation   42
Building a leading sustainable coating resins player
Transaction overview

     TRANSACTION                                FINANCIAL                                        FINANCING                          TIMING
     VALUE                                      IMPACT

                                                                                                                                €
 • Enterprise value of €1.55bn                 • Announced acquisition of                       • Covestro is committed to a        • Acquisition agreed on Sep
 • 10x EV / 2021 Budget                          Resins & Functional                              solid investment grade rating       30, 2020
   EBITDA                                        Materials (RFM) and                              (Moody’s confirmed solid          • Subject to regulatory
                                                 innovation ventures                              investment grade rating after       approvals including antitrust
 • 6x EV / 2021 Budget                                                                            acquisition announcement)
   EBITDA including                            • RFM sales of €909m and                                                               clearance
   full synergies                                EBITDA of €127m in 2020                        • Refinancing includes €447m        • Closing expected end-Q1’21
                                               • Innovation ventures Additive                     of new equity, successfully
                                                 Manufacturing, NIAGA and                         realized on Oct 13, and own
                                                 Advanced Solar Coatings                          cash
                                                 with sales of €24m and
                                                 EBITDA of €-13m in 2020
                                               • €120m synergies by 2025

43             FY 2020 │ IR Roadshow Presentation         Note:   Announced acquisition of RFM subject to regulatory approval
Resins & Functional Materials and innovation ventures
Key financials in 2020

     €0.9bn                                    €115m                                        12%                                               €91m                  ~1,800
 Sales                                      EBITDA                                      EBITDA margin                                     Free Operating           Employees
                                                                                                                                          Cash Flow

 % of RFM sales
                             Other                                                          Others
        Powder
     Coating Resins             3%                                        Construction               5%
                                                                                               6%                             Architectural         NAFTA
                  23%                                                                     8%                        27%                                      25%
                                                                          Furniture

                                                                                      12%                                                                               47% EMLA
                                               59%         Specialty
    Energy                                                 Resins         Telecom
                  15%
Curable Solutions
                                                                                                                   21%                                       25%
                                                                                               21%
                                                                                                                                                      APAC
                                                                                                                         Packaging
                                                                                  Industrial

44                    FY 2020 │ IR Roadshow Presentation               Note:    Announced acquisition of RFM subject to regulatory approval
RFM serves high growth areas driven by sustainability
Coating Resins market by technology in 2019

RFM TECHNOLOGY SPLIT                                          MARKET TECHNOLOGY SPLIT                                             HIGHLIGHTS

                                                                                                                                  • ~€25bn global coating resins market
                                                                                                                                    in 2019 with expected growth rate of
                                                                                                                                    ~3% p.a. between 2020 and 2025
               35%                                                               6%
                                                                                        4%                                        • Solvent-based market share expected
                                                                                                                                    to decline due to VOC regulation and
                                       10%                                                                                          environmental issues
                                                                                                                45%
                                                                                                                                  • Consumer preference for greener and
                                                               ~5%               ~€ 25bn Sales                           ~1%        non-toxic ingredients as well as stricter
               ~€ 1.0bn Sales                                 CAGR                                                      CAGR        environmental regulations expected to
                                          15%                                     ~3% CAGR
                                                                                                                                    lead to market growth of ~5% p.a. for
                                                                      45%                                                           sustainable coating resins (water-
                                                                                                                                    based, powder and UV coating resins)
                                                                                                                                    between 2020 and 2025
                 40%
                                                                                                                                  • RFM & CAS combined will be a leading
                                                                                                                                    supplier of sustainable and high-quality
                                                                                                                                    products with low environmental impact

     Solvent-based         Water-based               Powder         UV curing                  Sustainable technologies

45              FY 2020 │ IR Roadshow Presentation        Note:     Announced acquisition of RFM subject to regulatory approval
                                                          Source:   Covestro estimate
Bolt-on acquisition diversifies industry portfolio
CAS by industries

CAS SALES ~€2.0bn (2020)                                         CAS/RFM SALES ~€2.9bn (2020 pro-forma)                                    HIGHLIGHTS
                                                                                                                                            • In 2020, RFM would have increased
                                                                                                                                              CAS sales by 45% to €2.9bn (27%
                                                                                                                                              of Covestro sales(a)) with
                                                                                                            Auto & Transport
                                                                                                                                              complimentary product portfolio
                                     Auto & Transport
                                                                                                                                            • Significant step in Covestro’s long-
                                                                                                            15%                               term corporate strategy,
     Other                            22%
                                                                                                                            Construction
                                                                                                                                              strengthening sustainable and
                                                                        Other       32%
                                                                                                                                              innovation-driven business
             42%                                                                                                      12%
                                                                                                                                            • Covestro with well established
                                                                                                                                              position in water-based
                                            15%                                                                                               polyurethane dispersions,
                                                                                                                     11%
                                                                                     4%                                      Industrial       acquisition adds complete range of
                                               Construction              Health
                                      6%                                                  8%                                                  water-based polyacrylate resins
                       6%                                                                                    9%
                              9%                                                                   9%
                                                                        Architectural
         Health                         Industrial                                                               Packaging
                     Furniture &                                                            Furniture &
                       Wood                                                                   Wood

46                 FY 2020 │ IR Roadshow Presentation         Source:     Own company data / DSM
                                                              Notes:      (a) Based on Covestro 2020 Sales
                                                                          Announced acquisition of RFM subject to regulatory approval
Creates a leading coating resins supplier
Industry position in coating resins

Revenue est. (in € billion, 2019)                                                                                                    HIGHLIGHTS
                                                                                                                                     • Covestro to become a global leader
                                                                                                                                       in attractive growth market for
     2.1
                                                                                                                                       coating resins
                2.0                                                                                                                  • Covestro to have one of the most
                                                                                                                                       comprehensive and innovative
                                                                                                                                       product portfolios enabling
                                                                                                                                       compelling customer value
                               1.2                                                                                                     proposition
                                              1.1      1.1
                                                                       1.0               1.0
                                                                                                          0.8

                                                                                                                            0.5

     RFM                                                               RFM

47                FY 2020 │ IR Roadshow Presentation         Source:   Covestro estimate
                                                             Note:     Announced acquisition of RFM subject to regulatory approval
Significant cost synergies of €80m
Identified cost synergies by 2025

DISTRIBUTION OF COST SYNERGIES                                                                 HIGHLIGHTS
                                                                                                 Sales & Marketing
                                                                                                 • Bundle sales and marketing functions for same applications
                                 Others                                                            and customers
                                                                                                 General & Administration
                     R&D                                Sales &                                  • Integrate respective RFM functions into existing Covestro
                                                       Marketing                                   support structures
         Logistics
                                                                                                 Purchasing
                                                                                                 • Use most favorable conditions of RFM and Covestro
                                                                                                 • Intensify in-house sourcing
     Production                        €80m                                                      Production
                                                                                                 • Optimize production by efficiently using both asset bases
                                                                                                 Logistics
                                                                                                 • Apply and combine best practice and processes as currently
                                                        General &                                  used by RFM and Covestro
                                                       Administration                            Research & Development
           Purchasing
                                                                                                 • Combine R&D activities and optimize project pipeline for
                                                                                                   overlapping topics

48                FY 2020 │ IR Roadshow Presentation    Note:   Announced acquisition of RFM subject to regulatory approval
Significant revenue synergies of €40m
Identified revenue synergies by 2025

DISTRIBUTION OF REVENUE SYNERGIES                                                             HIGHLIGHTS
                                                                                                Cross-selling
                                                                                                • Increase share of wallet at customers with cross-selling
                                                                                                  opportunities
               Digital sales                                                                    • Expand regional presence of RFM by leveraging existing
                                                                                                  Covestro set-up
                                                                                                Upgrade portfolio
                                                                                                • Combined broader portfolio of resin systems and tailor-made
                                                                                                  hardener-resin-systems
                                                                                                • New product developments based on combined portfolio and
                                                                                                  technologies
                                    €40m                    Cross-selling
                                                                                                Digital sales
                                                                                                • Speed up digitalization via new business models
                                                                                                • More attractive online store
 Upgrade portfolio

49             FY 2020 │ IR Roadshow Presentation   Note:      Announced acquisition of RFM subject to regulatory approval
Combined product portfolio generates additional customer range
Upgrade portfolio

MID-GRADE / MID-PRICE MARKET CURRENTLY UNTAPPED                                                                                       COMBINING CAS & RFM COATING RESINS
               Voice of the customer                                         Market Attractiveness

                                                                                                                                        COV
                „Highest performance                                                                                                              PUD1 mainly addresses industries with higher
                 at premium pricing“                                                                                                                 grade requirements at higher prices
                                                                     Market Size: ~400kt3
                                                          CAS        Market Growth: ~5%4
                                                       Water-based
                                                          PUD1                                                                           Combination of both PUD-based and Acrylate-based
     „Can you deliver                                                                                                                   coating resins will create an additional business which
     adequate performance at                                                                                                                     will open a new range of customers
     a competitive price?“
                                                                                                                                      Serving the full range by blending PUD-based resins and
                                                                                                                                                                 Water-based
                                                                                                                                            Acrylate based resins at  every desired ratio
                                                                                                                                                                    Hybrid
                                              New business for CAS
                                                  Water-based                                                                            Between coating resins of high price/grade and low
                                                    Hybrid                                                                                  price/grade also offering any mid price/grade
„Low costs but does not
                                                                                                                                       combination within a so far largely untapped market for
meet all technical wishes“
                                                                                                                                                                 CAS
                                                                                                  Market Size: ~1.450kt3
                                                                                                  Market Growth: ~5%4
                                                      RFM

                                                                                                                                        DSM
                                               Water-based Acrylic                                                                                WB2 Acrylics mainly addresses industries with
                                                                                                                                                   lower grade requirements at lower prices

50                FY 2020 │ IR Roadshow Presentation            Notes:   (1) Polyurethane Dispersions                   (2) Water-based
                                                                         (3) 2019; Covestro own estimates               (4) CAGR 2021-2024e; Covestro own estimates
                                                                         Announced acquisition of RFM subject to regulatory approval
Full synergies of €120m expected until 2025
Synergy ramp-up

SYNERGIES AND IMPLEMENTATION COST                                                                                                   HIGHLIGHTS
In € million                                                                                                                        • Identified synergies amount to
                                                                                                                                      €120m, 12% of RFM sales
     Total synergies               10                 50                 80                      100                      120       • Total implementation cost of €140m
                                                                                                                                      (mainly in 2021) to realize annual
                                                                                                                                      synergies of €120m
                                                                                                                                    • Realization of full synergies by
                                                                                                                           40         2025 with two third of synergies
     Revenue synergies                                                                                                                materializing already by 2023
                                                                                                   30
                                                                                                                                    • Quick realization of cost synergies
                                                                          15                                                          while time reserved for revenue
                                                                                                                                      synergies from portfolio updates
                                                       10
     Cost synergies                                                                                                        80
                                                                          65                       70
                                                       40

                                    10
                                  2021e               2022e            2023e                   2024e                    2025e

51               FY 2020 │ IR Roadshow Presentation           Note:   Announced acquisition of RFM subject to regulatory approval
Adoption of 5G to drive significant acceleration in demand
Further operational opportunity

 5G INVESTMENTS                                                 WORLD OPTICAL FIBER INSTALLATIONS                                   5G ROLLOUT
                                                                Forecast*                                                           • 4G investments tailing off in
             Investments driven                                 Million fiber kilometers installed per year                           anticipation of 5G
            by higher frequencies
                                                                                                                                    • Implementation of 5G from
                                                                                                 CAGR
                                                                                                                                      telecom networks and
                                                                                                                                      governments
                                                                                                 ~12%
                                                                                                                     600            • 5G will be enabling applications
                                                                                450
                                                                                                                                      like self-driving cars, IoT, AI
                                                                                                                                    • Key benefits vs. 4G: Higher
                                                                                                                                      bandwidth (>10,000x more traffic),
                                                                                                                                      more devices (10-100x) and much
                                                                                                                                      lower latency
                                                                               2020                                 2023
                                                                                                                                    • Requires different network
 4G Base Station                  5G Base Station                                                                                     infrastructure compared to 4G
 Baseband: 700Mhz - 2,100Mhz      Baseband: ~4Ghz, ~26Ghz                                                                             (5G base stations)
 Typical range: 2km               Typical range: 0.5km

52                 FY 2020 │ IR Roadshow Presentation       Source:   Covestro own estimates
                                                            Note:     Announced acquisition of RFM subject to regulatory approval
Building a leading sustainable coating resins player
Investment highlights

      Creating a global leader in coating resins

      Diversifying CAS portfolio towards a more balanced product and industry mix

      Shifting CAS portfolio to high growth markets driven by sustainability

      Significant synergies leading to attractive valuation multiple

      Committed to a solid investment grade rating

53         FY 2020 │ IR Roadshow Presentation   Note:   Announced acquisition of RFM subject to regulatory approval
Covestro investment highlights

        Group financials 2020

        Segment overview

        Acquisition DSM-RFM

        Background information

covestro.com       FY 2020 │ IR Roadshow Presentation   54
Covestro’s rating results and index memberships
as of February 2021

 RATING / INDEX                   2016      2017      2018   2019   2020     SCORING                        BENCHMARK

                                                        A     A       A
                                   BBB       BBB                             AAA - CCC                      in Specialty Chemicals

                                     B-                 B-            B-
                                                                             A+ - D-                        Prime Status

                                                             80              max. 100 Points
                                                             23.3
                                              75                    20.0     0 - 100 Points                 in Specialty Chemicals
                                     74
 New   methodology(a)                                                        (the lower the better)

                                                             80
                                     73                                      max. 100 Points                Gold Ranking

                                                                                                            Inclusion in FTSE4Good Index(b)

55                      FY 2020 │ IR Roadshow Presentation          Notes:             (a) Methodology reversed - the lower the score the better
                                                                                       (b) Since December 2016, reviewed in June 2020
Synergies in scale, process technology and chemical know-how
One chemical backbone across all segments

     INFRA-                                                                                                                                                         FINAL
                                RAW MATERIALS                                     CORE UNITS / TECHNOLOGY
     STRUCTURE                                                                                                                                                      PRODUCT
                                                                                                                                                                        Phosgene(d)

                                               Toluene                                                             DNT                        TDA                                              HIGHLIGHTS
                                                                                                               Dinitrotoluene            Diaminotoluene                   TDI
                                                                                                                                                                                               • State-of-the-art asset base
                                                                                                                                                                                                 with leading process
     • Premises                         Nitric Acid (HNO3)                                                                                                                                       technology
     • Site                                                                                                                                                                                    • 8 main sites with world-
                                                                                                                                                                        Phosgene(d)
       development                                                                     MNB                        Aniline                     MDA                                                scale production facilities
                                              Benzene                             Mono-Nitrobenzene                                    Methylene Dianiline                MDI
     • Streets                                                                                                                                                                                 • Critical raw materials with
     • Pipeline bridges                                                                                                                                                                          no or limited merchant
                                                        Propylene                                                                                                     Polyether                  market sourced internally
     • Storage tanks              Propylene                                                                                                                            Polyols
                                                          Oxide                                                                                                                                • Synergies at all steps
     • Jetties                                                                                                                                                                                   along the value chain
     • Power supply              e.g. via             Hydrogen (H2)

       & distribution            reformer         Carbon Monoxide (CO)
                                                                                                                                                                                               SALES VOLUMES 2020
     • Waste                                                 Cl2
       management                Chlorine(a)                                                                                                Phosgene(d)                 Phosgene(d)
                                                                                                                                                                                               • Core:              ~4,800kt
                                                         NaOH
                                                                                                                                              DPC                        LPC(b)                • Non-core: ~6,200kt
     • Safety                                                                                                                           Diphenylcarbonate
                                                                                                                                                                  Polycarbonates
                                               Phenol                                                              BPA
                                                                                                                Bisphenol A                                              SPC(c)
                                               Acetone

                                    Purchased raw materials                Covestro activities

56                      FY 2020 │ IR Roadshow Presentation               Notes:      Chart contains key feedstock only; simplified illustration
                                                                                     (a) via Deacon or HCl-ODC technology and / or chloralkali electrolysis, (b) Interface process, (c) melt process (d) produced from CO and Cl 2
Significant synergies from Covestro chemical backbone
CAS backward integration

INFRASTRUCTURE                     RAW MATERIALS                           COVESTRO VALUE CHAIN
                                                                                                                                               Phosgene(b)
                                                   Toluene
     • Premises                                                                                                                                     TDI

                                                                                                                                                                                                                                                   PUR
                                             Nitric acid (HNO3)
     • Site                                                                                                                                                                             Phosgene(b)
       development
                                                   Benzene                                                                                                                                MDI

                                                                                   NaOH
     • Streets

                                                                           HCl
     • Pipeline

                                                                                                                                                                                                                                                   PCS
                                                                                                                                                                                                                          Phosgene(b)
                                                    Phenol
       bridges                                                                                                                                                                                                              PCS
                                                    Acetone
     • Storage tanks                                                                                                            Coatings, Adhesives/Sealants

     • Jetties                                                                                   Phosgene(b)

                                                                            Chlorine(a)

                                                                                                                         Isocyanates

                                                                                                                                            Dispersions

                                                                                                                                                                                           Elastomers
                                                                                                                                                                          derivatives

                                                                                                                                                                                                              TPU films
                                                     HMDA                                          HDI

                                                                                                                                                                                                                           Specialty
                                                                                                                                                               Aromatic
                                                                                                                           Aliphatic

                                                                                                                                                                                                                                        PC films
     • Power supply

                                                                                                                                                                                                                                                   CAS
                                                                                                                                                                                                                            Films
                                                                                                                                                                                                        TPU
                                                                                                                                                PU
       & distribution                                 IPDA                                         IPDI
     • Waste                                         PACM                                        H12MDI
       management
     • Safety

                                                                                                                                                                                                                                                   PUR/CAS
                                                  Adipic acid
                                                                                                                                           Polyester polyols
                                                  HDO/BDO
       Purchased raw
       materials                                       PO
       Covestro activities                                                                                                                 Polyether polyols
                                                       EO

57                           FY 2020 │ IR Roadshow Presentation   Notes:             Simplified illustration
                                                                                     (a) via Deacon or HCl-ODC technology and/or Chlorine-Alkali electrolysis
                                                                                     (b) produced from CO and Cl2
Become the Best of Who we are
Increase our production output by 200kt from existing assets

        TRANSFORM PRODUCTION                             INCREASE EFFECTIVENESS AND                   DIGITALIZATION AND TECHNICAL
       TO EXPLOIT FULL POTENTIAL                            EFFICIENCY OF FACILITIES                PROGRESS AS SUPPORTING LEVERS
 • „Maximize Asset Availability“ to increase         • Implementing the “right scope of work”      • Eliminating recurring technical failures by
   our production output by 200kt from                 with needed inspections, preventive           technical improvements
   existing assets until 2024 across all               maintenance and repair work                 • Implementing digital approaches for asset
   segments by reducing and avoiding                 • Executing the “right scope of work” with      monitoring to early detect anomalies
   outage times                                        shortest possible turnaround duration

                                                              “   Only assets that are available contribute to capacity utilization

                                                              “   Outstanding asset availability is essential for Covestro’s
                                                                  sustainable growth

58              FY 2020 │ IR Roadshow Presentation
Entire organization aligned for performance
Full STI annual target achievement requires EBITDA above €2bn

UNIFORM BONUS SYSTEM                                 EQUALLY WEIGHTED GROUP METRICS                        TRANSPARENT AMBITION
 • Full alignment of all employees                    • Targets for 100% achievement:                      • Future core volume growth goal of
   (including board) along the same KPIs                                                                     4% requires growth capex
 • Criteria with full focus on performance                   Core Volume                                   • 100% target achievement for ROCE
   and shareholder value creation                            Growth                +4.0%                     and FOCF implies mid-cycle EBITDA
 • 100% payout, as percentage of annual                                                                      above €2bn for 2019 - 2021e
   base salary, linked to hierarchy level
 • Total payout at Group level for 0%,
   100% and 250% achievement is €0m,
                                                             FOCF                  €800m
   ~€180m and ~€450m, respectively
 • Fixed hurdle rates for 2019 - 2021
                                                             ROCE above
   reflect KPI values in mid-cycle
                                                             WACC(a)                   8pp
   conditions, based on historical review
   and expected future development
                                                      • For each metric, payout can range from
                                                        0% to 300% relating to Core Volume
                                                        Growth between 1.5% and 9.0% / FOCF
                                                        between €400m and €1,600m / ROCE
                                                        above WACC between 0pp and 24pp
                                                      • Max. payout capped at 250%
59             FY 2020 │ IR Roadshow Presentation   Notes:   (a) WACC = Weighted Average Cost of Capital
You can also read