A CONTINUED ANALYSIS OF GRANT FUNDING ACROSS THE BASIN
←
→
Page content transcription
If your browser does not render page correctly, please read the page content below
AMAZON
  S u s ta i n a b l e
  Landscapes Program

I NTE RNATI O NA L
FU N DI NG                                        SU P P O RTE D BY

FOR AMAZO N
CONSE RVATIO N
A N D SUSTAI N A B L E
MA NAG E M E NT
A CONTI NUE D ANALYSIS OF GRANT FUN DI NG ACROSS TH E BASI N

F E B RUA RY 20 21
Author
Natalie Hoover El Rashidy

Study Coordination
Adriana Moreira and Ana Maria Gonzalez Velosa

Suggested Citation
Hoover El Rashidy, Natalie. 2021. International Funding for Amazon Conservation and
Sustainable Management: A Continued Analysis of Grant Funding Across the Basin.
Washington D.C.: Amazon Sustainable Landscapes Program.

Rights and Permissions
The material in this work is subject to copyright. This work may be reproduced, in whole or in
part, for noncommercial purposes as long as full attribution to this work is given. Any queries
on rights and licenses, including subsidiary rights, should be addressed to the ASL team,
e-mail: asl-info@worldbank.org

About the Amazon Sustainable Landscapes Program

The Amazon Sustainable Landscapes Program (ASL Program), is an Impact Program funded
by the Global Environmental Facility (GEF) with the objective to protect globally significant
biodiversity and implement policies to foster sustainable land use and restoration of native
vegetation cover in Amazon regions of Brazil, Colombia and Peru.        It aims to strengthen
management effectiveness of more than 66 million hectares of protected areas, facilitate
the creation of 4.3 million hectares of new protected areas, promote sustainable practices in
almost 11 million hectares, restore 35,000 hectares of forests and support actions to mitigate
emissions by 164 million mtC02e. The ASL national projects are led by the countries’ Ministries
of Environment and are being executed collaboratively between public and private entities.
The World Bank (lead agency), WWF and UNDP act as GEF Implementing Agencies providing
support and supervision. A regional coordination project, implemented by the WB, provides
technical assistance and knowledge management opportunities to the participant countries.

Contact

ASL Coordinator
Ana Maria Gonzalez Velosa asl-info@worldbank.org

ASL website:
https://www.worldbank.org/en/programs/amazon-sustainable-landscapes-program

ASL Community of Practice:
https://collaboration.worldbank.org/content/sites/collaboration-for-development/en/groups/
amazon-sustainable-landscapes-program-cop.html

2
Contents

LIST OF TABLES AND FIGURES								4

ACRONYMS 											5

FOREWORD 											7

ACKNOWLEDGMENTS 									8

EXECUTIVE SUMMARY 									10

INTRODUCTION 										13

    The Amazon Basin and the Role of Conservation and Sustainable Management   13

    Amazon Sustainable Landscapes Program    						14

    About this Report: Tracking Funding within the Amazon, 2007 - 2019			      16

APPROACH TO IDENTIFYING THE INTERNATIONAL DONOR FUNDING
LANDSCAPE OF THE AMAZON BASIN       						18

     Overview			             							                                           18

     Study Criteria		        								19

     Data Gathering			              							23

     Important Considerations about the Data				 		 23

RESULTS        			 							25

     Respondents		           								25

     Aggregate Conservation Funding by Recipient Country 				26

     Donors			               								27

     Funding by Donor Agency        							30

     Funding by Grantee      								31

     Allocations across Conservation and Sustainable Management Strategies     35

CONCLUSION AND RECOMMENDATIONS		                 					37

     Recommendations         								38

BIBLIOGRAPHY		 								41

APPENDIX 1. DONORS FROM 2007-2012 GBMF STUDY					42

APPENDIX 2. DONORS FROM 2013-2015 GBMF STUDY					43

3
L i st o f Ta b l e s a n d Fi g u r e s

Table 1. Overview of Studies on International Conservation Funding in the Amazon		   16

Table 2. Primary Conservation and Sustainable Management Strategies and Objectives   22

Table 3. List of Donors Included in 2016-2019 Study						25

Table 4. Top 10 Conservation and Sustainable Management Donors in the Amazon		       29

Table 5. Donors Included in the 2007-2012 Study 						42

Table 6. Donors Included in the 2013-2015 Study 						43

Figure 1. Total Conservation and Sustainable Management Funding in the Amazon
          by Country by Year									26

Figure 2. Donor Funding in the Amazon, 2016-2019						28

Figure 3. Donations in the Amazon by Donor Type, 2013-2015 and 2016-2019		 30

Figure 4. Percentage of Overall Funding in the Amazon
          by Primary Grantee Type, 2016-2019							31

Figure 5. Percentage of Bilateral and Multilateral Funding
          in the Amazon by Grantee, 2013-2019							32

Figure 6. Percentage of Foundation and NGO Funding
          in the Amazon by Grantee, 2013-2019							34

Figure 7. Overall Funding in the Amazon by Primary Conservation
         and Sustainable Manawgement Strategy, 2016-2019					35

Figure 8. Foundation Funding in the Amazon by Primary Conservation
         and Sustainable Management Strategy, 2016-2019					36

4
Ac r o n y m s

AAF - Andes Amazon Fund & Bluemoon

AFD - French Development Agency (Agence Française de Développement)

ASL - Amazon Sustainable Landscapes Program

BEIS - UK Department for Business, Energy, and Industrial Strategy

BMU - German Federal Ministry of the Environment, Nature Conservation
       and Nuclear Safety

BMZ - German Federal Ministry of Economic Cooperation and Development

CAF - Development Bank of Latin America (Corporación Andina de Fomento)

CEPF - Critical Ecosystem Partnership Fund

CI - Conservation International

CIFF - Children’s Investment Fund Foundation

CLUA - Climate and Land Use Alliance

COP15 - UN Biodiversity Conference (COP15)

CWF - ClimateWorks Foundation

DEFRA - UK Department for Environment, Food and Rural Affairs

EU - European Union

FCPF - Forest Carbon Partnership Facility

FIP - Forest Investment Program

FAO - Organization for Food and Agriculture of the United Nations

FFEM - French Facility for Global Environment

GBMF - Gordon and Betty Moore Foundation

GCF - Green Climate Fund

GEF - Global Environment Facility

GGGI - Global Green Growth Institute

5
GIZ - German Development Agency
     (Deutsche Gesellschaft für Internationale Zusammenarbeit)

GRIF - Guyana’s REDD+ Investment Fund

GWC - Global Wildlife Conservation

IDB - Inter-American Development Bank

MAAP - Monitoring of the Andean Amazon Project

MACP - Margaret A. Cargill Philanthropies

MCFA - Mitsubishi Foundation for the Americas

MFA - Ministry of Foreign Affairs

NICFI - Norway’s International Climate and Forest Initiative

NORAD - Norwegian Agency for Development Cooperation

OECM - Other Effective Area-Based Conservation Measures

REDD+ - Reducing Emissions from Deforestation and Forest Degradation

REM - REDD+ Early Movers

RFN - Rainforest Foundation Norway

TNC - The Nature Conservancy

UK - United Kingdom

USAID - United States Agency for International Development

USFWS - United States Forest and Wildlife Service

WWF - World Wildlife Fund

6
F o r e w o rd

The Amazon basin plays an essential role in        The ASL, under the World Bank’s leadership,
regulating the climate and providing other         builds on efforts by the Gordon and Betty
ecosystem services, and it is home to the          Moore Foundation to track and understand
largest and most diverse forest on earth           donor investments for Amazon conservation
with rich biological and cultural diversity. Its   and seeks to advance knowledge and foster
protection,   conservation,   and   sustainable    greater collaboration. This study extends the
management are essential to guaranteeing           analysis of donor conservation funding for the
the social, environmental, and economic            2016-2019 period, providing a more recent
well-being of the Amazonian people and             view of how much money has been invested in
communities, states, and the rest of the world.    conservation across the Amazon basin and the
                                                   strategies donors are using. Together these
The Amazon Sustainable Landscapes Program
                                                   three studies have identified nearly US$4.8
(ASL) is an initiative funded by the Global
                                                   billion that has been invested in promoting
Environment Facility with an ambitious goal:
                                                   the protection and preservation of this region
to protect globally significant biodiversity and
                                                   since 2007.
implement policies to foster sustainable land
use and restoration of native vegetation cover.    This study aims to provide a starting point
The Program applies an integrated regional         for donors, countries, and civil society to
landscape approach by working at the local,        understand the current funding scenario,
regional, and national levels and includes three   begin critical conversations on how these

                                                                                                    COV E R A N D T H IS PAGE : N R PACAYA SA M I RI A - WA LT E R W US T (S E RN A N P)
countries in its first phase: Brazil, Colombia,    investments can be enhanced, and explore
and Peru.                                          how donors can work together to strengthen
                                                   and coordinate their efforts.
As ASL initiates a second new phase that
will bring together almost all the countries       The author and ASL team thank all the donors
across the basin, the Program has a unique         and their teams for helping to provide these
opportunity to coalesce different actors to        data and for their engagement in our efforts
share experiences and leverage successes           to drive collaboration and innovation that
toward its common goal. Promoting multi-           protects valuable biodiversity and promotes
stakeholder and multi-sectoral collaboration       sustainable land and water use in the Amazon.
and sharing among beneficiaries, partners, and
stakeholders will be essential to achieving the
                                                   Valerie Hickey
ASL goals.
                                                   Practice Manager, Environment, Natural
                                                   Resources and Blue Economy Global Practice

7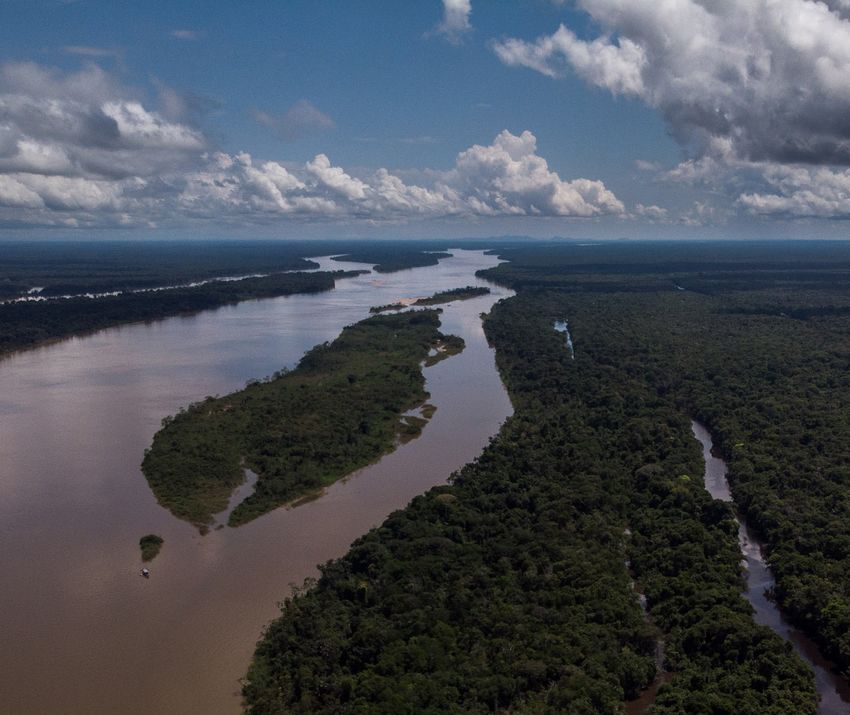
Ac k n ow l e d g m e n t s

The author wishes to thank the World Bank Amazon Sustainable Landscapes
team, in particular Adriana Moreira, Ana Maria Gonzalez Velosa, Hasita Bhammar,
and Sandra Berman, who provided early guidance and advice in the survey
design, identifying key contacts and review of this report. Valerie Hickey,
Practice Manager for the Environment, Natural Resources and Blue Economy
(ENB) Global Practice in Latin America and the Caribbean, provided valuable
suggestions and comments for the final report. Peer review for the report was
provided by Jorge Muñoz, World Bank Lead Land Administration Specialist;
Giovanni Ruta, World Bank Senior Environmental Economist; Avecita Chicchon,
Program Director for the Andes-Amazon Initiative from the Gordon and Betty
Moore Foundation; and Mark Zimsky, Biodiversity Coordinator, and Regional
Coordinator for Latin America, for the Global Environment Facility. Paulina
Arroyo from the Gordon and Betty Moore Foundation provided guidance,
encouragement, and support for the continuation of this study. Thais Vilela was
generous with her time and lessons learned to ensure a high-quality replication
of the survey. Nagaraja Rao Harshadeep (Harsh), Hrishikesh Prakash Patel, and
Isabel Maria Ramos Tellez from the World Bank Disruptive KIDS (Knowledge,
Information & Data Services) team skillfully applied their creativity and expertise
to create an online version of this report with dynamic data visualizations.
The author would also like to thank Renata Zincone for her graphic design work,
Jennifer Roche for revising and editing the text, Kalina Gibson for her support
in checking and validating data, and Cooper Wetherbee for providing valuable
technical support in automating the database for data collection.

8
We would also like to thank the numerous individuals from all the participating
organizations who were patient and supportive in providing input, answering
questions, and verifying data entries throughout the data collection process. Without
their support, this analysis would not be possible. Among these were we would
like to thank: Megan MacDowell and Keith Madden (Andes Amazon Fund); Ruth
Gutierrez and Felippe DeRosa (CLUA); Mark Zimsky and Teayeon Kim (GEF); Kristina
McNeff, Paulina Arroyo, Amy Juelsgaard, and Leonardo Fleck (GBMF); Corentin Genin
(Belgium); Traci Romine (Mott Foundation); Adam Smith (CI); Michele Zador (CEPF);
Eirik Brun Sørlie (Norwegian Embassy in Brasilia); Jessica Rosen, Ani Zamgochian,
Anna Toness, Michelle Jennings (USAID); Jenny Martinez (USFWS); Clemens Helbach
(BMU), Christina Tirler (GIZ/BMZ); Amanda Molennar and Mirko-de Ponti (Netherlands
MFA); Florence Van-Houtte (European Commission); Ines Susana Angulo de Aviles
(WB/FIP); Simon Whitehouse (WB/FCPF); Annette Bettina Killmer (IDB); Carolina
Jaramillo (GGGI); Renata Piazzon (Instituto Arapyaú); Marcia Soares (Fundo Vale);
Yelena Ortega (CIFF); Rodrigo Spuri (TNC); Jason Cole and Shelley Shreffler (MACP);
Justin Pepper (Bobolink); Mathieu Boche (AFD); Stephanie Bouziges-Eschmann
(FFEM); Angela Albernaz Skaf and Bernardo Raune (Amazon Fund); Ana Gutierrez
(UK); Livio Silva (Oak Foundation); Lars Løvold (RFN); Stefannie Zapata and Edgar de
Oliveira Rosa (WWF); Norma Rodriguez and Lucien Chan (Skoll Foundation); Claire
Poelking (MacArthur Foundation); Joseph Reganato (MCFA); Matt Foster (GWC);
Juliana Strobel (Fundación Avina); Jose Gomez (FAO); and Cecilia Guerra (CAF).

9                                                                   N P C H I R I BI QU E T E - A LVA RO GAV I R I A
Executive Summary

The Amazon has long been recognized as a repository for ecological services not only for
indigenous people and local communities, but also for the rest of the world. It spans about
40 percent of South America, covering eight countries (Bolivia, Brazil, Colombia, Ecuador,
Guyana, Peru, Suriname, Venezuela, and the overseas territory of French Guiana), and remains
the planet’s largest intact rainforest in terms of size and diversity. The Amazon serves as an
important carbon sink and plays a critical role in regulating temperatures and rain patterns.

Recognizing the global significance of the Amazon, the GEF-funded Amazon Sustainable
Landscapes Program (ASL) led by the World Bank commissioned this analysis to provide an
updated picture of international support for conservation and sustainable management of
natural resources in the Amazon. This study covers 2016 to 2019 and provides a follow-up to
previous studies commissioned by the Gordon and Betty Moore Foundation in 2014 and 2017
(Castro de la Mata and Riega-Campos, 2014; Strelneck and Vilela, 2017). This study maintains
the same format as the previously commissioned 2017 study to provide a deeper and continued
understanding of the largest donors and how they have directed their funding by country,
grantee, and strategy over time. The report also provides an overview of most of the grant
funding directed to the Amazon region.

Since 2007, these three studies have identified more than US$4.8 billion dollars of non-reimbursable
grants that have been invested from bilateral and multilateral agencies, foundations, international
environmental non-governmental organizations (NGOs), and private sector companies in Amazon
conservation. In addition, this study makes the funding data from 2013-2019 available in an
interactive data visualization dashboard for others to explore

               A tota l 49 f u n d i n g agencies pa r tici pate d i n
               the c u r rent s u r vey that covers i nvestments
               m ad e f ro m 2 016-2019.

                      $ 1.3 4
2007-2012                                                                       US$3 billion

                   $ 1.12 2
2013-2015                                                                       US$3 billion

                                $ 2 .3 3
2016-2019                                                                       US$3 billion

10
Key takeaways from the 2016-2019 analysis reveal:
● Donors provided US$2.33 billion in grants to promote and strengthen
conservation efforts in the Amazon.
● Germany and Norway accounted for over half of the total donations with
investments totaling US$611.2 million and $582.5 million, respectively.1
● Four of the top ten funders were bilateral government agencies,
three were multilateral agencies, two were private foundations, and one
international NGO.
● Multilateral agencies have emerged as significant conservation funders,
nearly doubling their contributions from 13 percent of total donations in
2013-2015 to 24 percent of total donations during the 2016-2019 period.
The most prominent multilateral funders include Global Environment
Facility (GEF), Green Climate Fund (GCF), and the European Union (EU).
● National governments received over half of the overall funding.
For the overall funding portfolio, national and international NGOs
made up an equal percentage (~15 percent) of the primary grantees.
Subnational and local governments received less (6 percent). When
looking specifically at foundations’ grantees, over half of the funding
went to international NGOs (52 percent), followed by national or
local NGOs (37 percent), and the remaining 11 percent was divided
between private sector, academic, and research institutes.
● The greatest proportion of funding was directed to support Reducing
Emissions from Deforestation and Forest Degradation (REDD+) programs
and policies, largely through results-based financing (US$479.7 million)
as well as initiatives to create and improve the management of protected
areas (US$334.8 million).
● Overall, donors continued their commitment to support conservation
and sustainable management throughout the basin, and new movements
emerged to attract new donors and impact investing.
1. Note that Norway and Germany’s contributions to Brazil’s Amazon Fund that have not yet been
awarded are allocated to future years (2020-2025). Norway has made the largest contribution
in direct bilateral aid to Amazon conservation, exceeding US$1.5 billion since 2013.
11This analysis provides valuable insight on funding for conservation and sustainable natural resources management in the Amazon and can be used to inform and strengthen donor coordination efforts. A key recommendation is to use this report to facilitate donor engagement to increase coordination, pool valuable resources, and avoid potential duplication. The report can also be used to promote more effective donor-government dialogues and bring the voices and perspectives from the recipient community to enhance coordination and improve funding practices. This funder tracking aims to help target investments, build synergies, and spur innovation to protect and conserve the valuable natural resources in the Amazon. The report also reveals how an even greater understanding of conservation can be achieved by continuing to gather data on international funding flows, enhancing analysis to include both reimbursable and non-reimbursable funds, and by identifying critical gaps in the current funding portfolio. 12 A MA N Ã - FUN B IO
Introduction

The Amazon Basin and the Role of Conservation
and Sustainable Management

The Amazon basin is widely recognized as the most diverse ecological region
on the planet and is essential to the region’s environmental, social, and
economic prosperity. It plays a critical role in global climate regulation, every
year absorbing nearly a quarter of carbon taken up by the world’s forests.
It is the single largest repository of biodiversity on the planet, with over
40,000 species of plants, 16,000 species of trees, 2,000 species of mammals
and birds, and 2,500 species of fish. One in ten known species in the world
lives in Amazonian ecosystems. The region includes 210 million hectares of
protected areas, around 3,000 indigenous territories covering over 200 million
hectares, and hosts 40 percent of the world’s remaining rainforest, including the
largest amount of wetland forests.2 About 33 million people live in the Amazon
watershed, including over 380 indigenous groups, all deriving their livelihoods
from its forests, rivers, and tributaries.

The Amazon and its diversity are threatened by deforestation, land degradation,
fragmentation, and the over-exploitation of the forest and freshwater ecosystems.
Deforestation has been recognized as a priority transboundary problem in the
Amazon region by the member countries. Despite national and international
commitments to halt deforestation, it is still a challenge for the region. In 2019
alone, more than 1.7 million hectares of Amazonian primary forest were lost
in Bolivia, Brazil, Colombia, Ecuador and Peru, according to figures from the
Monitoring of the Andean Amazon Project (MAAP).3

The COVID-19 pandemic has exacerbated the Amazon’s environmental
problems. Economic pressures and health crises have thwarted enforcement
efforts and undermined governments’ abilities to further protect the forest.
Illegal deforestation, mining, and other unsustainable activities have increased
since the beginning of the pandemic. The pandemic has also revealed the
inequities and high vulnerability of communities in the Amazon region where
the virus has rapidly expanded.

 2. See: https://www.sciencemag.org/news/2015/03/amazon-rainforest-ability-soak-carbon-
 dioxide-falling
 3. See: https://maaproject.org/2020/2019-amazon/

13
Around 17 percent of the Amazon forest has been lost in the last 50 years
and prominent scientists have warned that the loss of just 20 to 25 percent
more of the rainforest could send the Amazon to a point of no return, marking
an unstoppable transition to a drier, savanna-like ecosystem (Lovejoy and
Nobre, 2019). Coordinated action is urgently needed to prevent reaching the
no return point. Several investors have taken steps to green their portfolios and
promote more sustainable investment strategies with a focus on the Amazon.4
International organizations and foundations have increased their attention and
funding towards the region. The scientific community is working to identify
evidence and solutions to control these and other environmental threats.5 Finally,
national governments have continued committing and manifesting interest in
promoting, through policies and plans (such as the 2019 Leticia Pact6), specific
actions to conserve the Amazon ecosystems, acknowledging the role ecosystem
services have in contributing to their citizens’ well-being. This study comes at
a time where national and international discussions, such as the UN Biodiversity
Conference (COP15) among others, are planned to strengthen the conservation
of the world’s natural resources and make decisions on resource allocation to
promote that goal.

Amazon Sustainable Landscapes Program

Recognizing the urgent need to reduce deforestation and facilitate a regional
approach to curb the growing pressures in the Amazon, the Global Environment
Facility (GEF) approved the Amazon Sustainable Landscapes Program (ASL)
under its sixth replenishment period as an integrated program aiming to protect
globally significant biodiversity and implementing policies to foster sustainable
land use and restoration of native vegetation cover.

 4. See: 2019 statement endorsed by 251 investors representing approximately US$17.7 trillion
 in assets; See also BlackRock’s Client Letter for a New Standard of Investing from 2020.
 https://www.blackrock.com/corporate/investor-relations/blackrock-client-letter
 5. For example, with support of the United Nations Sustainable Development Solutions Network,
 the Science Panel for the Amazon (SPA) has been put in place to contribute with knowledge
 and experience to an assessment of the state of the diverse ecosystems, land uses, and climatic
 changes of the Amazon and their implications for the region. www.theamazonwewant.org
 6. Signed in September 2019 between Colombia, Bolivia, Brazil, Ecuador, Guyana, Peru, and
 Suriname, the Leticia Pact includes commitments to generate a joint response to disasters
 that may arise in any country within the Amazon region; strengthens regional actions to curb
 deforestation, and advances the generation of scientific knowledge. Point 16 of the Leticia Pact
 specifically refers to the second phase of the ASL.

14
The ASL, with the World Bank as the lead agency, takes a regional approach to
improve integrated landscape management and conservation of ecosystems in
targeted areas in the Amazon region. The Program operates under the rationale
that if the following goals are met, then the protection of significant biodiversity
and the integrity of the ecosystem services of the Amazon region can be
achieved: (a) An adequate area of the Amazon is conserved under various
regimes (protected areas and indigenous lands); (b) Agriculture, degraded, and
forest lands are managed sustainably and restored with zero illegal deforestation
tolerance; (c) National policies and strategies support sustainable development
that minimizes deforestation and loss of ecosystem services; and, (d) Capacity
of and regional cooperation among key players is improved.

ASL currently includes national projects in Brazil, Colombia, and Peru (led
by theirs Ministries of Environment), and a regional project that aims to
strengthen coordination, access to information, and capacity of the national
projects’ stakeholders. The World Bank (as lead agency), World Wildlife
Fund (WWF), and United Nations Development Programme (UNDP), serve
as GEF implementing agencies for the projects. The program is expanding.
GEF approved a second phase with the participation of Bolivia, Ecuador,
Guyana and Suriname, and the UN Food and Agriculture Organization (FAO)
and Corporación Andina de Fomento (CAF) development bank will serve as new
agencies.

The World Bank, as the leader of the Program and Amazon Coordination
Technical Assistance project, is responsible for guiding the national projects
towards common goals and the expected transformational changes, fostering
intergovernmental, multi-sectoral and multiagency cooperation, tracking
program-level progress, promoting south-south learning and capacity building
opportunities, and developing communication and awareness raising strategies.

One of the key activities of this regional project is to support a donor coordination
exchange platform. The platform will allow a better understanding of the current
financing flows for conservation and sustainable management, and potential
investments in the Amazon for all stakeholders. This, in turn, will build stronger
collaboration and learning lessons that, together, will help implement more
effective strategies for the conservation and sustainable development in the
Amazon. This study also represents a step towards the donor coordination
exchange platform.

15
About this Report: Tracking Funding within
the Amazon, 2007 - 2019

In 2014 and 2017, the Gordon and Betty Moore Foundation (GBMF), an important
partner and co-financier of the ASL, commissioned two studies to understand
the funding for conservation in the Amazon region and identify potential gaps
and needs (Castro de la Mata and Riega-Campos, 2014; Strelneck and Vilela,
2017). These products created an important baseline for the donor community
and others to understand the amount of non-reimbursable finance flowing to
the region and the strategies used.

Building on these GBMF-commissioned studies and recognizing the global
significance of the Amazon, the ASL coordination team conducted this new
analysis to provide an updated picture of the depth and breadth of international
support for conservation covering the 2016-2019 period (see Table 1 for an
overview of these studies).

TAB L E 1 . OV E RV I EW O F S T UD I ES ON I NTE RNATIONAL
CO N S E RVAT IO N FUN D I NG I N TH E A M AZON

                          Title            Fu nder           Study Perio d

 An Analysis of International            G ordon a nd
 Conservation Funding                    Betty Mo ore          2007-2012
 in the Amazon                            Fou ndation

 International Conservation              G ordon a nd
 Funding in the Amazon:                  Betty Mo ore           2013-2015
 An updated analysis                      Fou ndation
 ●Amazon Funding Tool for
 2013-2015

     International Funding for
     Amazon Conservation and                  Amazon
     Sustainable Management:             Susta i na ble        2016-2019
     A Continued Analysis of Grant       L a ndsca p es
     Funding across the Basin                 P ro g ra m
     ●Interactive Data Visualization
     Dashboard for 2013-2019

16
This new study maintains the same format as the previously commissioned
2017 study to provide a deeper understanding of which donors provide the
most support, how their funding has evolved over time, and how they direct their
funding by country, grantee, and strategy. Given the methodological differences
between the first and second study, this report does not compare results to the
first study period (2007-2012).
Understanding funding trends provides essential information about donors’
interests and priorities. Most donors’ decisions are demand-driven, responding
to explicit local or national level priorities and needs manifested by the recipients.
However, this kind of tracking is not an easy task as it requires mapping a spread
of resources across multiple countries from diverse donors, including bilateral
agencies, multilateral agencies, private foundations, and a broad spectrum of
NGOs, as well as private sector actors. These donors have different approaches,
procedures, processes, and systems, and collecting this funding data can be
complex and time-consuming.
This analysis is intended to promote dialogue among donors and facilitate
collaboration as the philanthropic community seeks to maximize the impact
of their investments. Since 2007, these three studies have identified more than
US$4.8 billion dollars of non-reimbursable grants that have been invested in
Amazon conservation.
17
R N PACAYA SA M I R I A - WA LT E R WUST (SE R N A N P)Approach to Identifying the
I n t e r n a t i o n a l D o n o r Fu n d i n g
Landscape of the Amazon Basin
Overview
This study aims to provide a high-level assessment of international donor
funding that has been allocated across the Amazon to strengthen and promote
conservation of its natural resources. The study focuses on capturing and
quantifying non-reimbursable funding towards conservation from 2016 to 2019.
More specifically, this study aims to answer the following questions:
● How much was invested in conservation in the region through non-
reimbursable grants from 2016 to 2019?
● How does this amount compare to what was invested in conservation
in the region from 2013 to 2015?
● Who are the largest international funders of conservation in the Amazon?
● What is the primary conservation and sustainable management strategy
of their investments?
● Which countries and types of organizations are the largest recipients of
these funds?
● Does the strategic focus of the investments vary by funder type?
As a descriptive analysis, this study does not evaluate the impact these
investments have had on conservation and sustainable management or quantify
the gap between what is needed and what is pledged. This analysis uses the
same methodologies and survey categories from the 2017 study, thus providing
a broader picture of international support for conservation from 2013-2019,7
and providing an important next step toward further analysis and donor dialogue
as indicated in the recommendation section. An online data visualization tool
Data Visualization Dashboard is also available as part of this analysis so that
policymakers and funders can explore the data in greater depth.
7. See Strelneck and Viela (2017) for an explanation of methodological improvements
implemented in 2017 study. Given these changes and the data available from the previous
study, a full panel of data from 2007-2019 is not possible.
18Study Criteria Time frame: The analysis focuses on projects that were approved from January 1, 2016 to December 31, 2019. In order to preserve a clear cut off date to facilitate future surveys, no projects that started from 2020 onwards were included, even though some donors provided information about grants that were approved in the first quarter of 2020. Data in this study for 2020 forward represent committed allocations for grants approved in 2019 or before. Commitments vs. Disbursements: Funds included in the study represent donor commitments. In a few cases, primarily with international NGO donors, funding represents disbursement data instead of committed funds. For multilateral organizations, the disbursed amounts may vary from the original commitment estimates. Funding commitments were divided evenly across the number of award years to estimate investment across the years; they do not represent actual annual disbursements as data was not uniformly available.8 Currency: Cumulative project funds from different international donors are converted to US dollars, based on the award year. These are then divided between the recipient countries and averaged across the number of years for each project. 8. Methodologically this may overestimate the rate of increase in cases when project disbursement is slow initially, but it does provide an estimate of average investments over time. 19
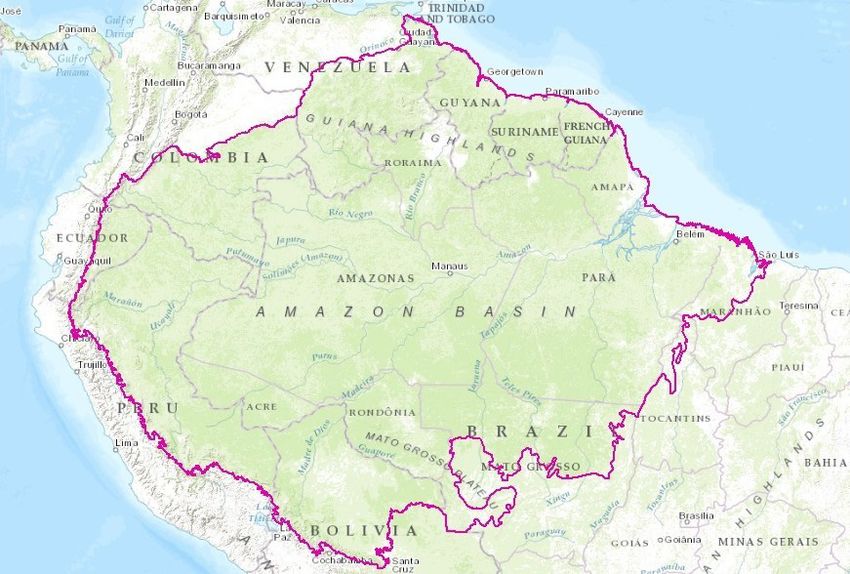
Geographic focus: The study includes projects both funded and implemented
in the Amazon basin, including in the following countries or territories:
     1.         Bolivia
     2.         Brazil
     3.         Colombia
     4.         Ecuador
     5.         French Guiana9
     6.         Guyana
     7.         Peru
     8.         Suriname
     9.         Venezuela

     10.        Basin-wide - Used as a category when donors have a basin-
		              focused intervention or when a project is implemented in

     		         multiple countries, and the donor is unable to specify a breakdown
		              of funding across countries.

                                                                            MA P RA I S G BI O G EO G RA FI CO

 9. French Guiana is an overseas department and region of France. As such, it is not eligible to
 receive funding from a number of donors. It is not included in the analysis from this report but
 the data can be explored in the online tool. For the study, it was possible to track that, between
 2013-2019, French Guiana received US$3.88 million primarily from NGOs and multilateral
 agencies. It only received $40,000 from bilateral donors and did not receive any support from
 surveyed foundations.

20
Donor types: Donors are grouped into one of the following categories:
1. Bilateral institutions
2. Multilateral institutions
3. Foundations
4. International NGOs
5. Private sector funders
Grantees: Recipients are put into one of the following categories:
1. National governments
2. Subnational or local governments
3. International NGOs
4. National or local NGOs
5. Academic institutions
6. Researchers or research groups
7. Private sector or entrepreneurs
8. Not specified10
9. Other11
Conservation and sustainable management strategies: This survey preserves
the same categories of strategies used in the 2017 survey (see Table 2). These
strategies differ from those originally mapped in the 2014 survey.12 While
foundations provided more nuanced breakdowns of their funding by strategy,
many bilateral and multilateral donors do not track or could not share this
level of detail. In addition, primary strategies capture donor intent, rather than
implementation approaches used by organizations on the ground.
10. This category is used for funding from the German Ministry for Economic Cooperation and
Development (BMZ)
11. This category is primarily used to denote unallocated donations to the Amazon Fund from
the Norwegian and German governments, as well as Petrobras.
12. The 2017 study identified a different list of strategies than those used in the 2014 study,
thus comparisons by strategy with the first study are not possible.
21TA B L E 2 . P RI MARY CO NS E RVATION AN D SUSTA I NAB L E M A NAGE M E N T
S T RAT E G I E S AN D O BJECT IV E S
CONSERVATION AND SUSTAINABLE MANAGEMENT STRATEGY GENERAL STRATEGIC OBJECTIVE
Analysis: Strategic, Economic, or Technical Analyzing and comparing conservation approaches, policies, economic
evaluations, or strategies
Big Infrastructure Mitigating the negative impact of road development, dams, and other large
physical infrastructure projects
Capacity Building, Education, Training Providing institutional support or training to enable civil
society, indigenous, commercial, or government interests to fulfill
conservation roles
Climate Change Adaptation Increasing social and ecological resilience and reducing risks of the likely
impacts of climate change
Climate Change Mitigation (non-REDD) Efforts to reduce or sequester greenhouse gas emissions
and thus reduce climate change (non-REDD)
Commercial Agriculture Mitigating the negative impact of large-scale commercial agriculture
(beef, soy, coffee, etc.)
Compliance/Enforcement Civil society or governments conducting oversight of landholders, companies,
banks, policy institutions, international markets, agreements, etc.
Extractive Resources Mitigating the negative impact of mining, oil/gas, etc.
Governance Systems Enabling civil society, indigenous, commercial, or government interests to
organize and govern effectively
Indigenous Peoples & Lands Supporting the ability of indigenous peoples to lead the
management and conservation of forest regions
Integrated Landscapes, Land Use Planning integrating multiple and/or holistic landscape
management approaches in specific geographic areas
New Finance Mechanisms Developing new types of funds or financial market mechanisms
that draw more conservation funding into the Amazon
Payment for Ecosystem Services (PES) Developing markets or enterprises to value and compensate forest stewards
for ecosystem services like water, pollination, genetic diversity, etc.
Protected Areas Creation & Management Developing, strengthening, and maintaining Protected Areas
Public Communications & Transparency Shifting politics, consumer behavior, or compliance by generating and
distributing public information
Public Policy Development & Administration Developing and administering national, local, and international public policies
to strengthen Amazon conservation (non-REDD)
REDD+ Programs & Policies Design or implementation of Reducing Emissions from Deforestation and
Forest Degradation (REDD+) policies, methodologies, programs, projects
targeted at the Amazon
Rural Livelihoods Reducing poverty and fostering sustainable local economies,
thus shifting the destructive & constructive pressures on forests
Science Research & Analysis Scientific research or rapid assessments of ecology, species, or climate
Species Conservation Focus on protection or trafficking of species of plants or animals
Timber/Forestry Mitigating the negative impact of commercial timber harvesting
Upstream Markets & Value Chains Changing international business practices and consumer markets in ways
that reduce Amazon deforestation
Not Specified Donor preferred not to list a primary conservation strategy
Other Other primary strategies not included on this list, or unclear primary
strategies based on the available data
22Data Gathering
The study employed a variety of approaches to gather data from a wide range
of funders with an environmental or climate focus. First, a virtual meeting was
held with conservation donors to introduce the objectives of the study and
promote engagement and participation. Questionnaires were sent to funders,
and follow-up interviews with donor representatives were used to verify data
and avoid any possible duplication with the previous study. Donors were also
provided, when possible, with their data from the previous study to facilitate
completion and ensure consistency in the distribution of funding along the
established categories. In a few cases, as per donors’ request, revisions or
additions were made to previously included data.
Researchers also contacted funders working in the region who had not
participated in previous survey rounds but whose donations to the Amazon
region were important to include. Some of these agencies also chose to provide
data prior to 2016. This is important to highlight since the 2013-2015 numbers
differ slightly from data previously reported.
Online searches for funding data were also used to verify and supplement data
provided by donors. Follow-up conversations and correspondence with the
donors were an important element of the study as they enhanced the quality of
the data provided. Overall, 96 percent of the donors in the study responded to
the survey questionnaire to provide the data.
This study leverages the database tool to store, analyze, and search the data
that was previously developed by GBMF. This facilitates comparisons and helps
to identify and eliminate possible duplications.
Important Considerations about the Data
This study maintains consistency with the one previously conducted in 2017 by
tracing funding back to its original source. This approach helps avoid double
counting and provides a more accurate picture of funding levels to the region;
however, it also represents two important trade-offs:
1. Loss of precision in the primary conservation strategies: The primary
conservation strategies in this analysis reflect donor intentions, but, on
the ground, their awards may have been implemented using a variety of
different strategies. For example, donors working on understanding mining
in the Amazon may have classified their work under analysis or capacity
23building and training rather than extractive resources, or, alternatively, under
indigenous peoples if the work aims to support increasing safeguards for
indigenous communities. This was especially true for some bilateral and
multilateral donors that award larger sums and are unable to accurately
break down and assign amounts among the multiple strategies.
2. Primary grantees: The grantee categories in this study reflect the
primary grant recipient and not subsequent regranting or contracting that
national governments or international NGOs may do.
When possible, researchers tried to address these trade-offs. For example,
Brazil, Colombia, and Guyana have REDD+ mechanisms to raise donations
for non-reimbursable investments in efforts to prevent, monitor, and combat
deforestation. In the case of Brazil’s Amazon Fund, donation amounts were
allocated back to their original donors (Norway, Germany and Petrobras), and
detailed information on funded projects allowed researchers to break down
those contributions by more nuanced conservation strategies and by grantees.13
Funding totals for Colombia’s Amazon Vision Program as part of the REDD+
Early Movers (REM) Program (supported by Norway, Germany and the UK)14
and Guyana’s REDD+ Investment Fund (GRIF) (funded by Norway)15 were also
traced back to the original bilateral donors, but they were all assigned under
the REDD+ Programs and Policies strategy directed to national governments.
The conservation funding captured in this survey does not include funding
from host countries. While host country funding is undoubtedly important,
it also poses a substantial risk of being double counted given that national
governments also represent a significant funding recipient.
Survey efforts did not include systematic data collection from the private
sector and thus funding may be under represented in this study.16 NGO donor
amounts include funds raised from individual donors, the private sector, and
other organizations for conservation efforts.
The approach to trace data back to the original source, while entailing certain
trade-offs, ultimately ensures a more accurate picture of funding trends over
time and avoids the duplication of funding that flows through the complex web
of funders and NGOs in the region.
13. See: http://www.amazonfund.gov.br/en/home/
14. See: https://visionamazonia.minambiente.gov.co/en/
15. See: https://www.guyanareddfund.org/
16. Private sector support in the data is primarily represented by Petrobras’s support of the
Amazon Fund and specified co-funding for projects from the GEF.
24R e su l t s
Respondents
Efforts were made to include donor agencies that previously participated
in the 2017 GBMF report and to expand the funder base, resulting in 49 total
donor respondents, 96 percent of which provided survey responses via the
questionnaire. (See Table 3.) Data for donors who did not respond were collected
from secondary sources as in the previous studies. See Appendix 1 and 2 for a list
of donors included in the previous studies.
TAB L E 3. LIS T O F D O NO RS I NCLU DE D I N 2016-2019 STU DY
NGO Private S e c tor
Conservation International (CI) Petrobras
Critical Ecosystem Partnership Fund (CEPF) Various
Global Wildlife Conservation (GWC)
Rainforest Foundation Norway
The Nature Conservancy (TNC)
World Wildlife Fund (WWF)
Mu lti latera l
Corporación Andina de Fomento (CAF)
European Union (EU)
Fou ndation Forest Carbon Partnership Facility (FCPF)
Forest Investment Program (FIP)
Anonymous foundations17
Green Climate Fund (GCF)
Andes Amazon Fund & Bluemoon (AAF)
Global Environmental Facility (GEF)
Climate and Land Use Alliance (CLUA)
Global Green Growth Institute (GGGI)
Children’s Investment Fund Foundation (CIFF)
Inter-American Development Bank (IDB)
ClimateWorks Foundation (CWF)
Organization for Food and Agriculture (FAO)
Charles Stewart Mott Foundation
Ford Foundation
Fundación Avina
Fundo Vale Bi latera l
Gordon and Betty Moore Foundation (GBMF) Belgium
Instituto Arapyaú France (AFD, FFEM)
MacArthur Foundation Germany (BMZ, BMU)
Margaret A. Cargill Philanthropies (MACP) Korea
Mitsubishi Foundation for the Americas (MCFA) Netherlands
Oak Foundation Norway (NORAD, NICFI, MFA)
The Overbrook Foundation United Kingdom (BEIS, DEFRA)
Skoll Foundation United States of America (USAID, USFWS)
17. Anonymous foundations include philanthropic funders that requested their funding details
remain confidential.
25Aggregate Conservation Funding by Recipient Country
Between 2013-2019, the donors included in the study invested over US$3.45
billion. Figure 1 illustrates how conservation funding has substantially increased
from US$295 million in 2013 to US$653 million in 2019. Nearly all of the
countries across the basin have experienced increases in funding. While Brazil
continues to receive the largest amount of the overall funding, its percentage
of the total funding has reduced over time from 52 percent to 42 percent.
Significant increases in funding for Colombia and Guyana are, in part, related to
results-based funding from REM and GRIF. Over the period, Venezuela received
less than US$5 million, nearly 90 percent of which was committed prior to 2018.
F IGU R E 1 . TOTAL CO NS E RVAT ION A N D SUSTAI NAB L E M A NAGE M E NT
FUN D I N G I N T H E AMAZO N BY COU NTRY BY YEA R
(in millions) $100 $200 $300 $400 $500 $600 $700
2013
2014
2015
2016
2017
2018
2019
Brazil Peru Colombia Guyana Ecuador Basin wide Bolivia Venezuela Suriname
26Donors
Over the most recent study period from 2016 to 2019, donors invested
US$2.33 billion (see Figure 2). Bilateral support remained an important source
of funding with Germany and Norway providing over half of the overall funding
in the region, US$611.2 million and $582.5 million, respectively. The United
States contributed 6 percent of the total funding (US$136.2 million) during
the 2016-2019 period, and the United Kingdom investments accounted for
3 percent (US$65.2 million).
Multilateral donors have emerged as important conservation funders. GEF
financing18 accounted for 10 percent of all conservation funding during the
most recent period, exceeding US$233.9 million, while the European Union (EU)
and the Green Climate Fund (GCF) emerged as new top funders, contributing
6 percent and 4 percent, respectively.
18. Note that GEF funds are available to developing countries and countries with economies
in transition to meet the objectives of the international environmental conventions and
agreements. GEF has received contributions from 40 donor countries (see: https://www.thegef.
org/partners/countries-participants). Funds allocated to the GEF by its member countries are
assigned to the GEF and not as bilateral funding contributions in this study.
P N C H I RI BI QU ETE - A LVA RO GAV I RI A
27F IGU R E 2 . D O NO R FUN D I NG I N TH E AM A ZON, 2016-2019
Germany (BMZ, BMU)
Norway (NICFI, NORAD, +)
Global Environment Facility (GEF)
EU
USA (USAID, FWS)
Gordon and Betty Moore Foundation
Green Climate Fund (UNFCCC)
United Kingdom (DFID, DEFRA, DECC)
World Wildlife Fund
Andes Amazon Fund & Bluemoon
Forest Investment Program (FIP)*
Interamerican Development Bank
Conservation International
C. S. Mott Foundation
Corporacion Andina de Fomento (CAF)
Forest Carbon Partnership Facility (FCPF)*
Margaret A. Cargill Phinathropies
Climate Works
Ford Foundation
Anonymous Foundation
Rain Forest Foundation Norway
Belgium
Children's Investment Fund Foundation (CIFF)
Netherlands
France (AFD, FFEM)
MacArthur Foundation
Private Sector
Denmark - DANIDA
Critical Ecosystem Partnership Fund (CEPF)
Global Wildlife Conservation
Food and Agriculture Organization of the United Nations
Bobolink Foundation
Fundo Vale
Fundación Avina
UN-REDD
Mistsubishi Foundation for the Americas
Others (emerged as a new top funder working to coalesce financing to create and
support protected areas.19
The top conservation donors in the Amazon have shifted over time. Table 4
shows which donors made the largest contributions in the 2013-2015 period
compared to those in the 2016-2019 study period.
TA B L E 4 . TOP 10 CO NS E RVAT ION AN D SUSTAI NA B L E M ANAGE M E NT
D O N O RS I N T H E AMAZO N
2013-2015 2016-2019
1 . G er m a ny 1. G er ma ny
2 . N o r way 2 . No r way
3. USA 3. Gl o b a l Env i ro n ment a l Fac i l i t y
4 . Gl o b a l Env i ro n m e nt a l Fa c i l it y 4. Eu ro p ea n Un i o n
5. G o rd o n a n d Bet t y M o ore Fo u n d at i o n 5. USA
6. Corporación Andina de Fomento 6. G o rd o n a nd B et t y Mo o re Fo u nd at i o n
7. U n i te d Ki n g d om 7. Gre en Cl i mate Fu nd
8. Fundo Vale 8 . Un i te d Ki ng d o m
9. Wo r l d Wi l d l ife F u n d 9. Wo r l d Wi l d l i fe Fu nd
10. Interamerican Development Bank 10. A nd es A mazo n Fu nd
Red indicates donors that were not in top ten Green indicates donors that entered top ten in 2016-2019
in 2016-2019
While Germany, through the Federal Ministry of the Environment, Nature
Conservation and Nuclear Safety (BMU) and the Federal Ministry of Economic
Cooperation and Development (BMZ), has allocated larger sums over the study
periods, it is worth noting that Norway’s conservation funding commitments as
of December 2019 exceeded those of all other donors, totaling US$1.53 billion.
However, this is not reflected in the list above because a portion of this total
funding amount has been committed to the Amazon Fund but has not yet been
awarded and thus is allocated to future years starting in 2020.
19. Funding for the Andes Amazon Fund from the Gordon and Betty Moore Foundation and the
Bobolink Foundation was traced to original sources. This amount represents financial support
from the sunset Bluemoon Fund and the Wyss Foundation.
29Funding by Donor Agency
A breakdown of donor contributions between the two study periods confirms
the emergence of multilateral donors as an increasingly important source of
conservation funding as shown in Figure 3. For the 2013-2015 period, bilateral
donors made up 73 percent of the total US$1.12 billion in investments, followed
by multilateral donors (13 percent), foundations (12 percent) and international
NGOs (2 percent). For the 2016-2019 period, total funding increased to
US$2.33 billion, of which bilateral contributions dropped to 62 percent of that
total and multilateral support increased to 24 percent. Despite considerable
increases in the total funding amount, private foundations kept pace, making up
11 percent of the total donations, followed by international NGOs (3 percent)
and the private sector (less than 1 percent).
FIGURE 3. D ONATIONS I N TH E AMAZON BY D ONOR T YPE,
2013-2015 AN D 2016-2019
2 013 - 2 0 15 201 6 - 201 9
0% 2% 0% 3%
12% 11%
13%
73% 62% 2 4%
Bilateral Multilateral Foundation NGO Private Sector
30Funding by Grantee
The destination of funding by primary grantee has remained relatively steady
since 2013 with nearly half of all funding going to national governments. Figure 4
breaks down funding by grantee for the 2016-2019 period. It shows that 52% of
the overall funding went to national governments, an increase from 47% in the
previous study period. This was heavily influenced by the sizable bilateral and
multilateral contributions that flowed to national governments. Often this funding
is funneled down eventually to subnational government agencies, national
and local NGOs, or other implementing agencies by the primary grantees.20
Of the overall funding, nearly equal amounts were directed to international and
national NGOs (~15 percent) with only 6 percent going directly to sub-national
or local governments as a primary grantee. Other kinds of grantees received
6 percent as well, while research and academic institutions together received
only 4 percent of conservation and management funding, and the private sector
accounted for 3 percent.
FIGURE 4. PE RCE NTAGE OF OVE RALL FUN DI NG
I N TH E AMAZON BY PRI MARY GRANTE E T YPE, 2016-2019
1% 3% 3%
6%
6%
52 % 14%
15 %
Sub-national or
1% Academic Institutions 6% Local Governments 15 % National or local NGOs
Researchers or National Governments
3% Reasearch Institutions 6% Other 52%
3% Private Sector or Entrepeneurs 1 4% International NGOs
20. Allocated funding from the Amazon Fund is classified by secondary grantee
(e.g., the type of implementing agency receiving funding from the Amazon Fund).
31Figure 5 shows bilateral and multilateral funding by grantee for the full 2013-
2019 period. The breakdown of the US$2.25 billion in bilateral funding was
like that of the overall funding levels with (51 percent) directed to national
governments. There was a slightly higher percentage of bilateral funding
directed to sub-national or local governments (12 percent) and national or
local NGOs (12 percent), while 10 percent went to international NGOs, and the
remaining 15 percent was divided among other, research institutes, academic
institutes, and private sector/entrepreneurs. Of the US$693.7 million awarded
by multilateral agencies from 2013-2019, 83 percent was directed to national
governments, 7 percent to national or local NGOs, 5 percent to international
NGOs, and the remaining funding to other agencies, subnational governments,
research institutions, and the private sector.
FIGURE 5. PE RCE NTAGE OF BI L ATE RAL AN D MULTI L ATE RAL
FUN DI NG I N TH E AMAZON BY GRANTE E, 2013-2019
Percentage of Bi latera l Fu nd i ng by Gra ntee, 2013-2019
1% 3%
3%
12%
8%
51%
10%
12%
Sub-national or
1% Academic Institutions 12% Local Governments
12 % National or local NGOs
Researchers or National Governments
3% Reasearch Institutions 8% Other 5 1%
3% Private Sector or Entrepeneurs 1 0% International NGOs
32Percentage of Mu lti latera l Fu nd i ng by Gra ntee, 2013-2019
0% 1%2%
2%
5%
0% 7%
8 3%
Sub-national or
0% Academic Institutions 2% Local Governments
7% National or local NGOs
Researchers or
0% Reasearch Institutions 2% Other 83% National Governments
1% Private Sector or Entrepeneurs 5% International NGOs
Foundations and NGOs showed a very different pattern, directing funds to
NGOs and other kinds of institutions with no direct initial financial support to
governments (see Figure 6).21 Since 2013, foundations have allocated nearly
half of their funding to international NGOs (49 percent) and national NGOs
(41 percent) as primary grantees. The rest of their funding has supported
conservation and sustainable management efforts led by academic institutions
(4 percent) and research institutions (3 percent), and to a lesser extent the private
sector, governmental, or other agencies. NGO funding, which represents funds
that have been leveraged from individual fundraising, the private sector, and a
limited number of other foundations, were primarily directed to national or local
NGOs (51 percent), invested to support their own international NGO programs
or operations (25 percent), or passed on to private sector/entrepreneurs
(18 percent) or other agencies (6 percent).
21. It is worth noting that some foundations fund NGOs that in turn fund government programs.
For example, the GBMF has allocated funds to non-governmental institutions managing
transitions funds that then finance national government interventions in protected areas (Funbio
for ARPA, Profonanpe for SERNANP for Patrimonio del Perú).
33FIGURE 6. PE RCE NTAGE OF FOUN DATION AN D
NGO FUN DI NG I N TH E AMAZON BY GRANTE E, 2013-2019
Percentage of Fou ndation Fu nd i ng by Gra ntee Type, 2013-2019
4% Academic Institutions
0% 4 % 3 %
Researchers or
1% 3% Reasearch Institutions
1%
1% Private Sector or Entrepeneurs
1% Sub-national or
1% Local Governments
4 1% 1% Other
49 % International NGOs
4 9% 41% National or local NGOs
0% National Governments
Percentage of NGO Fu nd i ng by Gra ntee, 2013-2019
0% 0 % 0% 0% Academic Institutions
18 % Researchers or
0% Reasearch Institutions
0% 18 % Private Sector or Entrepeneurs
Sub-national or
0%
6% Local Governments
51%
6% Other
25% International NGOs
25%
5 1% National or local NGOs
0% National Governments
34Allocations across Conservation and Sustainable
Management Strategies
Previous studies have shown how donors’ primary conservation and sustainable
management strategies have changed over time. During the first period (2007-
2012), donors focused on legislation, policies, and law enforcement/compliance,
which shifted to protected area creation, management, and finance during the
second period (2013-2015). This third study period (2016-2019) reveals a donor
focus on REDD+ programs and policies, protected areas creation/management,
and integrated landscapes and land use planning (see Figure 7). As discussed
previously, these strategies reflect donor intent, better capturing the motivation
for the funding than perhaps the implementation strategies. While one donor
may classify a project to advance anti-deforestation policies, such as Public
Policy Development & Administration, another may consider their project as
part of a REDD+ Programs and Policies strategy. Likewise, a grant that aims to
strengthen Species Conservation may also overlap with efforts to improve the
Creation and Management of Protected Areas.
FIGURE 7. OVERALL FUNDING IN THE AMAZON BY PRIMARY
CONSERVATION AND SUSTAINABLE MANAGEMENT STRATEGY, 2016-2019
REDD Programs & Policies
Protected Areas Creation & Mgmt
Integrated Landscapes, Land Use Planning
Indigenous Peoples & Lands
Public Policy Development & Admin
Compliance/Enforcement
Capacity Building, Education, Training
Rural Livelihoods
Governance Systems
Timber/Forestry
Not Specified
New Finance Mechanisms
Science Research & Analysis
Climate Change Adaptation
Upstream Markets & Value Chains
Big Infrastructure
Extractive Resources
Commercial Agriculture
Other
Species Conservation
Payment for Ecosystem Services (PES)
Climate Change Mitigation (non-REDD)
Analysis: Strategic, Economic, or Technical
Public Communications & Transparency
$0 100,000,000 300,000,000 500,000,000
200,000,000 400,000,000
35You can also read