A Decade of Cards 2000 - 2010 and beyond
←
→
Page content transcription
If your browser does not render page correctly, please read the page content below
A Decade of Cards
2000 - 2010… and beyond
A Decade of Cards
2000 - 2010… and beyond
The decade in numbers: An overview
The 2000s see plastic come of age as credit and debit cards dominate the way we pay; by
2010, cash loses its crown as top method of consumer payment for the first time in history
as debit card spending continues to grow.
Consumers find debit cards more appropriate for daily use, but still value credit cards for
large purchases and for additional consumer protections – 1.5 million fewer adults use a
credit card each month in 2010 compared to 2005.
74.6 million credit and charge cards are in issue by 2005, up from 50 million in 2000; this
compares to 67 million debit cards in 2005, up from 49.7 million in 2000.
By 2010, credit cards in issue fall back to 55.6 million, with a further 6.6 million charge
cards – many dormant accounts are closed. At the same time debit cards have continued
their rise – by 2010 there were 84.6 million in circulation.
Credit card spending reaches £124 billion in 2005 but levels off in second half of decade as
debit card usage takes off. 98% of card spending growth between 2005 and 2010 is on
debit cards.
Use of cards instead of cash and cheques enables the growth of a new industry – internet
retailing. In 2000, two per cent of card spending is online. This is 13% in 2010 and will
keep growing.
Average spend on credit and charge cards rises in the second half of the decade, reaching
£2,151 per card in 2010 as multiple card holding falls and dormant accounts are closed. At
the same time, the number of accounts paying their balance in full each month rises from
55% to 62%.
Over six and a half billion transactions are made on debit cards in 2010 to a value of £299
billion, compared to two billion credit card purchases, totalling £111 billion.
Credit cards are still favoured for use overseas. 63% of overseas card spending by value is
on a credit card in 2010, although this is down from 86% in 2000. Debit cards are
increasingly widely accepted and account for 37% of overseas card spending by value in
2010, but much more in terms of the number of transactions.
Cash acquisition overseas moves from credit cards to debit cards, shrinking from 28% of
cash taken out on a card to 10% by 2010. Travellers acquire £7 billion on all cards in
2010, up from £2 billion in 2000.
In the UK, £3.8 billion is taken out on credit cards in 2010, down from £9.2 billion in 2005.
Debit card cash withdrawals hit £172 billion in 2010, more than doubling since 2000.
Borrowing on credit cards peaks at £69 billion in April 2006, falling to £58 billion
in 2010. It is likely that student loan debt will exceed credit card debt within three years.
Card crime falls sharply as industry moves to keep ahead of criminals. Fraud losses fall
40% in 2010 compared to their 2008 peak and are lower than at any time since 2000.
Page 1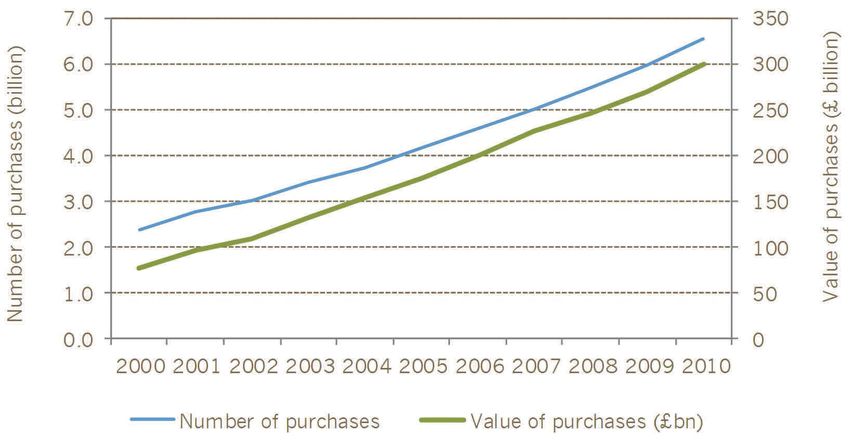
1.   Introduction

     The 2000s were the big decade for plastic, as credit and debit cards came to dominate the
     way we pay. Consumers have increasingly used cards in place of cash and cheques,
     particularly as they have gained in popularity as a convenient alternative everywhere from the
     pub to the supermarket. The opportunity to combine all their payment needs into one small
     object has been one that consumers have relished. This was most apparent when, in 2010,
     cash fell behind debit cards in the consumer payment rankings, making the debit card the
     nation’s favourite way to pay for the first time in history.

     The story of plastic cards in the 2000s can be characterised as a decade of two halves. The
     early years saw strong growth in credit cards as the number of cards in issue grew at double
     digit rates, credit card debt rose and repayments fell. This contrasted with the later years
     which were marked by flat spending, higher repayments and a fall in credit card holding.
     Since 2005, it is the rise of the debit card that has driven a big shift in how we pay for goods
     and services; 91% of the growth in all card spending over the last five years has been on debit
     cards.

     Credit cards were first on the scene decades before debit cards came along, with the first card
     being issued over 45 years ago. The market was initially slow to grow and it took until 2000 for
     the first 50 million or so credit and charge cards to be issued. However, in that time the UK
     has become a world-leader in terms of market competitiveness and choice. With flexibility over
     how much you borrow, how and when you repay, coupled with the advantage of added
     consumer protection, the credit card has defined a clear role for itself.

     Great strides have been made by the credit card industry over the last ten years to improve
     transparency and give cardholders greater control over their finances. The introduction of the
     Summary Box in 2003, letting cardholders more easily compare the main features associated
     with specific products; the minimum repayment health warning on all credit card statements
     in 2004 and improved data sharing have all helped shape the credit card’s role. The industry
     recently made further voluntary changes1 to help cardholders, improving communication
     about interest rate changes and ensuring the most expensive debt is paid off first. We
     anticipate these changes will help cardholders use their cards more responsibly and take full
     advantage of all the benefits they offer.

     Tackling fraud has also been high up on the industry’s priority list over the last decade.
     Innovations like chip & PIN, which cost over £1 billion to introduce, along with MasterCard
     SecureCode and Verified by Visa have helped to reduce fraud. The industry has also funded

     1
         http://www.theukcardsassociation.org.uk/files/ukca/web_friendly_leaflet.pdf

                                                                                                        Page 2
a dedicated police unit which fights plastic card and cheque fraud and has developed smarter
ways of sharing fraud intelligence, through the Fraud Intelligence Sharing System (FISS).These
measures have been introduced at the same time as better systems to detect fraudulent
transactions on accounts and against a background of increased public understanding of the
importance of anti-virus software and computer security. Without these changes plastic card
fraud losses were forecast to have tripled, and the industry would not be in the same advanced
position that it is now in its fight on fraud.

Charitable giving has also benefited from the popularity of plastic cards. Donating online via a
charity’s website or a Just Giving page has been made possible thanks to plastic cards. The
industry has also been keen to lend its support by waiving card fees in major humanitarian
emergencies and appeals to ensure that the charity receives the full donation.

Credit cards have a very important place in our pockets. There are still lots of reasons why
customers choose to use one – and we still have more credit cards in the UK than anywhere
else in Europe. With 55.6 million credit cards in issue and 31 million credit card holders,
£4,700 is spent on our credit and charge cards every second.

The UK Card Association’s review of a decade of cards sets out the main drivers and key
events of the last ten years.

                                                                                                   Page 3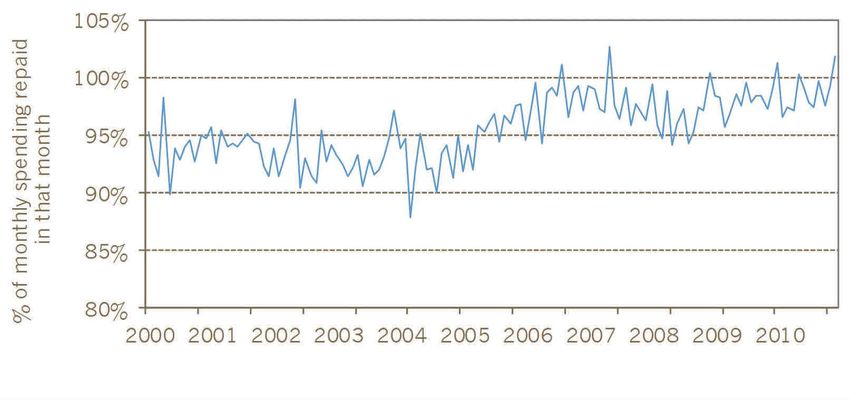
2.   Card Ownership in the UK

     International comparisons

     When it comes to cards, UK consumers are more like those in culturally similar countries like
     Australia and New Zealand than to those in our neighbouring countries. We have
     approximately 60% more credit and debit cards than our European neighbours, being the
     biggest holders in respect of credit cards. We collectively held 55.6 million credit cards at the
     end of 2010, just over one card for each adult, not including 6.6 million charge cards. Three
     out of every five adults hold at least one credit card.

     The last decade saw a wider range of options, and in many more places, for paying by card for
     the goods and services we buy. The credit card market grew consistently until 2005 before
     flattening out. Debit cards have since come to dominate the scene as they offer the
     convenience of plastic without the option to borrow, making them ideal for the things we buy
     every day, for example in supermarkets and petrol stations.

     Attitudes to borrowing have changed and, in recent years, the economic downturn has led to a
     reduction in the amount credit lenders are prepared to advance as they have reassessed risk.
     UK consumers have shifted faster and further away from credit cards, but Australia and New
     Zealand are also on the same path.

     The first half of the noughties

     At the start of the decade, debit cards were already widespread, with 77% of adults holding a
     debit card in 2000. They were used less than today – partly because people preferred cash
     and cheques and partly because, in the days before chip & PIN, they weren’t as widely
     accepted in places such as pubs, dentists and hairdressers.

     It became easier and cheaper to borrow in the early 2000s. The first half of the decade saw 23
     million new credit card accounts opened. By March 2004 the average APR on credit cards had
     fallen to 14.8% (a level only briefly improved on in 2008). Improved credit scoring gave new
     customers access to credit card products, while the convenience of credit cards for
     situations like foreign travel led to strong demand. These factors combined to mean the
     number of cards grew at double digit rates from 2000 to 2004 - growing the market by half in
     just four years. 651,000 new charge cards were also issued over the same period.

                                                                                                         Page 4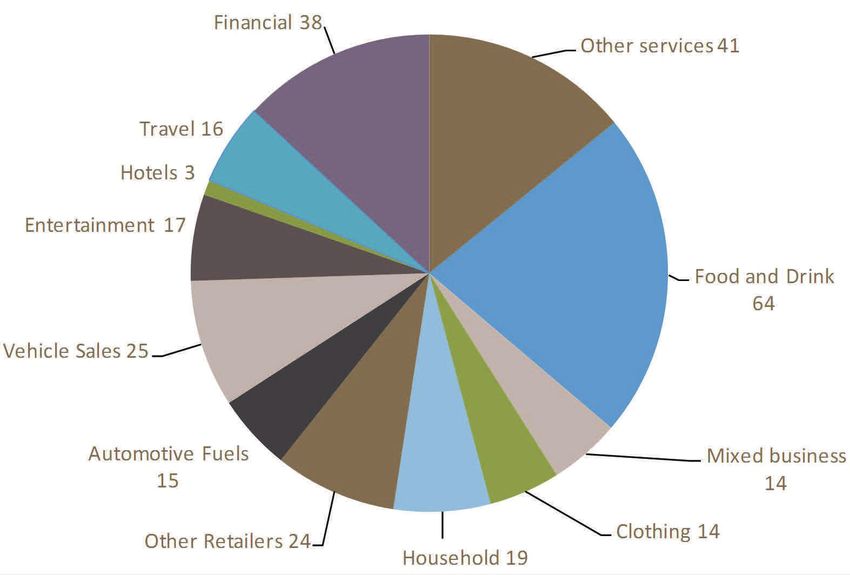
Chart 1. Number of credit, debit and charge cards in issue

Chart 2. Percentage of adults with a credit/charge or debit card

Turning of the tide for credit cards

The credit card market peaked in 2005 with 69.9 million credit cards in issue, as well as 4.7
million charge cards. More than two thirds of adults held a card and, even if they weren’t
often used, multiple cardholding was common (each cardholder had an average of 2.4 cards).
Amid concerns about indebtedness, consumers started to heed messages about the need to
borrow responsibly and credit card issuers made improvements to their responsible lending
practices. By 2010 there were 14.3 million fewer credit cards in our wallets compared to 2005
even though the adult population swelled by some two million.

                                                                                                Page 5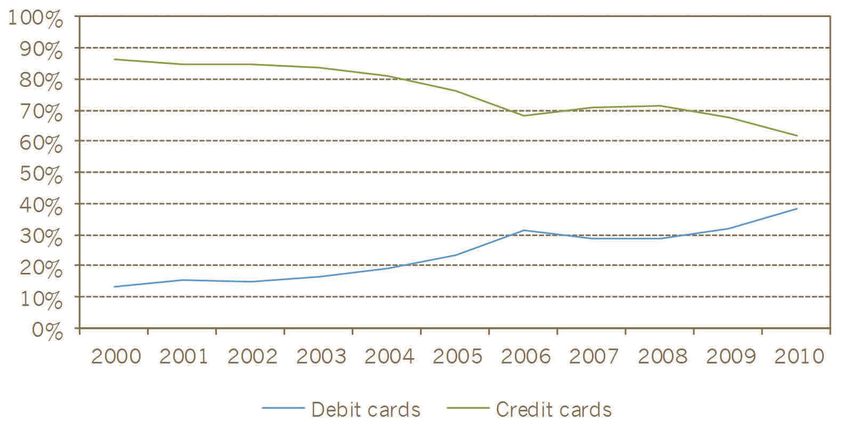
Chart 3. Credit/charge card holding, by socio-economic group

The sharpest decline was in 2009 when almost one in eight (7.8 million) UK credit cards left
our wallets. As the recession bit hard, card issuers sought to close dormant accounts and
reduce exposure to risk by declining more applications (almost half were refused in 2009,
compared to two in five in 2008). At the same time ‘low & grow’ products tailored specifically
for lending to higher risk customers started to emerge. Typically, credit limits start low, say at
£250, and gradually grow over time, allowing customers to establish a credit history by
showing that they can manage the credit.

End of the decade – debit card dominance

By the end of the decade it is the debit card that has become the nation’s favourite way to pay.
Debit card spending overtook cash spending for the first time in 2010.

Not only has the number of people holding credit cards continued to decline (four per cent of
the cards in issue left our wallets in 2010), but credit cards are being used less often by the
people who have them. Fewer than two in five adults used credit cards every month in 2009,
down from almost half of credit card holders in 2005. One and a half million fewer adults now
use their credit card every month than in the middle of the decade.

                                                                                                     Page 6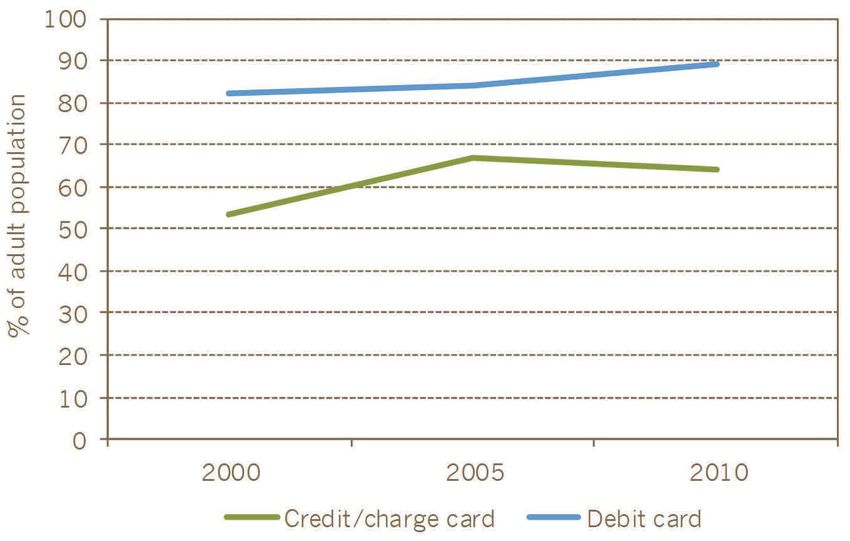
Chart 4. Cardholders who use their cards each month

Who owns the cards, where are they found and how are they used?

Credit and charge card holding has seen little change since 2000 in the wealthiest AB2 social
group. Better off consumers were very early adopters of credit cards and still hold them in
large numbers - over 85% of people earning more than £50,000 have a card. This compares to
less than half (46%) of people earning between £5,000 and £10,000. Adults in the AB group
are more than twice as likely as those in social group E to have a card (74% vs 35%).

Debit cards tell a different story. There is a much smaller disparity between AB Adults (89%
have a debit card) and adults in group E (64%). The high take-up of debit cards across all
socio-economic groups means that even if credit is harder to come by for lower income
groups, they need not be excluded from commerce as the world increasingly moves to cards
and other forms of electronic payment.

ACORN3 population groupings show how card holding reflects customers’ ability to afford their
spending on credit and charge cards. ‘Wealthy executives’ hold more than one in eight
(12.7%) credit cards, despite making up just one eleventh of the population (8.8%).
‘Flourishing families’ and ‘secure families’ are also significantly over-represented, whilst
‘burdened singles’ and those in ‘high-rise hardship’ hold only 2.7% of cards, despite
accounting for 6.1% of the population. As you would expect, credit limits and spending are
higher for those in more affluent groups too, with the most affluent groups spending on

2
 Further information on socio-economic groups can be found at http://www.nrs.co.uk/lifestyle.html
3
 ACORN is a geo-demographic segmentation of the UK’s population which segments small neighbourhoods,
postcodes, or consumer households into five categories, 17 groups and 56 types. For more information on the
various definitions of certain groups, please see http://www.caci.co.uk/acorn2009/acornmap_ext.asp

                                                                                                              Page 7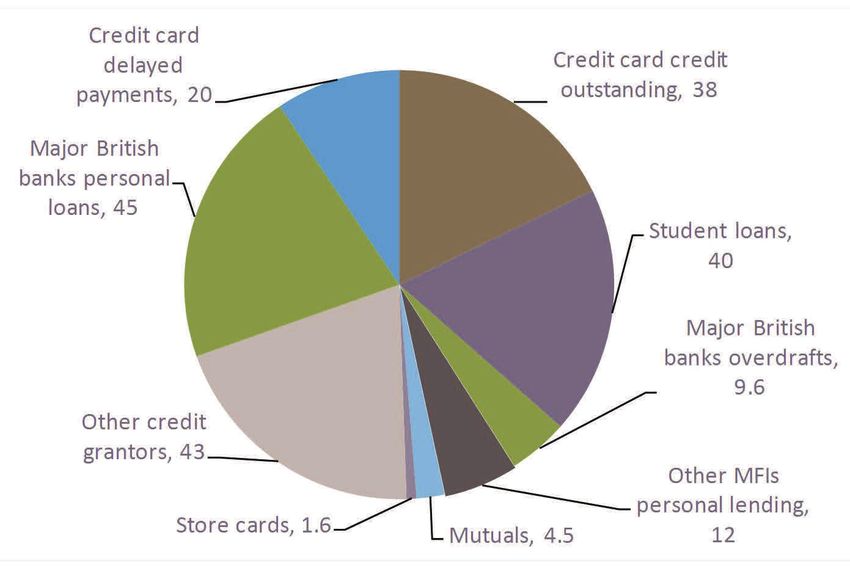
average four times more per annum than the poorest groups (£3,440 for ‘wealthy executives’
compared to £880 for those in ‘high-rise hardship’). ‘Asian communities’ are among the
lowest spenders on credit cards, reflecting cultural attitudes that favour saving and, among
some groups, that shun borrowing altogether.

There is also considerable geographical variation in cardholding around the country, primarily
owing to big differences in wealth between regions. The wealthiest regions of the south east
and parts of the north west have the most credit cards per adult, reinforcing how income is a
key influence on credit card holding. Similar patterns are seen across social class, with ABs
most likely to have multiple cards, but also most likely to pay them off every month.

Credit card accounts per adult, by constituency

                                                                                                 Page 8
3. Debit and credit card spending
In 2000, spending was higher on credit cards that debit cards. By 2005 this had already
changed as spending on debit cards matched credit cards for the first time and the trend
continued through the rest of the decade. 91% of the growth in card spending over the last
five years has been on debit cards, with 2010 figures showing that 68% of all plastic card
spending in the UK was on a debit card.
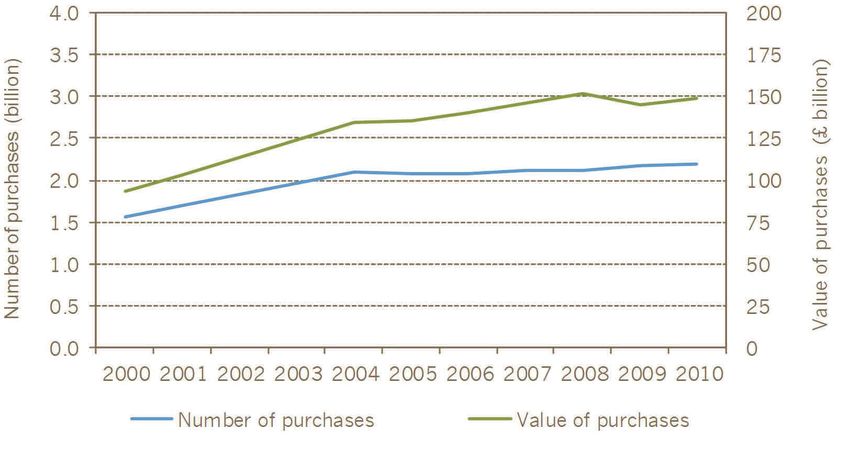
UK consumers used their debit cards to make over six billion purchases of goods and services
in this country in 2010, and their credit and charge cards to make two billion more. The total
number of credit card transactions has changed little in the last six years, though they are
being used more often (35 times in 2010 compared to 29 in 2004) as multiple cardholding
has declined and some cardholders have dropped out of the market.
Chart 5. Number and value of debit card purchases
Debit cards are increasingly being used in place of cash, cheques and credit cards.
£299 billion was spent on them in 2010, a 10.7% increase on 2009. In contrast, credit and
charge card spending in the UK saw a decline in real terms, increasing by less than inflation
from 2009 to 2010, reaching £136 billion. Spending growth on credit cards has been
subdued for several years, reflecting the smaller number of credit cards in issue and the
migration to debit cards. It has increased by less than two per cent annually since 2004, far
slower than inflation.
Page 9Chart 6. Number and value of credit card purchases
On a per card basis, the picture is reversed. The average annual spend per credit card rose to
£2,151 in 2010, up from £1,700 per card at the start of the decade, suggesting that the
frequency of credit card use has increased, even as the number of cards has shrunk.
Chart 7. Credit card spending by category, 2010 (£ billion).
Page 10What we buy with our credit cards is more evenly spread across the main categories of
expenditure than debit card spending. In fact, the pattern of credit card spending is virtually
unchanged over the past ten years, with the notable recent exception of food and drink, which
has increased its share of credit card spending by 36% over the last three years. Food and
drink is the main category we use our credit cards to buy (15% of spending), while
supermarkets, by a wide margin, were the place where credit cards were most often used last
year.
Chart 8. Debit card spending by category, 2010 (£ billion).
Page 114. The internet revolution – how credit and debit cards enabled a
new industry to develop
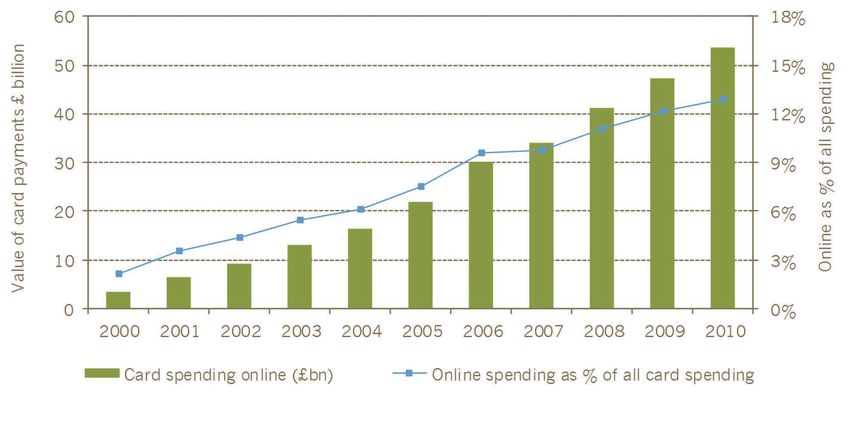
Online spending has changed the face of retailing in the last decade. In 2000, a tiny minority
of all card spending was over the internet – just £2.13 in every £100, equating to £3.5 billion
in total spent with online merchants. By 2010, this had soared fifteen-fold to £53.6 billion,
with £12.87 from every £100 spent online and double digit growth continuing, even through
the recession.
Chart 9. Online card spending
We have also changed our preferences in the cards we use to spend online. At the start of the
decade credit cards were often preferred, accounting for more than seven pounds of every ten
(72%) spent online in 2003. This shifted over the remainder of the decade – in 2010 credit
cards comprised about half (52%) the amount we spent online, compared to less than a third
of the total we spent on plastic, both on and off line. The additional consumer protection
offered by a credit card in the shape of Section 75 of the Consumer Credit Act, and the
perceived advantage of ring-fencing online spending in an account not linked directly to your
current account are good reasons for using a credit card online, but this hasn’t prevented
debit cards from gaining ground.
Page 12Chart 10. Consumer internet card spending
25-44 year olds are most likely to shop over the internet, but there is otherwise relatively little
variation in usage between demographic groups. Internet shopping on all credit, charge and
debit cards is skewed towards wealthier groups, but then so is all shopping. Two thirds of
adults (67%) made a purchase over the internet in 2009. Of those buying online, 70% bought
a book, CD or DVD, with almost half booking travel (49%). Men are more likely to buy
software and computers when shopping online, while women prefer clothes and are seemingly
responsible for the groceries.
Page 135. Cards and charity
It is not widely appreciated what a large role cards have come to play in charitable giving in
the UK. The most direct example is the many affinity cards that are branded with a charity’s
name, where the card company makes a donation each time the cardholder uses the card, or
when the account is first opened.
Plastic cards have also been instrumental in the major growth area of online giving. In 2010
£1.7 billion was donated to charitable organisations on plastic cards, an increase of 19% on
the year before.
In addition, the card industry waives fees to help ensure that 100% of donations towards
major humanitarian emergencies co-ordinated by the Disasters Emergency Committee and big
UK charity events like Children in Need reach the charity. In 2010 alone, four major appeals
benefited from the waiving of fees on credit and debit cards.
The card industry also financially supports and works with the Internet Watch Foundation, a
charitable organisation established in 1996 by the UK internet industry to remove web content
which contains child abuse images, criminally obscene adult content and materials inciting
racial hatred. Additionally, banks and card companies monitor use of card
services by businesses and act to terminate merchant services for firms that
are selling illegal or inappropriate goods, services or content.
Page 146. Overseas spending
The cards revolution has made travelling far easier for UK consumers and opened up the
opportunity of shopping overseas, whether in person or online. Cards have in large part
replaced the need for cash or travellers’ cheques, providing much greater convenience for
holidaymakers and business people.
However, in recent years the amount British citizens spend abroad on all types of payment has
fallen. According to the International Passenger Survey from the ONS, there were two million
fewer visits abroad in 2010 than 2000, with figures down 24% on their late 2007/early 2008
peak of over 70 million. In line with these numbers, the amount British citizens spend abroad
peaked in the second half of 2007 and the first half of 2008. Spending abroad in 2010 was in
fact 17% lower than at its peak, coming in at £30.6 billion.
The share of overseas spending on credit cards has fallen, impacted by the general trend of
flat credit card spending, the growth of debit cards and their increasing acceptance in other
countries. 86% of the money we spent on plastic overseas in 2000 was on a credit card, a
figure which had fallen to 63% by 2010. Debit card spending overseas has come from virtually
nowhere in 2000 (14% of spending) to account for the majority of transactions by volume and
37% of the overseas spend in 2010. A contributory factor was the 2010 decision of two major
card issuers to migrate their debit cardholders from Maestro to Visa Debit, which is more
widely accepted, especially in continental Europe and the USA.
Travellers seem to prefer debit cards for smaller purchases like meals and shopping while
credit cards are reserved for big charges like hotel bills and car hire, and for online spending,
perhaps because of the additional consumer protection offered for transactions over £100.
Chart 11. Share of overseas spending
.
Page 15Acquiring cash overseas
The way UK travellers acquire cash abroad has also changed markedly. Increasing acceptance
of UK debit cards abroad has seen canny travellers avoid the additional cost of taking out
cash on a credit card – in 2010 credit cards only accounted for one pound in every ten we
withdrew abroad, compared to more than one in four (28%) in 2000. The decline in use of
credit cards for cash withdrawals abroad could suggest that consumers are wisely reserving
their credit cards for emergencies, rather than as an immediate source of cash.
Chart 12. Cash acquisitions overseas
Page 167. Responsible borrowing, responsible lending
Over the last ten years the industry has made great strides to improve credit card
transparency as it has responded to major changes in the economic and regulatory
environment.
The introduction of the Summary Box in 2003 was one of the most significant transparency
initiatives, as it provided a standard précis of key information on the credit card product for
customers. It features information on APRs, monthly interest rates, the length of the interest-
free period, how payments are allocated and what the minimum repayment is. While this
information has always featured in the terms and conditions of the card, displaying it in a
standard format on any marketing materials, as well as on credit card statements, has made it
easier for customers to make fully informed choices and to compare between the features and
benefits of different credit and charge cards.
This commitment complemented the earlier inclusion on the statement of an estimated
interest amount (assuming only the minimum repayment is made by the due date) as well as a
move to inform customers in advance of the expiry of any promotional interest rates. Another
initiative was the introduction of a new minimum repayment health warning on all credit card
statements in 2004. This was introduced by issuers to ensure that customers were better
informed about the consequences of making only the minimum payment.
Good data sharing is at the heart of an issuer’s ability to lend responsibly. 2005 saw an
important milestone in the sharing of positive data for all credit cards by all issuers (where
legally able to do so). Then in 2008, the industry began sharing deeper additional data based
on how customers use their credit cards, such as whether they are frequently used to take out
cash and how often the customer chooses to pay just the minimum payment. This allows
lenders to pinpoint customers who may be at risk of financial difficulties, enabling them to
provide help in line with Lending Code commitments. The credit industry also continues to
lobby Government to share other potentially useful data, such as student loans and council tax
arrears.
In November 2008 the Government called a credit card summit, where agreement was
reached on a set of principles covering changes to interest rates and the provision of a
‘breathing space’ from debt collection activities for customers in discussion with a debt advice
agency. Subsequently, following the publication of a Consumer White Paper in July 2009, the
Department for Business, Innovation & Skills (BIS) launched the Credit & Store Card Review.
The industry provided evidence including analysis of some 44 million credit card accounts, an
economic impact assessment and detailed consumer research.
Page 17As a result, the Government and the industry agreed on a range of commitments to give
customers more control over their finances. The main changes, which have been in force since
the start of 2011, mean repayments are now always allocated to the most expensive debt first
(reversing the previous practice); at least one per cent of the outstanding balance is paid when
a new customer makes a minimum payment; cardholders have more choice and control over
credit limit increases and receive clearer communications if their interest is to be increased.
Cardholders also now have greater flexibility to choose the amount they pay towards their
credit card bill and the methods used for making regular payments. From the end of 2011
credit card holders will start to receive an annual credit card statement summarising their
previous twelve months card usage.
Page 188. Credit card borrowing
Although consumer credit expanded strongly in the secured loans market in the first part of
the decade as the mortgage and housing market boomed, consumers reined in their credit
card use well before the credit crunch hit.
The annual growth in net credit card lending (the amount borrowed minus the amount repaid)
was above 20% for almost two full years between 2003 and 2005. The 36 months from the
start of 2003 until the end of 2005 saw consumers add £25 billion to their credit card
borrowings, before debt outstanding on credit cards peaked in February 2006 at £69 billion.
At current rates of growth student loan debt is likely to overtake credit card debt within three
years.
The total amount of consumer borrowing outstanding at the end of 2010 was £1.45 trillion of
which mortgage lending accounted for 85%. The remaining 15% was unsecured lending, made
up of credit cards (4%) and other consumer credit such as personal loans and store cards
(11%).
Chart 13. Unsecured lending to individuals, 2010. (£ billion)
The credit card industry has moved a long way during the past five years to ensure it is lending
responsibly to the right customers. As a consequence many people are less indebted than in
the past. Card issuance to more vulnerable groups and their credit limits have been restricted,
and it is in fact wealthier cardholders who are able to sustain their spending on credit cards
and who represent a greater share of the market.
Page 199. Credit card repayment patterns
Changing attitudes to consumer borrowing have increased the number of people repaying in
full, with three in five (62%) credit and charge card holders repaying their balances in full each
and every month in 2010 (up from 55% in 2005 and 54% in 2003). Figures also show that
only three per cent of consumers make the minimum payment for 12 consecutive months
(falling to 1.2% over 24 months), with some of those doing so for rational reasons e.g. a low
interest promotional deal, or to prioritise paying more expensive debt elsewhere.
Chart 14. Number of adults using credit cards as a form of borrowing each month
Many commentators have postulated that the credit crunch and subsequent recession have
forced consumers to rely more heavily on their credit cards. However the fall in credit card
borrowing and changes in repayment behaviour dispel this myth. The repayment ratio (the
amount spent each month that is repaid in that month) has risen significantly over the last few
years, in line with this falling borrowing trend. From a low of 92.8% in 2003, it had reached an
average of 98.4% in 2010, and in a number of months exceeded 100%. With credit card
issuers’ stricter lending criteria, simply refinancing at a low interest rate with a rival card
issuer through a balance transfer was no longer an easy option for many borrowers.
The squeeze on living standards caused by the recession hasn’t forced people to rely on their
cards to sustain spending. In fact repayments have risen and spending has remained flat.
Page 20Chart 15. Credit card repayment ratio
Page 2110. Taking cash out on cards
The number of cash machines in the UK has almost doubled over the past decade from
33,000 in 2000 to just over 63,000 at the end of 2010. This growth has been matched by an
increase in the number of people who regularly use their debit cards to withdraw cash from a
machine. There were 38 million regular users of cash machines in 2010, up from 30 million in
2000. Regular ATM users took out an average of £200 a fortnight in 2010 and also used cash
machines for a lot more besides. It’s now possible to use an ATM to print a mini-statement,
change your PIN, top up your mobile or even make a donation to charity on some machines.
Cash acquisition on credit and charge cards in the UK has more than halved since the peak in
2005 when £9.2 billion of cash was taken out. In 2010, this had fallen to £3.8 billion, and
ended the decade £2.5 billion lower than it started. Price conscious consumers have
increasingly recognised the relatively high cost of credit card cash. Conversely, since the start
of the decade, debit card cash withdrawals have more than doubled in value to £172 billion,
dwarfing the amount taken out on credit and charge cards.
Chart 16. Cash acquired on credit cards
Page 2211. The rise and demise of the credit card cheque
Credit card cheques were introduced in the 1990s to enable cardholders to make balance
transfers to other credit cards and to make payments to retailers who didn’t have facilities to
process plastic card transactions (e.g. individuals or small traders). As such they provided
flexibility to users who may have to make a large payment to a tradesman and need to spread
the repayment.
At their peak in 2006, 327 million of these cheques were sent to cardholders. However, the
proportion actually used by customers was very small. In 2009 just 0.9% were used, to a value
of £2 billion. The unsolicited nature of credit card cheques proved unpopular with
Government and consumer groups who called for a ban. In response, the industry
implemented a voluntary cessation from the beginning of 2011, which is enshrined in the
Lending Code. Customers can still request credit card cheques, subject to certain restrictions,
but figures show they are now rarely used.
Chart 17. Distribution and use of credit card cheques
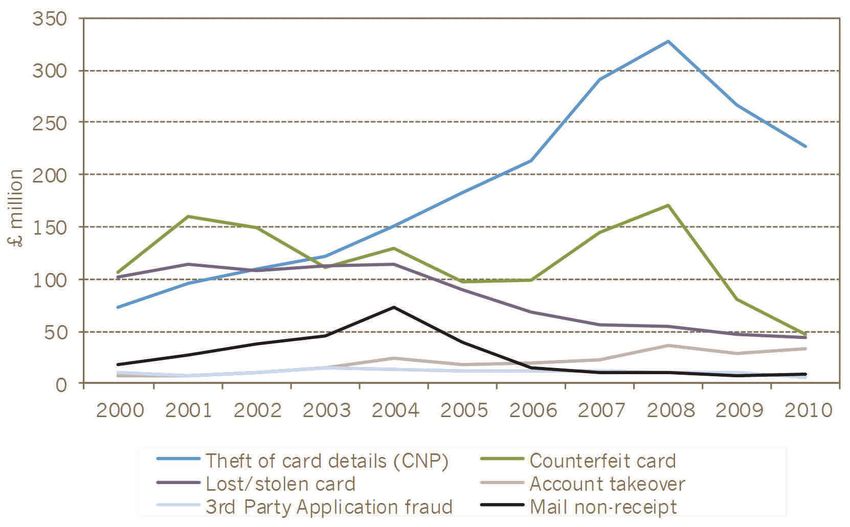
Page 2312. Card crime – the advent of chip & PIN and an industry funded
police unit
In 2000 card fraud was increasing year-on-year, particularly because prior to chip & PIN’s
introduction, fraudsters only needed to forge a signature or copy a magnetic stripe to go
shopping with someone else’s card.
Chip & PIN started to be rolled out here in 2003; the UK was the first country to upgrade to
the new global standard (called EMV) and it has greatly helped to protect our cards. The
compulsory use of a PIN, introduced in early 2006 to prevent stolen cards from being used in
shops, helped extend the decline in fraud on stolen cards which had peaked in 2004 at £114
million. Since 2004 the number of fraud cases has fallen 30% from 4.3 million to 3 million in
2010 and the average loss per case fell 45% from £696 to £381.
Another reason for the introduction of chip & PIN was to make it much more difficult for
fraudsters to produce counterfeit cards, using compromised details from the magnetic stripe
of a genuine card. As a result, losses from counterfeit cards in the UK decreased by 63% from
2006 to 2010 and the increasing roll-out of chip & PIN overseas is helping to drive down
losses abroad too. Counterfeit cards were used to commit £30.8 million of fraud outside the
UK in 2010 – less than a quarter of the peak value in 2008 (£134 million).
Chart 18. Fraud losses on UK plastic cards
Page 24Total fraud losses on UK cards fell to £365 million in 2010 – a 17% fall compared to 2009,
and 40% lower than the 2008 peak. Fraud fell in all categories in 2010 and total losses are at
their lowest level since 2000 (£317 million). Bearing in mind that the value of retail and
services spending on cards rose 150% from 2000 to 2010, this shows huge strides have been
made to control criminal activity. The banking industry has invested heavily to deter, detect
and prosecute fraudsters, raising awareness amongst cardholders on how to protect
themselves from fraud and advising retailers how to protect their chip & PIN equipment
from criminal attack. The decade also saw a drive to encourage cardholders and retailers to
sign-up for online fraud prevention initiatives such as MasterCard SecureCode and Verified by
Visa, greater use of fraud detection tools by banks and retailers, chip & PIN rolled out in more
countries around the world and an upgrade of chips on UK cards.
The Dedicated Cheque and Plastic Crime Unit (DCPCU), a specialist police squad sponsored
by the banking industry, brought a new focus to the growing problem of card fraud. Formed in
2002 to tackle the organised gangs behind cheque and card fraud, since its inception the
DCPCU has saved an estimated £370 million of fraud losses. Intelligence sharing has also
played a vital role in helping to combat fraud. Since 2008 the Fraud Intelligence Sharing
System (FISS) has been in place, which enables the banking industry to share information on
all confirmed, attempted and suspected fraud in a central, shared database. FISS provides the
industry with a secure and robust reporting mechanism, in support of a long-term fraud
prevention strategy.
Chart 19. Total fraud losses on UK issued cards
Page 2513. Cards - the future
Expansion of the debit card market is likely to continue in the short to medium term as
the economy recovers, high street spending picks up and migration from other payment
methods such as cash and cheques continues. Debit card use online is expected to grow,
as e-commerce continues to expand and cardholder trust in the method grows with safety
features such as MasterCard SecureCode and Verified by Visa. Greater account holding and
debit card provision on basic bank accounts and by credit unions will also drive up holding
and use of debit cards, as will their increasing acceptance for purposes such as credit card bill
payment.
Growth in unattended retail terminals in supermarkets, chemists and petrol stations will also
boost card use and debit cards are likely to benefit significantly from contactless payments, as
their popularity for lower value everyday payments carries on increasing. The pace of change is
picking up in the contactless card market, with both issuance and acceptance likely to
increase significantly in coming months. Large scale projects such as the acceptance of
contactless bank cards on TfL’s network and acceptance by major supermarkets and other
retailers will act as tipping points for the market. McDonald’s decision to accept contactless
payments illustrates this point. The recent increase in the value threshold for contactless
payments to £15 will also improve the business case for certain types of retailers.
The number of debit card payments is expected to double by 2020, reaching 12.8 billion, with
a big increase in spending also projected, growing from £292 billion in 2010 to £616 billion by
2020. Debit cards will account for 62% of the projected increase in electronic transaction
volumes over the next ten years.
Meanwhile, the shrinking of the credit card market should not be viewed as a long-term decline
like cheques, but more of a levelling-off. The role that the credit card played at the start of the
decade was massively influenced by factors such as the advent of the internet and consumers’
appetite for borrowing. As consumers have become more aware of the full range of payment
options, we have seen credit card usage stabilise.
Credit and charge cards have a clear place in our wallets, fulfilling functions which other
means of payment cannot. The market also remains extremely competitive and there a lots of
different cards and deals for customers to choose from. Satisfaction levels with credit cards
among consumers are very high – 93% expressed no dissatisfaction at all in 2009. People
most value the ease of use offered by credit cards and the reassurance and flexibility of a
spending safety net that allows purchases to be made while simultaneously managing cash
flow. With the settlement of accounts monthly, payments can be matched to when salaries
come in, or spread if income is irregular (as with the self-employed). Credit cards also allow
people to make big purchases that would be harder to make if payments could not be spread
Page 26out, from luxuries such as a holiday to essentials like a new washing machine. Card security
and consumer protection features are very important to consumers, particularly with the
growth of online retail. The added protection makes the card issuer liable along with a retailer
for faulty, mis-described, or undelivered goods. In addition to all of this, the growth of rewards
programmes has been very popular.
With the credit bubble behind us, consumer borrowing looks unlikely to scale the same heights
as in the mid 2000s. Demand for unsecured credit is lower as consumers seek not to repeat
the difficulties of dealing with an overhang of debt, and supply of finance will be constrained
by new regulations on lending. Furthermore, for a time, credit cards were the main option
consumers had for electronic payments. This meant they were often used for transactions for
which they were less suited (as they were the only alternative to cash and cheques) such as
buying food, petrol, or small items. Newer payment options, especially debit cards and Faster
Payments, mean everyone can now make day-to-day payments quickly and easily.
By 2020, we expect UK credit and charge card volumes to reach almost three billion, with total
spending of £194 billion in that year, up from two billion with a value of £136 billion in 2010.
We expect the number of cards held to grow slowly again through 2011, reaching 33 million in
2019, but the increases forecast will fall fractionally behind the growth in the adult population.
Regulatory changes will, however, be a major influence on our forecasts. For example, if credit
card issuers needed to reintroduce annual fees to recover costs and lost revenue caused by
regulatory intervention, this could impact the holding and use of credit cards. Growth looks
set to resume, but it is likely to be slower in future.
Future technology
The widespread use of near field communication (NFC) technology in mobile phones will allow
contactless card payments to be made using just a handset, rather than with a plastic card
itself. We are likely to see individual card issuers partnering with mobile network
operators to provide phone applications that will mirror existing contactless cards, as well as
many more retailers installing contactless readers in their stores. Cardholders will be able to
make payments for low value purchases (under £15, with the possibility of it rising in the
future) by simply tapping their phone against any contactless card reader.
Industry experts predict that in the near future the need for a physical card will diminish and
mobile phones will replace the wallet. This will mean that instead of carrying around debit and
credit cards in our wallet, we will be able to use our mobile to make a purchase, selecting
interchangeably between spending on either our debit or credit account.
Page 27Key milestones for cards
1966 29 June: Barclays issues the UK’s first credit card
1972 Joint Credit Card Company launched, issuing Access credit cards for banks including
Lloyds, Midland, National Westminster and Williams & Glyn’s
1977 1 July: The Consumer Credit Act 1974 comes into force. Section 75 provides
protection to consumers buying goods costing between £30 and £10,000
(later increased to £100 and £30,000) on their credit card
1980s Magnetic stripes added to cards and electronic point-of-sale terminals introduced in
retailers
1987 3 June: Barclays launch the UK’s first debit card under the Connect brand
1989 Lloyds Bank is the first to introduce an annual card fee (£12)
1990s Cards industry agrees to waive interchange fees for all cross-charity and disaster or
emergency appeals
1990 Cashback is introduced as a method of acquiring cash, with seven million transactions
made in the first year
1992 The first Banking Code is introduced, setting out rights and the obligations of lenders
1994 Half of UK adults hold a debit card
1995 UK debit card volumes exceed credit card volumes for the first time
1999 Half of all UK adults hold a credit card. The average value of a credit card purchase
exceeds £50 for the first time
1999 Annual fees disappear, extras such as travel insurance and loyalty schemes begin to
be offered to attract customers, who are beginning to hold more than one card each
2000s Aggressive pricing (e.g. zero/low interest rate offers) positions credit cards as a
cheaper form of personal short-term borrowing than loans
2001 Debit card expenditure exceeds credit card expenditure for the first time
2002 Dedicated Cheque & Plastic Crime Unit – the industry funded police unit is launched
2003 The Summary Box is introduced on marketing materials and credit card statements,
giving customers an easy way to understand and compare credit cards
2003 The move to chip & PIN is announced – the biggest change to consumer payment
behaviour since decimalisation
2004 Plastic card expenditure exceeds cash spending for the first time
Page 282004 Card companies begin rolling out chip & PIN cards across the UK
2005 Retail spending on debit cards reaches £89 billion; beating cash for the first time
2005 The number of credit cards in issue reaches a peak of 69.9 million, before starting to
gradually fall year-on-year
2005 Improved transparency on charging at ATMs, so that customers can make informed
decisions before withdrawing money
2005 Minimum repayment health warning and debt advice appears on credit card
statements
2006 Consumer Credit Act 2006 passed by Parliament (key provisions come into force
in 2008)
2006 14 February: Chip & PIN becomes the standard at point-of-sale as signing for card
purchases is ‘turned off’
2006 1 June: Office of Fair Trading (OFT) action effectively caps credit card default fees
at £12
2007 September: Launch of contactless card payments on debit and credit cards in
London
2008 The House of Lords rules that Section 75 protection applies to credit card purchases
made abroad as well as in the UK
2008 November: The Credit Card Summit results in new cardholder options if a product is
re-priced and the provision of a breathing space from debt collection activities, if a
cardholder is in discussion with a debt advice agency
2008 1 December: Behavioural Data Sharing – a significant enhancement to the amount of
detail shared about cardholders’ use of credit cards – goes live
2009 Card fraud falls by 28%, the first major reduction since 2005
2009 The Lending Code replaces the former Banking Code, focusing on lenders’
responsibilities to cardholders
2010 Card fraud falls a further 17% and is back at levels last seen around 2001
2010 Debit cards overtake cash as the nation’s favourite way to pay for the first time
2010/11 Government consults the cards industry on rate capping of credit cards
2011 January: Changes agreed with the Government come into force, changing the way
credit card repayments are allocated, how the minimum repayment is calculated,
and how changes to credit limits and re-pricing work.
Page 29You can also read