A Drawing System for Pole Diagram and Rose Diagram of Rock Mass Structural Surface
←
→
Page content transcription
If your browser does not render page correctly, please read the page content below
Hindawi
Mobile Information Systems
Volume 2021, Article ID 9652623, 11 pages
https://doi.org/10.1155/2021/9652623

Research Article
A Drawing System for Pole Diagram and Rose Diagram of Rock
Mass Structural Surface

 1,2,3
 Gaojian Hu
 1
 School of Civil Engineering, Shaoxing University, Shaoxing, Zhejiang 312000, China
 2
 Key Laboratory of Rock Mechanics and Geohazards of Zhejiang Province, Shaoxing, Zhejiang 312000, China
 3
 Zhejiang Collaborative Innovation Center for Prevention and Control of Mountain Geologic Hazards, Shaoxing,
 Zhejiang 312000, China

 Correspondence should be addressed to Gaojian Hu; hugaojian8@163.com

 Received 4 June 2021; Accepted 21 July 2021; Published 30 July 2021

 Academic Editor: Fazlullah Khan

 Copyright © 2021 Gaojian Hu. This is an open access article distributed under the Creative Commons Attribution License, which
 permits unrestricted use, distribution, and reproduction in any medium, provided the original work is properly cited.

 The distribution of structural planes is complex and irregular. How to quickly and effectively obtain the occurrence and
 distribution characteristics of structural planes and improve the efficiency of data processing is a key technical issue in
 structural plane analysis. The paper combined fuzzy equivalent clustering algorithm, rose diagram drawing method, and
 C++ language, developed a drawing system for the pole diagram and rose diagram of rock mass structural planes, and
 verified the practicability of the system through an engineering case analysis. In the article, the fuzzy equivalent clustering
 of the occurrence of structural planes, the drawing of pole diagram, and the statistical analysis of structural planes were
 realized based on the fuzzy equivalent clustering algorithm. The rapid drawing of the striking rose diagram, trending rose
 diagram, and dip rose diagram module were realized based on the rose diagram drawing method. The system integrated the
 structure plane pole diagram and the occurrence rose diagram together and realized the rapid analysis and drawing of the
 structure plane.

1. Introduction method to count the data of different structural planes in
 open-pit mines and established the relationships between
In the analysis of rock slope stability, the occurrence of drilling parameters and rock mass structure.
structural planes has a great influence on slope stability. How These measurement methods have shortcomings such as
to quickly and effectively obtain the occurrence and dis- large workload, large error, and poor effect when applied in
tribution characteristics of structural planes is a key issue in the field. At the same time, the obtained structural data is
the acquisition and analysis of structural planes. complex and irregular, which is very cumbersome and
 At present, the commonly used methods for collecting difficult to process manually. Therefore, an intelligent
structural plane occurrence include the survey line method, software system is needed to automatically realize the
precise survey line method, sampling window method, and processing of structural data.
borehole core joint collection method. For example, Zhao The pole diagram and rose diagram are commonly used
et al. [1] used the survey line method to evaluate the stability statistical methods of structural plane occurrence. The rose
of the underground surrounding rock of the Lingbao diagram is a simple, clear, and intuitive basic geological map,
Luoshan Gold Mine. Chaminé et al. [2] measured the actual which is widely used in characterizing the development
data of rock outcrops using the precise line method. Xu et al. degree and dominant orientation of structural surfaces. The
[3] improved the statistical method of sampling window to rose diagram is simple and helpful to analyze the regional
obtain the structural surface data of granite outcrops. structure. It can be more clear in reflecting the direction of
Manzoor et al. [4] used the measurement while drilling the main joints. For example, Wang et al. [5] realized the
2 Mobile Information Systems

rapid analysis and recognition of the rose diagram of the processing programs have gradually become important
structural plane based on the MATLAB computing plat- methods for drawing pole diagrams.
form. Dong et al. [6] used rose diagrams and pole diagrams Cluster analysis is a method of statistically studying
to perform statistical analysis on the structural plane in- classification problems. It allocates all sample data to several
formation of fractured rock masses. clusters so that the sample data of the same cluster are
 In geological analysis, the joint rose diagram is usually gathered around the cluster center. The cluster analysis
plotted on the geological map according to the positions of methods include systematic clustering method, ordered
the survey point to clearly reflect the relationship between sample clustering method, dynamic clustering method, and
the joints, folds, or faults in different structural parts. Among fuzzy clustering method. Among them, the fuzzy equivalent
them, the strike rose diagram is mostly used in situations clustering method has better advantages in processing
where the joint occurrence is relatively steep. For example, structure. For example, Li et al. [13] proposed a new method
Tao et al. [7] used equatorial horizon projection and strike for identifying local high-density samples. Hou et al. [14]
rose diagram to determine the dominant structural plane. carried out a cluster analysis of the dominant occurrence of
Wei et al. [8] used the strike rose diagram method to cal- rock mass structural planes based on a netting algorithm. Li
culate the structural plane information of the rock mass in et al. [15] clustered the structural planes of rock mass based
the Beishan area. on the ant colony clustering method, which effectively re-
 The trend rose diagram and dip rose diagram are mostly alized the grouping of structural planes. Jun et al. [16]
used in situations where the joint occurrence changes proposed an improved fast clustering analysis method. Guo
greatly. For example, Jifeng et al. [9] realized the automatic et al. [17] introduced the firefly algorithm and the fuzzy c-
drawing of the trend rose diagram with the help of the means algorithm to accurately obtain the discontinuity
MATLAB program, which can quickly obtain structural information of the rock mass. Bei et al. [18] used the fuzzy
information. Li et al. [10] took the tunnel face as the clustering method to process the structural surface infor-
background and used the dip rose diagram method to realize mation of rock masses and obtained satisfactory results.
the difference visualization analysis of the tunnel radial rock Through the equivalent fuzzy clustering method, the cluster
mass structure. The disadvantage of the occurrence rose analysis of structural plane occurrence can be realized. The
diagram is that it is grouped only according to the distri- analysis result can accurately reflect the actual distribution of
bution of occurrence. When there are multiple sets of the data and obtain the precise occurrence distribution and
structural planes for the same occurrence, the rose diagram data of the structural plane. Cluster analysis overcomes the
of the occurrence cannot be fully represented. It is difficult to subjectivity of human experience grouping. Therefore,
realize the intelligent drawing of large-scale structure surface writing a computer program system can quickly and ac-
data because the drawing method of the occurrence rose curately obtain structural plane occurrence information
diagram is cumbersome. It needs to be repeated many times based on the fuzzy equivalent clustering analysis method.
when there are multiple sets of structural planes for a certain Both the rose diagram and pole diagram can reflect the
occurrence. Therefore, it is necessary to realize the automatic different aspects of the structural plane. There are more or
drawing of the rose diagram of the occurrence state through fewer problems in the application and drawing of a single
a software program. graphical method. If the amount of structural data obtained
 The pole diagram represents the projection of the poles by field measurement is too large, there will be cumbersome
of the measured structural plane onto the stereographic and time-consuming processing problems. Therefore, if the
projection diagram. It is a graphical method that uses two drawing methods can be integrated into one drawing
points and lines on a plane to analyze lines and surfaces in system, the rose diagram and the pole diagram can be drawn
three-dimensional space. The pole diagram can be rotated at the same time, which will bring great benefits to the
and transformed to restore the joints and stratum occur- analysis of the occurrence of structural surfaces. Although
rence before the structural failure. The pole diagram can scholars at home and abroad have realized the recognition of
simultaneously show the distribution of the tendency and structural plane occurrences by writing programs, few
dip of the structural plane, which is more scientific and scholars have formed it into a systematic and intelligent
accurate than the rose diagram method. For example, Zhao software system.
et al. [11] used the pole diagram to study the distribution The article developed a drawing system for the pole map
characteristics of dominant structural planes. Zhong et al. and occurrence rose diagram of rock mass structural plane
[12] used a combination of the rose diagram and pole based on fuzzy equivalent clustering algorithm and C++
diagram to perform statistical analysis on structural planes language programming to realize the rapid and intelligent
and determined the dominant structural planes. But the drawing of rock mass structural plane.
illustration process of the pole diagram is quite tedious.
When a pole map is manually completed, such as an iso- 2. System Composition and Theoretical Basis
density map, it needs to go through the processes of casting
points, density statistics, percentage conversion, drawing The paper programming developed a drawing system of the
straight lines, etc., which is time-consuming and error- pole map and rose diagram of rock mass structural plane
prone. The grouping of pole diagrams mainly relies on based on fuzzy equivalent clustering analysis method, C++
empirical methods, and the results lack objectivity. language, and the method of drawing rose diagram of
Therefore, statistical analysis methods and computer structural plane occurrence. The paper combined theoretical
Mobile Information Systems 3

algorithms and software system development to provide a elements in C conform to maxk (min(aik , bik )) � ∨k
drawing system for pole diagrams and rose diagrams of rock (aik ∧ bkj ). The n-level fuzzy relation matrix R was the
mass structural planes. continuous multiplication of n Rs. That is,
 The system included 8 modules: the import module of
data, the calculation module of the fuzzy equivalent clus- max min aik , bik � ∨ aik ∧ bkj ,
 k k
tering algorithm, the drawing module of pole diagram, the (4)
 R � Rn+1 � Rn+2 � · · · ,
 n
statistical analysis module of the structural plane, the output
 n
module of data, the drawing module of the striking rose t(R) � R .
diagram, the drawing module of trending rose diagram and
drawing module of dip rose diagram. The system flow chart Take the cut-set level λ ∈ [0, 1], if rij ≥ λ, then the
is shown in Figure 1. structural planes i and j belong to the same category. That is,
 The theoretical basis and realization functions of each rij ≥ λ. (5)
module of the system were as follows.

2.1. Import Module of the Data. This module was used to
import the structural plane data obtained by digital pho- 2.3. Drawing Module of the Pole Diagram. According to the
togrammetry into the software system. clustering results and the structural plane grouping results,
 the pole diagram of the structural plane was drawn. The
 process was as follows.
2.2. Calculation Module of Fuzzy Equivalent Clustering The lower hemisphere equal-angle projection method
Algorithm. This module realized the fuzzy equivalent was used to draw the pole diagram.
clustering of structural plane occurrence based on the The joint occurrence data represented by inclination αd
fuzzy equivalent clustering algorithm. The process was as and dip βd were converted into the joint occurrence data
follows. represented by the unit normal vector. Assuming that αn and
 Supposing the number of the measured samples of the βn were the tilt direction and tilt angle of the unit normal
structural plane was N, and the i-th sample was represented vector of the structural plane. The unit normal vector for any
as (xi1, xi2). xi1 was the inclination of the structural plane, structural surface was expressed as X � (x1 , x2 , x3 ), and
and xi2 was the dip of the structural plane. The fuzzy relation each point on the hemispherical surface corresponded to a
matrix R was as follows: joint occurrence. The formula was as follows:
 r11 r12 · · · r1N
 ⎢
 ⎡
 ⎢
 ⎢ ⎥⎥⎥⎤ X � x1 , x2 , x3 ,
 ⎢
 ⎢ ⎥⎥⎥
 ⎢ r21
 ⎢
 R �⎢
 r22 · · · r2N ⎥⎥⎥. (1) x1 � cos αn cos βn ⎫
 ⎢
 ⎢
 ⎢ ⎥⎥⎥ ⎪
 ⎪
 ⎢
 ⎣⋮
 ⎢
 ⎢ ⋮ ⋮ ⎥⎥⎦ ⎬
 x2 � sin αn cos βn ⎪,
 rN1 rN2 · · · rNN ⎪
 ⎭
 x3 � sin βn
 The element rij in the matrix was the similarity coefficient
 αn � αd + 180° , ⎪
 αd ≤ 180 ⎫
 ⎪
 ⎪ (6)
between the i-th sample and the j-th sample, which repre- ⎬
 °
sents the degree of similarity. The larger the rij, the more αn � αd − 180 , αd ≥ 180 ⎪,
 ⎪
 ⎪
similar the sample i and the sample j. βn � 90° − βd ⎭
 The calculation of the similarity coefficient rij:
 αd ∈ (0, 360),
 ⎨ 1,
 ⎪
 ⎧ i � j,
 rij � ⎪ (2) βd ∈ (0, 90).
 ⎩ 1 − c xi1 − xj1 + xi2 − xj2 , i ≠ j.
 The occurrence data of the structural plane expressed by
 In (2), i � 1, 2, . . ., N; j � 1, 2, . . ., N, c was the calculation the unit normal vector was obtained.
parameter (0 ≤c ≤ 1), and the value of c was appropriately The coordinates xn and yn of A′ on the stereographic
selected to make rij spread out in [0, 1]. projection diagram were calculated based on the normal
 Solve the closure t(R): occurrence data of the structural plane and the stereographic
 projection principle diagram. Among them, point A′ was the
 R2 � RR, equatorial projection of the plane normal. The formula was
 R4 � R 2 R2 , (3) as follows:

 ···. βd
 r � tan ,
 2
 Carry out structure plane grouping judgment. The steps
of fuzzy matrix multiplication were similar to those of or- (7)
 ⎨ xn � r sin αn ,
 ⎪
 ⎧
dinary matrix multiplication. The difference was that instead
 ⎪
 ⎩ y � r cos α
of multiplying the two items first and then adding them, it n n .
took the smaller and then the larger. If C � AB, then the
4 Mobile Information Systems

 Import the structure information

 Solve the fuzzy relation matrix

 Calculate the similarity coefficient
 and closure

 Determine the grouping of structural
 planes

 Solve the unit normal vector

 Solve the projected coordinates

 Plotting the pole diagram

 Calculate the sample range and
 probability

 Calculate the sample mean and
 variance

 Output the parameter information of
 structural plane

 Group tendencies; count the number of Group tendencies; count the number of
 Group the strike; count the number of joints and average tendencies in each joints in each group, average tendencies
 joints and the average strike in each group group and average dip angles

 Determine the drawing scale, coordinates, Determine the drawing scale, coordinates, Determine the drawing scale, coordinates,
 and drawing points and drawing points and drawing points

 Drawing the strike rose diagram Drawing the trend rose diagram Drawing the dip rose diagram

 Figure 1: The flow chart of the system.

 The stereographic projection coordinate points of all R � max xi − min xi . (8)
structural surface normals were solved.
 A base circle whose diameter was unit length was drawn, Each partition interval was calculated according to the
and the vertical and horizontal diameters were drawn, and E, following formula:
S, W, and N directions were marked.
 R R
 The stereographic projection coordinates of all structural Mm � min xi + · m, min xi + · (m + 1) . (9)
surfaces were drawn on the base circle diagram. The pole 7 7
diagram of the structural plane was drawn.
 The probability of the sample falling in each partition
 interval was determined. The method was to first use the
2.4. Statistical Analysis Module of the Structural Plane. computer loop language to count the number of samples
This module was used for the statistical analysis of the Nm that fall in each interval, and then combine the total
structural planes after clustering to obtain the mean and number of samples N to calculate the sample number
variance of the inclination, dip, trace length, spacing, and probability Pm :
rock bridges of each group of structural planes. The process Nm
was as follows. Pm � . (10)
 N
 The sample partition interval m was determined firstly.
 The sample range R was solved according to the fol- The sample mean was solved according to the following
lowing formula: formula:
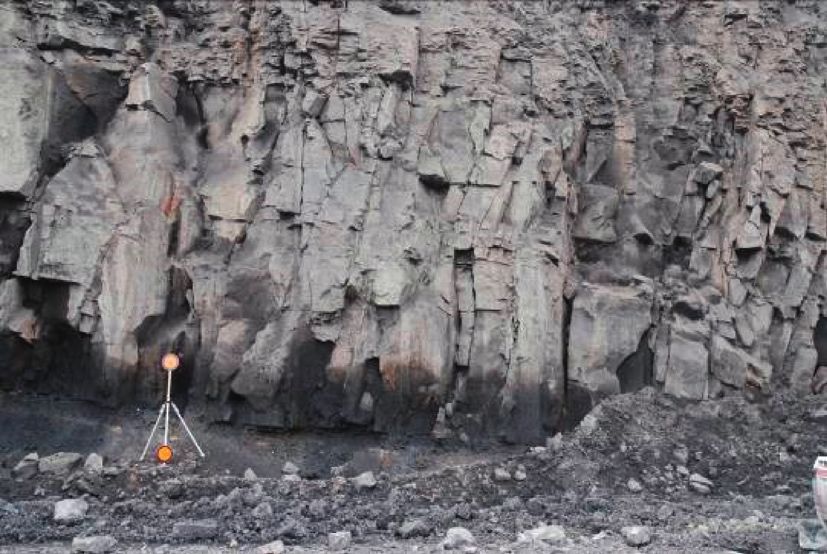
Mobile Information Systems 5

 1 n S Dj
 x� x . (11) L Dj � · LDj max. (16)
 N i�1 i SDj max

 The sample variance S2 was solved according to the e LDj and LDj+1 were connected sequentially. If a certain
following formula, where S was the standard deviation: group of joint numbers was zero, the connection would
 1 n return to the center of the circle and then be connected to the
 S2 � xi − x . (12) next group from the center of the circle.
 N − 1 i�1 A tendency rose diagram of joints was drawn.
 According to the probability value Pm , the probability
distribution patterns of the inclination, dip, trace, spacing, 3. Engineering Case Application
and rock bridges of each group of structural planes were The engineering case used in this study was a rock mass area
drawn automatically. on a 1300 m platform on the south slope of the Anjialing
 Coal Mine, as shown in Figure 2. Anjialing Coal Mine was
 located in the south-central of Pingshuo mining area in
2.5. Output Module of the Data. The classification infor-
 Shuozhou City, Shanxi Province, China. The topography of
mation of structural planes was output, including the mean
 the mining area was a typical loess plateau. Occurrence strata
and variance of the inclination, dip, trace, spacing, and rock
bridges of each group of structural planes. in the mining area were mainly Quaternary loess, Tertiary
 laterite, and Carboniferous bedrock. The contact relation-
 ship between various levels was unconformable contact. The
2.6. Drawing Module of the Rose Diagram. The drawing 1300 m platform was located in the middle section of the
module of the rose diagram includes the strike rose diagram, slope, and the platform height was 12 meters. The overall
the trend rose diagram, and the dip rose diagram. The slope angle was 75°∼85°, and the mining method was steep
drawing module of the trend rose diagram was taken as an slope mining.
example to clarify its theoretical basis. The process was as The geological survey revealed that the rock mass had an
follows: obvious stratum. The lithology of the rock formations was
 The joints were sorted according to the size of the mainly mudstone and sandstone with severe weathering.
tendency data and grouped every θ � 10°. Each group was The rock mass was dry and there was basically no water
named as Dj . The formula was as follows: seepage phenomenon. A large number of joints were de-
 veloped in the rock mass with good penetration. The cutting
 Dj � θ, θ + 9° , effect of the structural surface on the surface of the rock mass
 θ � 10(j − 1), (13) was very obvious.

 j ∈ (1, 36).
 3.1. Application of the Data Import Module. A field structural
 The number of joints in each group was named SDj , and surface measurement was carried out on a rock mass of
the average tendency of each joint was named Dj . Calculate 1300 m platform on the southern slope of Anjialing Coal
Dj according to the following formula: Mine by using the method of on-site measurement. Then the
 the sum of the structure of the Dj group measured structural surface data was automatically im-
 Dj � , ported into the software system.
 S Dj
 (14)
 j ∈ (1, 36). 3.2. Application of the Calculation Module of Fuzzy Equivalent
 Clustering Algorithm. According to the data information of
 According to the size of the drawing and the number of the imported structural plane, the fuzzy equivalent cluster
each group of joints, a certain length of line segment was analysis of the structural plane occurrence was realized based
selected to represent a group of joints, and the scale of the on the fuzzy equivalent clustering algorithm. Through cluster
line segment Ld was determined. analysis, the structural planes were divided into 3 groups.
 The group of joints denoted by the Ld with the largest Among them, joint group 1 obtained a total of 30 structural
number was represented as SDj max. A semicircle was marked planes, joint group 2 obtained a total of 38 structural planes,
with the length LDj max of the line segment of SDj max as the and joint group 3 obtained a total of 57 structural planes.
radius. Limited by the length of the article, only 20 structural in-
 formation of each group of joints are listed in Table 1.
 LDj max � Nd Ld , Nd was the constant. (15)

 For each group of joints Dj , the average direction Dj was 3.3. Application of the Pole Diagram Drawing Module.
used as the azimuth angle, and a mark was made on the According to the clustering results and the grouping results
semicircle. From the center of the circle to the radius of the of the structural planes, the lower hemisphere equal-angle
circle marking point, a point LDj was determined according projection method was used to draw the pole diagram of the
to the number of SDj in the group and the scale Ld . structural planes, as shown in Figure 3.
6 Mobile Information Systems

 Figure 2: A rock mass on the 1300 m platform on the south slope of Anjialing Coal Mine.

 Table 1: The grouping results of structural planes.
 Joint group 1 Joint group 2 Joint group 3
Joint number
 Trace (m) Tendency (°) Dip (°) Trace (m) Tendency (°) Dip (°) Trace (m) Tendency (°) Dip (°)
1 2.19 44.25 85.70 1.52 90.21 3.868 1.29 175.25 84.81
2 0.60 46.54 78.29 0.72 7.47 12.42 1.47 151.53 86.65
3 1.30 47.13 82.12 1.02 14.66 13.20 1.77 302.71 69.77
4 0.71 47.30 82.74 1.28 13.85 11.22 2.20 118.51 89.38
5 0.96 61.98 80.69 1.28 348.49 15.17 1.06 117.33 76.51
6 0.55 73.86 85.44 1.44 42.77 7.562 2.77 111.34 70.22
7 1.18 55.50 83.58 1.84 45.78 20.88 0.93 123.62 70.34
8 1.13 239.261 79.18 1.60 21.67 7.340 1.68 136.58 64.04
9 0.84 209.75 88.41 2.10 14.23 6.34 1.61 111.95 68.09
10 0.61 38.72 81.07 1.43 296.96 9.09 2.16 121.79 68.19
11 0.65 50.66 84.85 1.22 36.78 26.18 1.91 129.41 70.32
12 2.60 10.06 81.34 1.83 17.38 10.16 1.69 124.32 69.31
13 1.13 81.01 86.39 1.31 306.85 8.95 1.21 137.30 71.91
14 0.62 29.95 76.48 1.55 203.61 12.55 1.48 133.73 82.22
15 1.10 40.02 71.00 1.79 6.5836 8.75 1.63 145.07 81.95
16 0.54 18.53 60.65 1.34 59.68 17.50 1.53 109.38 86.27
17 1.03 258.40 84.35 1.09 73.37 2.11 1.21 309.30 89.58
18 1.08 238.86 88.28 2.68 40.36 3.37 2.14 141.01 88.13
19 1.96 83.60 68.83 2.06 32.27 12.84 0.84 132.81 78.93
20 0.68 72.09 63.58 1.24 65.44 21.70 2.50 131.76 77.91

3.4. Application of the Statistical Analysis Module and Data Through the statistical analysis of the structural plane,
Output Module. The statistical analysis was performed on the geometric parameter statistical distribution results of
the structural planes after clusterin. The mean and variance joint group 3 are shown in Figure 6.
of the tendency, dip, trace, spacing, strike, and bridge of each According to the statistical distribution results in
group of structural planes were obtained. The classification Figure 6, the data output module was used to output
information of the occurrence state of the structural plane the classification information of the occurrence of joint
was output. group 3, as shown in Table 4.
 Through the statistical analysis of the structural plane,
the geometric parameter statistical distribution results of 3.5. Application of the Drawing Module of Tendency, Dip, and
joint group 1 are shown in Figure 4. Strike Rose Diagrams. According to the rose diagram
 According to the statistical distribution results in drawing method, the tendency, dip, and strike rose diagram
Figure 4, the data output module was used to output the of each group of joints were drawn, as shown in Figures 7–9.
classification information of the occurrence of joint group 1,
as shown in Table 2. 4. Discussion
 Through the statistical analysis of the structural plane,
the geometric parameter statistical distribution results of The paper combined fuzzy equivalent clustering algorithm,
joint group 2 are shown in Figure 5. rose diagram drawing method, and C++ language and de-
 According to the statistical distribution results in Fig- veloped a drawing system for the pole diagram and rose
ure 5, the data output module was used to output the diagram of rock mass structural planes. The system con-
classification information of the occurrence of joint group 2, tained 8 modules, which could be easily applied to
as shown in Table 3. engineering.
Mobile Information Systems 7

 N
 330° 30°

 300°
 60°

 W E

 240° 120°

 210° 150°

 S
 Joint group 1
 Joint group 2
 Joint group 3
 Figure 3: The pole diagram of the structural plane.

 0.25 0.3 0.45
 0.4
 0.2 0.25
 0.35
 0.2 0.3
 Frequency

 Frequency

 Frequency
 0.15 0.25
 0.15
 0.1 0.2
 0.1 0.15
 0.05 0.1
 0.05
 0.05
 0 0 0
 12 24 36 48 60 72 84 96 4 8 12 16 20 24 28 32 150 200 250 300 350
 Tendency (°) Dip (°) Strike (m)

 (a) (b) (c)
 0.45 0.35
 0.4 0.3
 0.35
 0.3 0.25
 Frequency
 Frequency

 0.25 0.2
 0.2 0.15
 0.15 0.1
 0.1
 0.05 0.05
 0 0
 0.2 0.4 0.6 0.8 1 0.9 1.2 1.5 1.8 2.1 2.4
 Bridge (m) Trace (m)

 (d) (e)

Figure 4: The results of the statistical distribution of geometric parameters of joints group 1. The distribution rate of (a) tendency, (b) dip,
(c) strike, (d) bridge, and (e) trace.

 Table 2: The geometrical parameters and distribution of the discontinuities.
Joint group Eigenvalues Tendency (°) Dip (°) Strike (°) Bridge (m) Trace (m)
 Mean 35.09 12.79 270.15 0.48 1.42
 Standard deviation 24.83 7.09 60.36 0.21 0.34
Joint group 1
 Lognormal Lognormal
 Distribution rate Lognormal distribution Normal distribution Normal distribution
 distribution distribution
8 Mobile Information Systems

 0.25 0.4 0.25
 0.35
 0.2 0.3 0.2
 Frequency

 Frequency

 Frequency
 0.15 0.25 0.15
 0.2
 0.1 0.15 0.1
 0.05 0.1 0.05
 0.05
 0 0 0
 110 120 130 140 150 160 65 70 75 80 85 90 20 30 40 50 60 70
 Tendency (°) Dip (°) Strike (m)

 (a) (b) (c)
 0.35 0.3
 0.3 0.25
 0.25
 0.2

 Frequency
 Frequency

 0.2
 0.15
 0.15
 0.1
 0.1
 0.05 0.05
 0 0
 0.2 0.3 0.4 0.5 0.6 0.8 1.2 1.5 1.8 2.1 2.4 2.7
 Bridge (m) Trace (m)

 (d) (e)

Figure 5: The results of the statistical distribution of geometric parameters of joints group 2. The distribution rate of (a) tendency, (b) dip,
(c) strike, (d) bridge, and (e) trace.

 Table 3: The geometrical parameters and distribution of the discontinuities.
Joint group Eigenvalues Tendency (°) Dip (°) Strike (°) Bridge (m) Trace (m)
 Mean 131.96 80.02 41.96 0.32 1.41
 Standard deviation 13.53 7.44 13.53 0.13 0.5
Joint group 2
 Normal Negative exponential Normal
 Distribution rate Lognormal distribution Lognormal distribution
 distribution distribution distribution

 0.3 0.4 0.3
 0.25 0.35 0.25
 0.3
 0.2 0.2
 Frequency

 Frequency

 Frequency

 0.25
 0.15 0.2 0.15
 0.1 0.15 0.1
 0.1
 0.05 0.05 0.05
 0 0 0
 20 30 40 50 60 70 80 90 65 70 75 80 85 90 290 300 310 320 330 340 350 360
 Tendency (°) Dip (°) Strike (m)

 (a) (b) (c)
 0.6 0.4
 0.5 0.35
 0.3
 0.4
 Frequency

 Frequency

 0.25
 0.3 0.2
 0.2 0.15
 0.1
 0.1 0.05
 0 0
 0.25 0.4 0.55 0.7 0.75 1 1.25 1.5 1.75 2 2.25
 Bridge (m) Trace (m)

 (d) (e)

Figure 6: The results of the statistical distribution of geometric parameters of joints group 3. The distribution rate of (a) tendency. (b) dip,
(c) strike, (d) bridge, and (e) trace.
Mobile Information Systems 9

 Table 4: The geometrical parameters and distribution of the discontinuities.
Joint group Eigenvalues Tendency (°) Dip (°) Strike (°) Bridge (m) Trace (m)
 Mean 51.11 79.83 321.11 0.42 1.0
 Standard deviation 18.84 7.9 18.84 0.15 0.41
Joint group 3
 Normal Lognormal Normal
 Distribution rate Normal distribution Negative exponential distribution
 distribution distribution distribution

 90 90 90
 0.15 60 60
 120 120 120 60
 0.4 0.15
 0.10
 150 30 150 30 0.10 150 30
 0.2
 0.05 0.05

 0.00 180 0 0.0 180 0 0.00 180 0

 0.05 0.05
 0.2
 210 330 210 330 0.10 210 330
 0.10
 0.4
 0.15
 0.15 240 300 240 300 240 300
 270 270 270

 (a) (b) (c)

 Figure 7: Rose diagram of joint group 1. (a) The tendency rose diagram. (b) The dip rose diagram. (c) The strike rose diagram.

 90 90 90
 120 60 120 60 0.25 120 60
 0.15 0.6
 0.20
 0.10 30 0.4 150 0.15 30
 150 30 150
 0.10
 0.05 0.2
 0.05
 0.00 180 0 0.0 180 0 0.00 180 0

 0.05 0.2
 0.10 210 330 0.4 210 330 210 330

 0.15 0.6
 240 300 240 300 240 300
 270 270 270

 (a) (b) (c)

 Figure 8: Rose diagram of joint group 2. (a) The tendency rose diagram. (b) The dip rose diagram. (c) The strike rose diagram.

 90 90 90
 0.20 120 60 120 60 0.20 120 60
 0.6
 0.15 0.15
 150 30 0.4 150 30 150 30
 0.10 0.10
 0.05 0.2 0.05
 0.00 180 0 0.0 180 0 0.00 180 0
 0.05 0.2 0.05
 0.10 0.10
 210 330 0.4 210 330 210 330
 0.15 0.15
 0.6 0.20
 0.20 240 300 240 300 240 300
 270 270 270

 (a) (b) (c)

 Figure 9: Rose diagram of joint group 3. (a) The tendency rose diagram. (b) The dip rose diagram. (c) The strike rose diagram.
10 Mobile Information Systems

 The data import module can realize the recognition and included the import of data, the fuzzy equivalent clustering
import of the structural plane, which solves the difficulty of grouping, and the drawing of pole diagram, which realized
handling the complex structural planes on-site and reduces the rapid cluster analysis of the geometric parameters of
the inefficient and repetitive manual operation at the same structural planes. The system included statistical analysis and
time. a data output module, which realized the rapid acquisition
 The calculation module of the fuzzy equivalent clustering and analysis of the probability distribution form of the
algorithm realizes the rapid grouping of structural planes. geometric parameters of the structural plane. The system
This module is fast and efficient in processing the structure included a striking rose diagram, a trending rose diagram,
plane grouping, which saves a lot of processing time. and a dip rose diagram module, which realized the rapid
 The pole diagram drawing module can accurately obtain drawing and analysis of the rose diagram of the structural
the occurrence distribution and data of the structural plane. plane. Finally, the practicality and convenience of the system
This module overcomes the unobjectivity of grouping were verified through the application of engineering case
brought by personal experience and reflects the actual analysis.
distribution characteristics of the structure data.
 The statistical analysis module can perform statistical Data Availability
analysis on the mean value, variance, and probability dis-
tribution form of the geometric parameters of the structural The data used to support the findings of this study are
plane. This module solves the problems of large workload available from the corresponding author upon request.
and high repeatability in the statistical process, which im-
proves work efficiency.
 Conflicts of Interest
 The data output module outputs the grouping and
statistical analysis results of the structure plane. The author declares that there are no conflicts of interest
 The strike rose diagram drawing module, trending rose regarding the publication of this paper.
diagram drawing module, and dip rose diagram drawing
module can realize large-scale repetitive drawing of the trend
of multiple sets of structural planes, which reduces the
 Acknowledgments
workload and improves the work efficiency. The author appreciates the support of Zhejiang Collabora-
 At present, there are many articles and methods in the tive Innovation Center for Prevention and Control of
treatment of rock mass structural planes, but these articles Mountain Geological Hazards (PCMGH-2017-Y-05) and
and methods are often research and analysis on a certain part Key Laboratory of Rock Mechanics and Geohazards of
of the structural plane processing process, and there is no Zhejiang Province (ZGRMG-2019-07).
systematic and intelligent structural plane processing sys-
tem. In the application process, due to the complexity and
esoteric content, there are many program algorithms in- References
volved, which will cause users to be unable to effectively [1] K. Zhao, Q. Wang, Y. Yan et al., “Geological structural surface
implement a series of process operations from data import to evaluation model based on unascertained measure,” Geofluids,
analysis processing and graphic drawing of structure plane vol. 2019, Article ID 3547384, 7 pages, 2019.
data. It will be more difficult to apply, especially for be- [2] H. I. Chaminé, M. J. Afonso, L. Ramos et al., Scanline
ginners or laymen. The processing of structural plane data is Sampling Techniques for Rock Engineering Surveys: Insights
the most basic and most important link in the analysis of from Intrinsic Geologic Variability and Uncertainty, Springer
rock mass mechanics. If ordinary geological practitioners are International Publishing, Berlin, Germany, 2015.
not able to do simple analysis and application of structural [3] W. Xu, Y. Zhang, X. Li et al., “Extraction and statistics of
 discontinuity orientation and trace length from typical frac-
plane data, it will greatly reduce their enthusiasm for
 tured rock mass: a case study of the Xinchang underground
practicing. research laboratory site, China,” Engineering Geology, vol. 269,
 Therefore, this paper has developed a drawing system for Article ID 105553, 2020.
the pole diagram and rose diagram of rock mass structural [4] S. Manzoor, S. Liaghat, A. Gustafson, D. Johansson, and
planes, which realizes the digital process operation of the H. Schunnesson, “Establishing relationships between struc-
structural plane data import, classification, drawing, sta- tural data from close-range terrestrial digital photogrammetry
tistical analysis, and output. The research and development and measurement while drilling data,” Engineering Geology,
of this system are beneficial to the processing of the vol. 267, Article ID 105480, 2020.
structural surface in the field. [5] P. Wang, T. Qin, Z. Huang et al., “Fast identification of
 geometric properties of rock discontinuities based on 3D
 point cloud,” Chinese Journal of Rock Mechanics and Engi-
5. Conclusion neering, vol. 40, no. 3, pp. 503–519, 2021, in Chinese.
 [6] G. M. Dong, L. C. Shu, M. M. Wang et al., “Application of
The paper combined fuzzy equivalent clustering algorithm, fuzzy information diffusion method in fissure structural plane
rose diagram drawing method, and C++ language and de- analysis,” Journal of Central South University (Science and
veloped a drawing system for the pole diagram and rose Technology), vol. 42, no. 8, pp. 2493–2498, 2011.
diagram of rock mass structural planes, which realized the [7] Z. Tao, Y. Liu, C. Zhu et al., “Comprehensive engineering
rapid analysis and drawing of structural planes. The system geological analysis on large-scale anti-dip slopes: a case study
Mobile Information Systems 11

 of changshanhao opencast gold mine in China,” Geotechnical
 and Geological Engineering, vol. 39, no. 5, pp. 1–20, 2020.
 [8] X. Wei, Y. Guo, H. Cheng et al., “Rock mass characteristics in
 beishan, a preselected area for China’s high-level radioactive
 waste disposal,” Acta Geologica Sinica, vol. 93, no. 2,
 pp. 116–126, 2019.
 [9] Y. U. Jifeng, L. I. Zhenghong, and X. Chen, “Automatic
 plotting of rose diagram with geological data and its appli-
 cation,” Journal of Shandong University of Science and
 Technology (Natural Science), vol. 36, no. 3, pp. 1–8, 2017.
[10] S. Li, H. Liu, L. Li et al., “A quantitative method for rock
 structure at working faces of tunnels based on digital images
 and its application,” Chinese Journal of Rock Mechanics and
 Engineering, vol. 36, no. 1, pp. 1–9, 2017, in Chinese.
[11] K. Zhao, Q. Wang, J. Wang et al., “Structural plane charac-
 teristics and stability of broken surrounding rocks,” China
 Safety Science Journal, vol. 29, no. 9, pp. 138–143, 2019.
[12] W. Zhong, Z. Y. Tan, and L. Qiao, “Stability analysis of rock
 slope based on preferred structural plane,” Advanced Mate-
 rials Research, vol. 243–249, pp. 2254–2258, 2011.
[13] H. Li, X. Liu, T. Li, and R. Gan, “A novel density-based
 clustering algorithm using nearest neighbor graph,” Pattern
 Recognition, vol. 102, Article ID 107206, 2020.
[14] Q. Hou, Y. Rui, S. Du et al., “A method for clustering ori-
 entation data of discontinuities of rock mass based on netting
 algorithm,” Chinese Journal of Rock Mechanics and Engi-
 neering, vol. 39, no. 1, pp. 2871–2881, 2020, in Chinese.
[15] X. Li, Z. Wang, P. Kang et al., “Ant colony ATTA clustering
 algorithm of rock mass structural plane in groups,” Journal of
 Central South University, vol. 21, no. 2, 2014.
[16] L. I. Jun, H. U. Bin, K. Zhu et al., “An improved fast clustering
 analysis method for attitude of structural plane in rock mass,”
 Journal of Yangtze River Scientific Research Institute, vol. 33,
 no. 8, pp. 96–99, 2016.
[17] J. Guo, S. Liu, P. Zhang et al., “Towards semi-automatic rock
 mass discontinuity orientation and set analysis from 3D point
 clouds,” Computers and Geosciences, vol. 103, 2017.
[18] H. Bei, Y. Mao, W. Wang, and X. Zhang, “Fuzzy clustering
 method based on improved weighted distance,” Mathematical
 Problems in Engineering, vol. 2021, Article ID 6687202,
 11 pages, 2021.
You can also read