A European comparison of electricity and gas prices for large industrial consumers
←
→
Page content transcription
If your browser does not render page correctly, please read the page content below
A European
                comparison of
                electricity and gas
                prices for large
                industrial consumers
28 April 2015
Final report

                PwC Enterprise Advisory cvba/scrl
                Maatschappelijke zetel/Siège social: Woluwe Garden, Woluwedal 18, B-1932 Sint-Stevens-
                Woluwe
                T: +32 (0)2 710 4211, F: +32 (0)2 710 4299, www.pwc.com
                BTW/TVA BE 0415.622.333 / RPR Brussel - RPM Bruxelles / ING BE32 310138119602 - BIC
                BBRUBEBB /
                RBS BE03 7205 4043 3084 - BIC ABNABEBR
Table of contents

Contents
Table of contents .................................................................................... 1
1. Executive Summary ............................................................................ 5
     1.1. Executive Summary – English ......................................................................... 5
     1.2. Executive Summary – Nederlands ..................................................................6
     1.3. Executive Summary – Français ....................................................................... 7
2. Introduction .......................................................................................9
3. Description of the dataset ................................................................ 11
     3.1. Consumer profiles .......................................................................................... 11
     3.2. Economic analysis of consumer profiles ...................................................... 12
     3.3. Table of acronyms .......................................................................................... 14
     3.4. Electricity: Countries/zone(s) identified ...................................................... 15
     3.5. Gas: Countries/zone(s) identified ................................................................. 19
     3.6. Summary table on number of zones per country ........................................ 23
     3.7. General Assumptions .................................................................................... 24
4. Electricity: Detailed description of the prices, price components and
assumptions .........................................................................................26
     4.1. Belgium .......................................................................................................... 26
     4.2. Germany ........................................................................................................ 29
     4.3. France ............................................................................................................ 34
     4.4. The Netherlands ............................................................................................ 37
     4.5. United Kingdom ............................................................................................ 39
5. Gas: Detailed description of the prices, price components and
assumptions .........................................................................................42
     5.1. Belgium .......................................................................................................... 42
     5.2. Germany ........................................................................................................ 44
     5.3. France .............................................................................................................45
     5.4. The Netherlands............................................................................................ 46
     5.5. United Kingdom ............................................................................................ 48
6. Presentation and interpretation of results .......................................50
     6.1. Interpretation of figures ............................................................................... 50
     6.2. Profile E1 (Electricity) ................................................................................... 51
     6.3. Profile E2 (Electricity) ................................................................................... 55
     6.4. Profile E3 (Electricity) ...................................................................................59
     6.5. Profiles E1 – E2 – E3: Burden of extra costs............................................... 64
     6.6. Profile G1 (Gas) ..............................................................................................65

CREG – A European comparison of electricity and gas prices for large industrial consumers
21 April 2015
[1]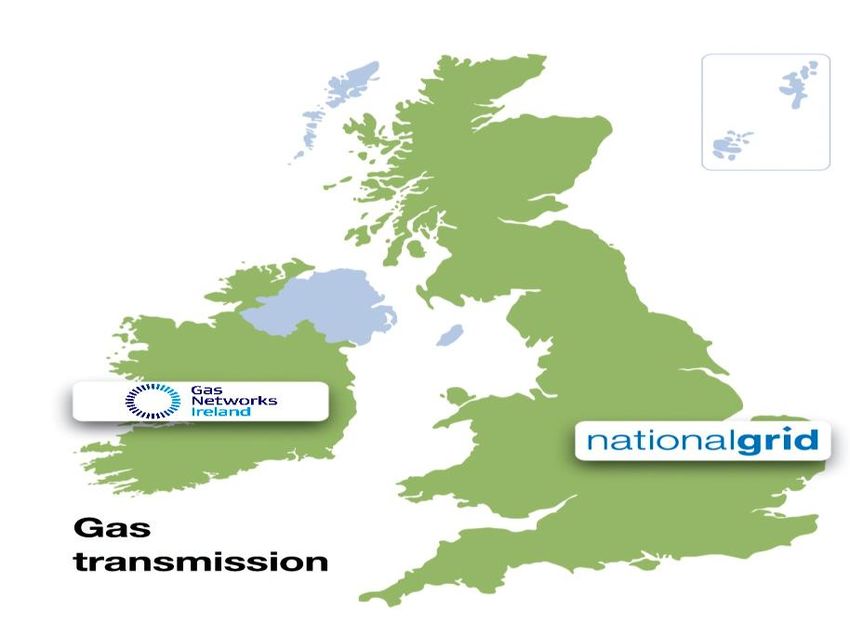
7. Conclusion .......................................................................................69
Annex A: Graphical data ...................................................................... 76
     Profile E1 (Electricity) ........................................................................................... 76
     Profile E2 (Electricity) ..........................................................................................78
     Profile E3 (Electricity) ......................................................................................... 80
     Profile G1 (Gas) .................................................................................................... 82
Annex B: Sources ................................................................................ 84
     Commodity prices ................................................................................................ 84
     Transport cost ...................................................................................................... 84
     Taxes, levies and certificate schemes .................................................................. 84
Annex C: Industry reduction criteria ...................................................85
     Electricity ............................................................................................................. 85
     Gas ........................................................................................................................ 88

CREG – A European comparison of electricity and gas prices for large industrial consumers
21 April 2015
[2]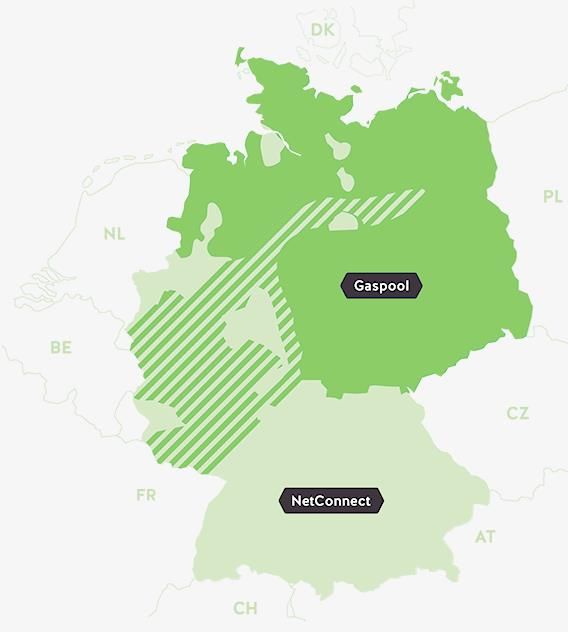
Figures
Figure 1: Total yearly invoice in kEUR/year (profile E1) .......................................... 51
Figure 2: Total yearly invoice comparison in % (profile E1) .................................... 52
Figure 3: Average power price by component in EUR/MWh (profile E1) .............. 53
Figure 4: Total yearly invoice in kEUR/year (profile E2) .........................................55
Figure 5: Total yearly invoice comparison in % (profile E2) .................................... 56
Figure 6: Average power price by component in EUR/MWh (profile E2) ..............57
Figure 7: Total yearly invoice in kEUR/year (profile E3) ......................................... 59
Figure 8: Total yearly invoice comparison in % (profile E3).................................... 60
Figure 9: Average power price by component in EUR/MWh (profile E3) ............... 61
Figure 10: Transmission tariff reductions (profile E3)............................................. 62
Figure 11: Taxes, levies and certificate schemes throughout 3 profiles ................... 64
Figure 12: Total yearly invoice in kEUR/year (profile G1) ....................................... 65
Figure 13: Total yearly invoice comparison in % (profile G1) .................................. 66
Figure 14: Average gas price by component in EUR/MWh (profile G1) ................. 67
Figure 15: Competitiveness scorecard ....................................................................... 70
Figure 16: Gross price evolutions Oct 2014 – March 2015 (Electricity) ...................73
Figure 17: Gross price evolutions Oct 2014-March 2015 (natural gas) ................... 74
Figure 18: Average power price in EUR/MWh (profile E1) ..................................... 76
Figure 19: Commodity price in EUR/MWh (profile E1) ........................................... 76
Figure 20: Transport cost in EUR/MWh (profile E1)................................................ 77
Figure 21: Taxes, levies & certificate scheme in EUR/MWh (profile E1) ................. 77
Figure 22: Average power price in EUR/MWh (profile E2) ..................................... 78
Figure 23: Commodity price in EUR/MWh (profile E2) .......................................... 78
Figure 24: Transport cost in EUR/MWh (profile E2) .............................................. 79
Figure 25: Taxes, levies & certificate scheme in EUR/MWh (profile E2) ............... 79
Figure 26: Average power price in EUR/MWh (profile E3) ..................................... 80
Figure 27: Commodity price in EUR/MWh (profile E3) .......................................... 80
Figure 28: Transport cost in EUR/MWh (profile E3) ............................................... 81
Figure 29: Taxes, levies & certificate scheme in EUR/MWh (profile E3) ................ 81
Figure 30: Average gas price in EUR/MWh (profile G1) ......................................... 82
Figure 31: Commodity price in EUR/MWh (profile G1) .......................................... 82
Figure 32: Transport cost in EUR/MWh (profile G1) .............................................. 83
Figure 33: Taxes, levies & certificate scheme in EUR/MWh (profile G1) ............... 83

CREG – A European comparison of electricity and gas prices for large industrial consumers
21 April 2015
[3]
Executive
Summary
1. Executive Summary
1.1. Executive Summary – English
In this report, we compare energy prices for four industrial consumers (three
electricity, one gas) between Belgium and four other countries: Germany, the
Netherlands, France and the United Kingdom. When relevant, results are not
presented on a countrywide basis but rather on a regional basis. The comparison
looks at three components of the bill: commodity cost, transport cost and all other
costs: taxes, levies, certificate schemes.
General hypotheses are adopted and their application across different countries is
carefully described in order to maximize the objectivity of the comparison. Energy
costs are analysed from the bottom-up, and the different price components are
described in a detailed way in order to offer a clear view the origins of the observed
results.
In terms of electricity, this report highlights a great deal of complexity as a
consequence of government intervention aiming at reducing electricity costs for
some categories of large industrial consumers. These interventions are specifically
targeted at the second (transport costs) and third component (taxes, levies,
certificate schemes).
While the United Kingdom is an (expensive) outlier for all electricity profiles,
Germany offers the lowest and the highest possible electricity cost for every profile
under review. The application of several tax and transport cost reductions in
Germany depends on a host of very specific economic and geographic criteria, which
obliges us to present the result in terms of a fairly large range of possibilities.
Commodity cost makes up for a more important part of the gas bill than the
electricity bill, but its impact on the differences between countries is larger for
electricity than for gas. France and Germany have a sizeable competitive advantage
on the other countries in terms of electricity commodity cost, while gas market prices
are largely identical across the observed countries (except for the southern part of
France).
For gas prices, the differences observed between countries are smaller than for
electricity, as are the ranges of possibilities within countries. We observe
considerably less complexity and government intervention with regards to taxes and
transport costs.
In terms of Belgian competitiveness, general conclusions are mixed. For large
industrial baseload consumers, Belgium has a low competitiveness score: it is only
certain to offer more competitive prices than the United Kingdom. For (smaller)
industrial peakload electricity consumers, the picture is more nuanced with
important differences between the three Belgian regions. When connected at lower
voltage levels, industrial peakload consumers in the Brussels and Flemish regions
are relatively well-positioned compared to the other countries, while the Walloon
region offers a substantially higher cost. When connected at higher voltage levels,
the same conclusions can be drawn for industrial peakload consumers, but with less
outspoken differences between the regions. For industrial gas consumers, Belgium
offers the lowest cost of all countries studied in this report.

CREG – A European comparison of electricity and gas prices for large industrial consumers
21 April 2015
[5]
1.2. Executive Summary – Nederlands
In deze studie worden de energieprijzen voor vier industriële verbruikers (drie in
elektriciteit en één in aardgas) vergeleken in België en vier andere landen: Duitsland,
Nederland, Frankrijk en het Verenigd Koninkrijk. Wanneer dat relevant is, worden
de resultaten niet op nationale basis gepresenteerd, maar wel in zones. De
vergelijking behandelt de drie componenten van de eindfactuur: de commodity, het
transport en alle andere kosten: belastingen, toeslagen en certificaatsystemen.
Met als doel om een zo objectief mogelijke vergelijking te realiseren worden een
aantal algemene hypotheses aangenomen en de toepassing ervan wordt zorgvuldig
beschreven. De totale energiekost wordt volledig opgebouwd van aan de basis,
waarbij de verschillende componenten in detail beschreven worden om een duidelijk
zicht te houden op de oorsprong van de eindresultaten.
Voor elektriciteit stelt dit rapport een grote complexiteit vast als gevolg van
overheidsinterventies die erop gericht zijn de elektriciteitskost voor sommige
categorieën grote industriële verbruikers te verminderen. Deze ingrepen zijn
specifiek gericht op de tweede (transportkost) en derde prijscomponent
(belastingen, toeslagen en certificaatsystemen).
We stellen vast dat het Verenigd Koninkrijk voor de drie verbruiksprofielen voor
elektriciteit duur is, terwijl Duitsland zowel de laagst mogelijke als de hoogst
mogelijke elektriciteitskost biedt voor dezelfde drie profielen. Het van toepassing
zijn van de verschillende verminderingen op de transportkost en de belastingen
hangt immers af van een hele reeks specifieke economische en geografische criteria,
waardoor wij als resultaat een relatief breed bereik aan mogelijkheden voorstellen.
De kost van de commodity heeft een groter aandeel in de eindprijs voor aardgas dan
voor elektriciteit, maar speelt een meer bepalende rol voor elektriciteit. Frankrijk en
Duitsland hebben een substantieel competitief voordeel op de andere landen qua
commoditykost voor elektriciteit, terwijl de marktprijzen voor aardgas grotendeels
gelijklopen in de verschillende landen (met uitzondering van het zuidelijk deel van
Frankrijk).
Voor wat betreft aardgas zijn de verschillen tussen de verschillende landen kleiner
dan voor elektriciteit, en ook het bereik aan mogelijkheden binnen de landen is
kleiner. In het algemeen is de prijssamenstelling minder complex en stellen we
minder overheidsinterventie vast op gebied van transportkosten en belastingen.
Voor wat betreft de competitiviteit van België zijn de conclusies gemengd. Voor grote
baseload      industriële    elektriciteitsverbruikers    heeft   België    een   lage
competitiviteitsscore: het kan enkel met zekerheid een lagere kost aanbieden dan
het    Verenigd      Koninkrijk.     Voor     de    kleinere    industriële   peakload
elektriciteitsverbruikers is het besluit meer genuanceerd, met belangrijke
verschillen tussen de drie gewesten. Voor industriële peakloadverbruikers
aangesloten op lagere spanning zijn Brussel en Vlaanderen relatief goed
gepositioneerd in vergelijking met de andere landen, terwijl Wallonië een duidelijke
hogere kost heeft. Bij aansluiting op een hoger spanningsniveau zien we een
gelijkaardige resultaat, maar met minder uitgesproken verschillen tussen de drie
gewesten. Voor industriële aardgasverbruikers is de conclusie wel erg duidelijk: de
kost in België is de laagste van alle onderzochte landen.

CREG – A European comparison of electricity and gas prices for large industrial consumers
21 April 2015
[6]
1.3. Executive Summary – Français
Dans ce rapport, nous menons une comparaison des prix de l’énergie pour quatre
profils de consommateurs industriels (trois en électricité, un en gaz) entre la
Belgique et quatre autres pays: l’Allemagne, les Pays-Bas, la France et le Royaume-
Uni. Lorsque pertinent, les résultats ne sont pas présentés sur une base nationale
mais sur une base régionale. La comparaison traite les trois composantes de la
facture finale: le coût de la commodité, le coût du transport et tous les autres coûts:
taxes, surcharges et systèmes de certificats verts et autres.
Des hypothèses générales sont adoptées et leur application est décrite de façon
détaillée afin de maximiser l’objectivité de la comparaison. Le coût total de l’énergie
est analysé et reconstruit à partir de zéro, tout en décrivant les différentes
composantes de façon détaillée afin d’offrir une vue aussi claire que possible sur
l’origine des résultats observés.
En ce qui concerne l’électricité, ce rapport met en exergue la grande complexité
causée par des interventions gouvernementales qui visent à réduire le coût de
l’électricité pour certaines catégories de grands consommateurs industriels. Ces
interventions concernent surtout la deuxième (transport) et troisième composante
(taxes, surcharges et systèmes de certificats).
Pendant que le Royaume-Uni se situe en permanence très haut (cher) dans les
résultats, l’Allemagne offre à la fois la possibilité du coût le plus bas et du coût le plus
haut de l’échantillon étudié. L’application des nombreuses réductions de taxes et
surcharges en Allemagne dépend d’une série de critères économiques et
géographiques très détaillés qui nous oblige à présenter le résultat comme une
gamme de possibilités relativement large.
Le coût de la commodité représente une part plus importante du coût total pour le
gaz que pour l’électricité, mais son rôle est plus déterminant en électricité.
L’Allemagne et la France ont un avantage compétitif considérable par rapport aux
autres pays en termes de coût de la commodité, alors que les prix sur les marchés du
gaz sont généralement très similaires dans les pays de l’échantillon (hormis la partie
méridionale de la France).
En ce qui concerne le gaz, les différences de prix final observées tout comme les
gammes de résultats possibles sont moins grandes que pour l’électricité. Nous
observons moins de complexité et d’intervention gouvernementale dans les taxes et
les coûts de transport.
En ce qui concerne la compétitivité de la Belgique, les conclusions générales sont
mixtes. La Belgique a un score de compétitivité bas pour les grands consommateurs
d’électricité baseload : elle peut garantir un coût plus bas qu’un seul autre pays (le
Royaume-Uni). Pour les (moins grands) consommateurs d’électricité peakload, la
conclusion est plus nuancée, avec de grandes différences entre les trois Régions
belges. En cas de connexion au réseau de transport local, les consommateurs
industriels peakload à Bruxelles et en Flandre sont relativement bien positionnés
par rapport aux autres pays, tandis que la Wallonie offre un coût substantiellement
plus élevé. En cas de connexion à un niveau de tension supérieur à celui du transport
local, la situation pour les consommateurs industriels peakload est généralement la
même, mais avec des différences moins importantes entre les trois Régions. Pour les
consommateurs industriels de gaz naturel, la Belgique offre le coût le plus bas de
tous les pays étudiés dans ce rapport.

CREG – A European comparison of electricity and gas prices for large industrial consumers
21 April 2015
[7]
Introduction
2. Introduction
This report was commissioned by CREG, the Belgian federal regulator for Energy
and Gas, in November 2014. In the framework of CREG’s larger mission of
supervising transparency and competition on the market, ensuring market
conditions serve the public interest, and safeguarding consumers’ essential
interests, PricewaterhouseCoopers was asked to conduct a study comparing
industrial energy prices in Belgium and the neighbouring countries.
The purpose of this study is to compare the gas and electricity prices, in total as well
as per component, billed to large industrial consumers in the three Belgian regions
(Wallonia, Flanders, Brussels capital region) with those in Germany, France, the
Netherlands and Great-Britain. The focus is mainly put on the comparison of all
costs that do not directly relate to the commodity cost: transport, taxes, levies, public
service obligations, certificate schemes, etc…
In terms of methodology, we built up the energy cost from the bottom up, identifying
three main components: the commodity price, the transport cost, and all other costs
(taxes, levies and certificate schemes). These three components are analysed and
compared looking at four industrial consumer profiles: two peakload industrial
electricity consumers (with different connection levels to the grid), one large
baseload industrial electricity consumer, and one baseload gas industrial consumer.
In terms of structure, this report first describes the dataset: the general assumptions
in terms of consumer profiles and consumer behaviour, completed by an overview
of the different zones identified in all five countries under review. We then move on
to a detailed description of the deconstructed energy cost for gas and for electricity,
carefully describing the observed regulatory framework.
In the last part of this report, we present the results per consumer profile, using a
double analysis approach: how energy prices in Belgium compare to the other four
countries, and how the three components of the energy price explain the observed
final results. We also attach particular attention to the comparison of the second
(transport costs) and third (taxes, levies, certificate schemes) components. In a
general conclusion, we highlight the impact of the observed results in terms of
competitiveness for Belgian industrial energy consumers.
A preliminary version of this report was submitted for review by the
energy regulators of France (CRE), Germany (Bundesnetzagentur), the
Netherlands (ACM) and the United Kingdom (OFGEM). This final report
integrates their remarks as well as those formulated by the CREG.

CREG – A European comparison of electricity and gas prices for large industrial consumers
21 April 2015
[9]
Description of the
dataset
3. Description of the dataset
3.1. Consumer profiles
Four consumption profiles have been defined to compare the situation between the
five countries under review.
These profiles are described in the following table, and were provided by the CREG.
The power sector comprises three profiles (E1, E2, E3) while the gas sector has only
one profile (G1).
                             E1                   E2                    E3
                                                                                               G1
     Profiles            (Electricity         (Electricity          (Electricity
                                                                                             (Gas 1)
                              1)                  2)                    3)
     Annual
                         25.000 MWh           25.000 MWh           250.000 MWh          100.000 MWh
     demand
                         Stable, 8am-          Stable, 8am-              Flat
 Consumption
                          6pm, work             6pm, work          throughout the            Stable
    profile
                           days only             days only         year (baseload)
 Consumption
                             2.527                 2.527                8.760                8.000
  hours/year
   Connection              30-70 kV              ≥ 150 kV             ≥ 150 kV
    Maximum
                           9.893 kW             9.893 kW             28.539 kW              15.000 kW
     capacity

All considered profiles are built on the basis of simplifying hypotheses. The
emphasis is put on the energy consumption, the consumption hours and (for
electricity) the voltage level of the grid connection. Other variables, such as
maximum capacity, are a function of those hypotheses.
Profiles E1 and E2 are peakload electricity consumers with an annual consumption
of 25 GWh. The difference between them is the voltage level of their grid connection;
while profile E1 is connected at a medium/high voltage level (the local transmission
grid in Belgium), profile E2 is connected to the (very) high voltage level (the
transmission grid in Belgium).
Profile E3 is a large baseload consumer with an annual consumption of 250 GWh
and connected to the grid at a tension level of 150 kV or higher. While profile E3’s
consumption is tenfold that of profiles E1 and E2, its maximum power subscription
is only three times as high as that of E1 and E2. This is caused by the peakload
consumption profile of E1 and E2: they only consume electricity on week days
between 8am and 6pm, which lowers their consumption hours to +/- 2500. As we
will see later on in this study, this has an impact on transport tariffs that often charge
part of the grid cost based on the maximum power capacity.
It is important to note that the electricity consumption profiles are assumed to have
a totally predictable and flat load profile during the load period. Possible reactive
energy is not taken into account, and neither are possible occasional power capacity
overshootings.
Profile G1 is a large baseload gas consumer, with an annual consumption of 100
GWh and 8000 consumption hours. The maximum capacity is 15 MW and the
consumer is directly connected to the gas transmission grid.
This study is based on theoretical consumption profiles in order to enable a maximal
level of objectivity while comparing the different countries/zones. As a consequence
they do not refer either to a specific sectoral profile.

CREG – A European comparison of electricity and gas prices for large industrial consumers
21 April 2015
[11]
3.2. Economic analysis of consumer profiles
Even though the consumption profiles under review are purely theoretical, it might
nonetheless be clarifying to have a brief look at the economic background and
possible industrial occupation of these consumers.
Looking at Belgian data, we can identify several agro alimentary industrial sites that
broadly fit the consumption criteria (25 GWh/year) set for profiles E1 and E2. For
profile E3 (250 Gwh/year), we can identify several large (but not the largest)
industrial plants from the iron and steel sector, and some chemical industry. These
are mere indications of what type of industrial consumer we could be looking at, but
by no means an attempt to contain the consumer profiles we use within a certain
sector.
Looking at Eurostat-data based on the NACE-categorization of industrial sectors, we
observe a similar conclusion in relative terms: the largest electricity consumers can
generally be found in the iron and steel and the chemical/petrochemical sectors. In
absolute terms, these numbers are heavily negatively impacted by the fact the
denominator is not filtered on relevance: every single enterprise with an enterprise
number is absorbed in the denominator, whether it is active or not. In relative terms,
however, these data give a reliable idea of which sectors of the economy harbour
large energy consumers.
Source: Eurostat data, 2012
The iron and steel industry and the chemical/petrochemical sector show by far the
highest average electricity consumption per enterprise, while the food sector (agro-
alimentary included) is on average a more modest consumer. The two main electro-
intensive sectors are also clearly the two sectors with the largest gas consumers.
CREG – A European comparison of electricity and gas prices for large industrial consumers
21 April 2015
[12]Source: Eurostat data, 2012
In the framework of this study, the importance of these energy-intensive sectors for
an economy is very useful information in assessing the impact of possible price
differences on the competitiveness of an entire economy. When looking at the added
value created by the sectors that we deem close to the consumer profiles under
review in this study, and offsetting it against the Gross Domestic Product, we can
draw some interesting conclusions.
Source: Eurostat data, 2012
First and foremost, we observe that Belgium is the country where the (electro-
intensive) chemical/petrochemical sector is of the largest importance in economic
terms, closely followed by the Netherlands. Germany and Belgium are the two
countries where the iron and steel industry is most important compared to the
economy as a whole.
Regarding less energy-intensive economic sectors, linking the consumer profiles in
this study to broader economic data is a more complex issue. Nevertheless, the
importance of the food and tobacco-industry in the Netherlands might indicate a
relatively higher presence of consumers comparable to consumer profiles E1/E2.
CREG – A European comparison of electricity and gas prices for large industrial consumers
21 April 2015
[13]3.3. Table of acronyms
Acronym Description
Anglo-Dutch Energy exchange operating
APX electricity spot markets in the Netherlands, the
UK and Belgium
Calendar product, which is a power future on a
Cal
12-month basis
DAM Day Ahead Market
DSO Distribution System Operator
German energy exchange, active in Central-
EEX
Europe and France
European power exchange (partly held by EEX)
EPEX SPOT operating spot and intraday markets, active in
France, Germany, Austria and Switzerland
Power derivatives exchange providing power
ICE ENDEX
futures for Belgium and the Netherlands
LTSO Local Transport System Operator
Monthly, which is a power future on a monthly
Mi
basis
NBP National Balancing Point, British gas exchange
NetConnect Germany, one of the two gas market
NCG
areas in Germany
‘Point d’échange de gaz’, gas exchange in France
PEG
(PEG Nord, PEG Sud, PEG TIGF)
Quarterly, which is a power future on a three-
Qi
monthly basis
TSO Transmission System Operator
TTF Dutch gas exchange
CREG – A European comparison of electricity and gas prices for large industrial consumers
21 April 2015
[14]3.4. Electricity: Countries/zone(s)
identified
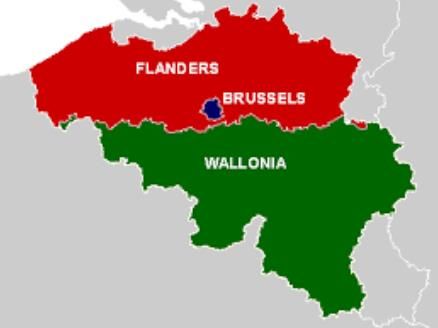
Belgium
Belgium is divided in three regions, respectively Flanders, Wallonia and the Brussels
Region as mapped below.
Even though commodity cost for industrial electricity consumers is assumed to be
identical for the entire territory of Belgium, it is logical to analyse the three regions
separately because of the existence of a double regional impact on the third price
component: taxes, levies and certificate schemes.
The first impact is caused by the regional public service obligations that are a
consequence of the transmission grid situation that is summarized in the table
below. Elia operates as LTSO for profile E1 and as TSO for profile E2 and E3. While
the same transmission tariffs apply for the three profiles, the regions can impose
public service obligations on Elia on their territory for users of the 30-70 kV grid.
Voltage Operator in charge Operator in Belgium
Distribution System
< 30kV Several
Operator (DSO)
Local Transmission System
30 kV< x < 70 kV Elia in the 3 regions
Operator (LTSO)
Transmission System Elia (federal)
> 70kV
operator (TSO)
The second regional impact within Belgium is caused by the certificate schemes that
stem from the regional competence in terms of renewable energy obligations on
their territory. Flanders, Wallonia and the Brussels Capital region each impose their
own green certificate scheme on all electricity consumers within their region.
Apart from looking at the Belgian case through the three regional cases, we also
make several other assumptions: the three electricity consumers under review are
part of an energy efficiency agreement and belong to the sectoral NACE-BEL
classification codes 5-33 (all industry).
CREG – A European comparison of electricity and gas prices for large industrial consumers
21 April 2015
[15]Germany
Within the German territory, consumers can take part in one single electricity
market and we therefore assume that the commodity cost is equal for the whole of
Germany. As to taxes, levies and certificate schemes, we observe no regional
differences for electricity consumers, not even for the local taxes .1
On the German territory, four different TSO’s are active; their corresponding
geographical coverage is depicted below.
1. The West region which is made of Nordrhein-Westfalen, Rheinland-Pfalz
and Saarland, where Amprion is the TSO.
2. The South-West region which is made of Baden-Württemberg where
Transnet BW is the TSO.
3. The Central region which is made of Niedersachsen, Hessen, Bayern,
Schleswig-Holstein and where Tennet operates the transmission grid.
4. The East region which is made of former East-Germany and Hamburg; 50
Hertz operates the transmission grid in this region.
Given the geographical and economic importance of these four zones (even the
smallest one has as many inhabitants as the whole of Belgium), it is logical to treat
these four zones the same way as we treat the three Belgian regions. They will hence
be analysed separately.
Given the particular setup of the German electricity grid, profiles E1 and E2 will also
pay a distribution cost (explained in further detail in section 4.2). As Germany
counts about 870 distribution system operators2, and as distribution and
transmission tariffs are integrated (two layers presented in one single tariff), the four
1 The Konzessionsabgabe is a local tax that applies to all electricity consumers connected to the
distribution grid, but it is fixed on a national level and capped at one single rate for industrial consumers
(Konzessionsabgabenverordnung, § 1-2).
2 From Distribution networks to smart Distribution systems : rethinking the regulation of European
electricity DSO’s, European University Institute, THINK paper topic 12, Final report, 2013, pgs. 12-13.
CREG – A European comparison of electricity and gas prices for large industrial consumers
21 April 2015
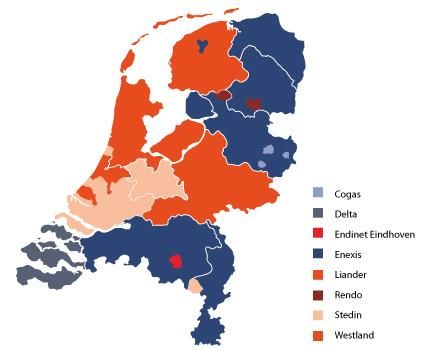
[16]transmission zones remain the most relevant way of presenting the results for Germany. France In terms of electricity market, France will be treated as one single zone. The same commodity cost, transmission tariffs and taxes and levies apply everywhere on the national territory. The Netherlands The Netherlands will also be treated as one single zone in this study. In terms of commodity costs and taxes, levies and certificates schemes, no regional differences are observed: there is one single electricity market and the only taxes on electricity are imposed on a national basis. On the grid cost level, the situation is somewhat more complicated. The Netherlands counts only one TSO: Tennet. For this reason, the tariff methodology implemented is the same throughout the national transmission grid. The Dutch distribution grid, however, covers the entire grid below the 110 kV voltage level and hence profile E1 also pays distribution tariffs. The Dutch distribution network counts eight different DSO’s of different size and importance (see map below), who each apply different tariffs. As is the case in Germany, these distribution costs are integrated with transmission costs (two layers integrated in one cumulative tariff). These DSO’s are characterized by differences in size and number/type of clients. For profile E1, we will therefore present a weighted average of distribution tariffs in accordance with the amount of electricity transported by the DSO’s. CREG – A European comparison of electricity and gas prices for large industrial consumers 21 April 2015 [17]
United Kingdom
As is the case for France and the Netherlands, the United Kingdom will also be
treated as one single zone in this study. In terms of commodity costs and taxes, levies
and certificates schemes, no regional differences are observed: there is one single
electricity market and the only taxes on electricity are imposed on a national basis.
In terms of grid costs, the United Kingdom has three transmission system operators:
     1.   National Grid (for England and Wales);
     2. Scottish Hydro Electric Transmission (SHET);
     3. Scottish Power Transmission (SPT).
On top of these three transmission system operators, six distribution system
operator groups are active.3 The TSO’s and DSO’s all charge different tariffs in the
same fourteen tariff zones in the UK (without Northern Ireland).

                                                                     TSO              DSO            Zones

                                                                       3
                                                                                       6               14
                                                                                                    Northern
                                                                 Scottish Hydro    Scottish and     Scotland
                                                                   Electricity      Southern
                                                                 Transmission     Energy Power
                                                                                                    Southern
                                                                     (SHE)         Distribution

                                                                                                    Southern
                                                                 Scottish Power                     Scotland
                                                                                    SP Energy
                                                                 Transmission
                                                                                    Networks      North Wales &
                                                                      (SPT)
                                                                                                    Mersey
                                                                                   Electricity
                                                                                                   North West
                                                                                   North West
                                                                                    Northern        Northern
                                                                                   Power Grid       Yorkshire
                                                                                                     Eastern
                                                                 National Grid      UK Power
                                                                                                     London
                                                                  Electricity       Network
                                                                                                   South East
                                                                 Transmission
                                                                   (NGET)                         East Midlands

                                                                                  Western Power     Midlands
                                                                                   Distribution    South Wales

                                                                                                  South Western

For grid costs - transmission tariffs for profile E3, transmission and distribution
tariffs for profiles E1 and E2 - we will hence present average values for all fourteen
zones.
As to taxes and levies, we assume that industrial consumers considered in this study
are all part of a Climate Change Agreement.

3In addition to these large DSO’s, the UK also has some smaller Independent Network
Operators (IDNO’s). These are not taken into account in this study.

CREG – A European comparison of electricity and gas prices for large industrial consumers
21 April 2015
[18]
3.5. Gas: Countries/zone(s) identified Belgium In terms of commodity cost and transport cost, no regional differences are observed in Belgium. The same commodity prices on the gas market are available to all consumers, and Belgium counts only one Transmission system operator: Fluxys Belgium. About 230 clients are directly connected to the transmission system, and profile G1 is assumed to be part of this group of directly connected clients.4 In terms of taxes and levies, however, some (very) small differences exist between regions. This is why we present the results for Belgium in the same way as we did for electricity: a separate analysis for Wallonia, Flanders and the Brussels capital region. Germany The only component of the gas price for our profile under review that does not show any regional differences is the taxes and levies component. In terms of commodity price, Germany has two market areas: (Gaspool and Netconnect Germany) and twelve different transmission system operators. Each of them is mainly active in one market area, but some of them are active in both. 4None of these clients directly connected to the transport grid is located in the Brussels Captial Region. CREG – A European comparison of electricity and gas prices for large industrial consumers 21 April 2015 [19]
1. In the Gaspool area, the following operators are active: Gascade, GTG Nord,
OntrasGastransport GmbH, Jordgas Transport, Nowega, Gasunie.
2. NetConnect Germany (NCG) counts the following TSO’s in its area:
Bayernets, Fluxys Temp, GRT Gaz, Terranetsbw, Thyssengas, Open Grid
Europe.
Given the fact that we observe an advanced form of convergence between the
Gaspool and NCG-market prices, and given the amount of different TSO’s, we will
present one single result for Germany. In terms of commodity, we will present the
average of Gaspool and NCG-prices. With regards to network costs, we will base the
evaluation on the average of the exit tariffs of 12 TSO’s serving directly connected
industrial clients.
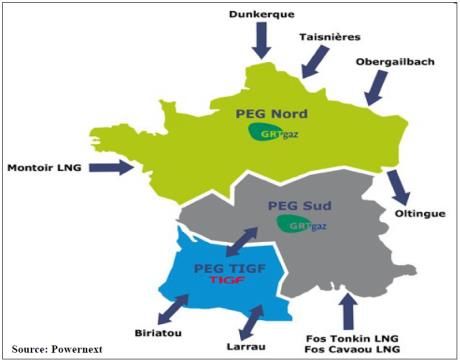
France
France has three different market areas for gas and two different transmission
system operators.
As shown on the map below, the two transmission system operators (TSO) are:
1. GRTGaz, operating respectively in the North of the country and in the
central and South-Eastern regions.
2. TIGF, concentrated on the central and South-Eastern regions.
CREG – A European comparison of electricity and gas prices for large industrial consumers
21 April 2015
[20]Within the GRTGaz network, we find two different gas markets: PEG Nord and PEG Sud. The third (and in traded quantity much smaller) gas market area coincides with the TIGF transmission grid. As we observe substantial differences between the two different transport tariffs and between the commodity prices in the three market areas, we will analyse the French result by presenting three different price zones: GRTGaz/Nord (representing about 75% of gas consumption in France), GRTGaz/Sud (about 20%) and TIGF (about 5%).5 The Netherlands The Netherlands counts one single gas market (TTF), does not impose any regional taxes on gas, and has one Transmission System Operator: Gasunie Transport Services. About 330 industrial clients are directly connected to the gas transmission grid, and we assume profile G1 is part of this group. We will hence, logically, present the Netherlands as one single zone. United Kingdom The United Kingdom will be presented as one single zone for gas in this study (leaving out Northern Ireland). There is one single gas market (NBP: National Balancing Point ), there are no regional taxes, and there is one single gas transmission system operator, National Grid Gas plc. 5 CRE, Marchés de gros: Observatoire des marchés de l’électricité, du gaz et du CO2, 3ième trimestre 2014. CREG – A European comparison of electricity and gas prices for large industrial consumers 21 April 2015 [21]
CREG – A European comparison of electricity and gas prices for large industrial consumers
21 April 2015
[22]
3.6. Summary table on number of zones per
    country

                Country                               Number of zones
                                              Electricity             Gas
             Belgium                               3                   3
            Germany                                4                   1
             France                                1                   3
         The Netherlands                           1                   1
         United Kingdom                            1                   1
              Total                               10                   9

CREG – A European comparison of electricity and gas prices for large industrial consumers
21 April 2015
[23]
3.7. General Assumptions
The general assumptions, applicable to all compared consumer profiles and
countries, are outlined below.
1. October 2014. This study gives an overview of the price levels in October
2014.
2. Economically rational actors. We assume that our four profiles are
economically rational actors who optimise their energy cost where possible.
We assume for instance that British industrial consumers are part of a
Climate Change Agreement: they focus on energy efficiency and emission
reduction, and obtain tax reductions at the same time.
3. Exemptions and reductions. In many cases, we observe the existence of
(often progressive) reductions or exemptions on taxes, levies, certificate
schemes or transport costs. Whenever economic criteria - such as exercising
a well-defined industrial activity, or paying a certain part of your company
revenue as energy cost - are used to determine the eligibility for those
exemptions and reductions, we do not present one single value but a range
of possibilities as result with a minimum and a maximum case.
4. Commodity prices. All market data in terms of commodity was provided by
CREG and – where necessary – completed by PwC based on Bloomberg
market indices.
5. Transportation cost and contractual formulas. Whenever different tariff
options are available for a client, we assume that the client always opts for
the most advantageous formula. Given the predictable consumption profiles
of the cases under investigation, this assumption is, according to PwC, the
most realistic one.
6. Gas pressure level and caloric value. Industrial gas consumers directly
connected to the transport grid are not connected to the same gas pressure
level in every country. We will consider the most plausible pressure level in
every country, given the nature of the gas network and the size of the
considered client profile. We also take into account the caloric value of the
gas in every country.
7. Sales margin (electricity and gas). Based on the input by the CREG, we
count a sales margin of 0,5 €/MWh for electricity, and of 0,4 €/MWh for
natural gas.
8. Exchange rate. For the UK comparison, we have always used the October
2014 average exchange rate to convert from Pound Sterling to Euro (0,7886
GBP/EUR).6 The commodity cost formula was calculated entirely in Pound
Sterling, and the final result converted to Euro at the October 2014 exchange
rate.
9. VAT. Following the terms of reference provided by the CREG, we do not take
into account Value Added Tax (which is tax deductible for industrial clients)
in this study.
10. UK. Wherever this study speaks about the UK, Northern Ireland is not taken
into account.
6 Source: National Bank of Belgium.
CREG – A European comparison of electricity and gas prices for large industrial consumers
21 April 2015
[24]Electricity: Detailed description of the prices, price components and assumptions
4. Electricity: Detailed
description of the prices,
price components and
assumptions
4.1. Belgium
Component 1 - the commodity price
Both base and peak rates in Belgium are calculated on the basis of market prices.
The national indexes used in the calculation of the baseload commodity price and
the peak-load price are the ICE Endex CAL and the Belpex DAM.
The baseload commodity formula applies to profile E3, the peakload commodity
formula applies to profiles E1 and E2.
The formulas used for pricing commodities in this study were provided by the CREG
and are based on an analysis by the Belgian regulator of the electricity supply
contracts of all Belgian consumers with an annual consumption above 10 GWh.

A supplier margin of 0,5€/MWh is added.

Component 2 - the transport costs
Whether connected to the transmission grid at 30-70 kV (Local Transmission
System) or to the transmission network itself, the same transmission tariff structure
applies to all profiles under review in this study. However, in function of the voltage
connection and used capacity, different rates apply.
Transmission costs in Belgium have four components:
     1.   Connection tariffs: in this case, the study only takes into account the charges
          to operate and maintain the user connection;
     2. Grid use : this cost includes (i) the power subscription for the off-take, (ii)
        the additional power for the off-take and (iii) the power put at disposal;
     3. Ancillary services : this cost includes (i) reservation of primary frequency
        control, secondary control of the equilibrium in the Belgian control area,
        tertiary reserve and the black-start-service, (ii) voltage control and reactive
        power, (iii) supplementary deliveries of reactive energy (not taken into

CREG – A European comparison of electricity and gas prices for large industrial consumers
21 April 2015
[26]
account), (iv) congestion management and (v) compensation of losses of
active energy in the grid ;
4. Imbalance tariffs, which are not taken into account in this study given the
overall assumption that the load profiles are totally predictable and stable
for all three consumer profiles under review.
In Belgium, network losses on the federal transport grid (380/220/150 kV)make for
an additional and separate component of transport tariffs. They are billed by the
supplier as a percentage (fixed every year by the TSO) of the commodity cost. Even
though they are not part of the transmission tariff structure as such, we consider
these network losses and their cost as part of component 2 (network costs). In the
UK, a similar system applies (see section 4.5). In Germany, France and the
Netherlands, to the contrary, network losses are covered by the transport tariff
structure itself.
Component 3 - all extra costs
In Belgium, three different kinds of extra costs apply to electricity, detailed below:
1. Tariffs for Public Service Obligations (PSO): six different public
service obligations apply to the profiles under review. The two first are
imposed on Elia as TSO (and hence apply to all profiles under review), the
four other ones are imposed on Elia as LTSO (and hence only apply to profile
E1).
a. Financing of connection of offshore wind power generation units
(0,0629 €/MWh);
b. Financing of federal green certificates (offshore wind) (3,9132 €/MWh)
but discount and cap based on quantity apply;
c. Financing of support measures for renewable energy and cogeneration
in Flanders (0,5171 €/MWh) but discount based on quantity applies
(only E1);
d. Financing measures for the promotion of rational energy use in Flanders
(0,06 €/MWh) (only E1);
e. Financing support measures for renewable energy in Wallonia (13,82
€/MWh) (only E1).
f. Financing regional energy policies in Brussels (0,86€/kVA/month) but
only due up to 5000 kVA/month (only E1).
2. Taxes and levies on the federal and on the regional level. We can identify
four different taxes and levies:
a. Federal contribution (2,4714 €/MWh), increased by 1,1% to pay for
supplier administrative costs, no exemptions but discount and cap
based on quantity apply;
b. Connection fee in Wallonia (0,3 €/MWh);
c. Levy for occupying road network in Brussels (3,25 €/MWh).7
7 For this fee, the regional legislator introduced a cap starting January 1st 2007 (no fee due on
electricity above 25 GWh/year), but the decree to make it applicable has not been issued so
far. As a consequence, this ceiling is not applied in Brussels (source: Ordonnance du 14
décembre 2006 modifiant les ordonnances du 19 juillet 2001 et du 1er avril 2004 relatives à
l'organisation du marché de l'électricité et du gaz en Région de Bruxelles-Capitale et
abrogeant l'ordonnance du 11 juillet 1991 relative au droit à la fourniture minimale
d'électricité et l'ordonnance du 11 mars 1999 établissant des mesures de prévention des
coupures de gaz à usage domestique, article 102).
CREG – A European comparison of electricity and gas prices for large industrial consumers
21 April 2015
[27]d. Levy for occupying public domain in Wallonia (0,34 €/MWh), which
is only applicable to the local transport network (only E1);
3. Certificate schemes and other indirect costs. These are the indirect
costs that are comprised within the electricity price, as a consequence of the
regional quota for green certificates (three regions) and combined
heat/power-certificates (only Flanders). Based upon the information
received from CREG, we estimate the cost of certificates at 85% of the
penalty a supplier has to pay for not meeting the quota. The three regions
have a green certificate system for renewable energies, Flanders also has a
certificate system for combined heat/power.
a. Flanders (green certificates): the fine for non-compliance is 100
EUR/certificate. The quota increases every year. Important progressive
quota reductions apply to all industrial consumers.
b. Flanders (combined heat/power certificates): the fine for non-
compliance is 41 EUR/certificate. The quota increases every year.
Important progressive reductions apply to all industrial consumers.
c. Wallonia: the fine for non-compliance is 100 EUR/certificate. The
quota increases every year, and is at 23,1% of supplied electricity in
2014. Progressive quota reductions apply to large consumers,
reinforced by the new regional decree that entered into force on July 1st
2014.
d. Brussels: the fine for non-compliance is 100 EUR/certificate. The
quota increases every year. No quota reductions for large consumers.
CREG – A European comparison of electricity and gas prices for large industrial consumers
21 April 2015
[28]4.2. Germany
Component 1 - the commodity price
Both base and peak rates in Germany are calculated on the basis of market prices.
The national indexes used in the calculation of the baseload commodity price and
the peak-load price are the EEX Futures and EPEX DAM prices.
The baseload commodity formula applies to profile E3, the peakload commodity
formula applies to profiles E1 and E2.
The formulas used for pricing commodities in this study were provided by the CREG
and are based on an analysis by the Belgian regulator of the electricity supply
contracts of all Belgian consumers with an annual consumption above 10 GWh.
A supplier margin of 0,5€/MWh is added.
Component 2 - the transport costs
The German electricity grid organization is fairly different from the Belgian one. The
four Transmission grid operators only operate the extra-high voltage grid, while
everything else (often, but not always, up to 110 kV) is operated by the distribution
system operators.
Connection voltage (Un) Voltage profile Grid operator
1 kV ≤ Un ≤ 50 kV Medium voltage
DSO
Un = 110 kV High Voltage
220 kV < Un ≤ 350 kV Extra high voltage TSO
For the first profile (E1), we assume the consumer benefits from the medium voltage
tariff on the distribution grid. For the second profile (E2), we assume the consumer
benefits from the high voltage tariff on the distribution grid, while it is extremely
unlikely for such a consumer (which is not a very large industrial consumer) to be
connected to the transmission grid in Germany. Profile E3 is assumed to be directly
connected to the extra high voltage grid, operated by the TSO.
Transmission and distribution tariffs in Germany are integrated and presented as
one single tariff to the consumers on the distribution grid. As stated in the
description of the dataset, we present results for the four transmission zones in
Germany. As Germany counts about 870 distribution system operators 8, the grid
8 From Distribution networks to smart Distribution systems : rethinking the regulation of European
electricity DSO’s, European University Institute, THINK paper topic 12, Final report, 2013, pgs. 12-13.
CREG – A European comparison of electricity and gas prices for large industrial consumers
21 April 2015
[29]cost we present for profiles E1 and E2 is an average of the tariffs of two large DSO’s
in each transmission zone (one rural DSO, one urban DSO).
German integrated grid fees, whether imposed on the distribution or the
transmission grid, follow the same methodology and involve three main
components:
1. Capacity rate;
2. Energy rate;
3. Metering and invoicing cost;
Other fees, such as capacity excess fees are not taken into account in this study given
the assumption that load profiles are completely flat.
When annual consumption exceeds 10 GWh, important network tariff reductions
can apply on large industrial consumers.9 Users with a very abnormal load profile
(case by case) get a reduction of max. 80%. Users who exceed 7000 consumption
hours a year, benefit from reductions as shown in the table below:
Annual Annual Grid fee reduction
consumption consumption
> 10 GWh ≥ 7000 hrs - 80%
> 10 GWh ≥ 7500 hrs - 85%
> 10 GWh ≥ 8000 hrs - 90%
These reductions apply to profile E3, who as a consequence only pays 10% of the grid
fee. As opposed to France, where a similar and recent reduction is paid by the
regulatory account, this reduction is financed by a separate levy (see next part).
Component 3 - all extra costs
Regarding taxes and levies, the German situation is particularly complex, with a host
of progressive reductions, diversified rates and exemptions. As laid out in the
general assumptions, we assume our consumer is an economically rational actor and
aims at obtaining the lowest tax rate. Whenever the application of reductions or
exemptions depends on economic criteria that are not under the full control of the
user (energy cost/turnover, energy cost/gross added value, pension payments, etc.),
we will present a range with all possible options.
In Germany, seven taxes/surcharges can apply on electricity:
1. The Combined heat & power generation surcharge (CHP) is a surcharge
that pays for CHP-plant subsidies. There are three different rates for the
three following consumer groups:
9 Stromnetzentgeltverordnung, §19, abs. 2.
CREG – A European comparison of electricity and gas prices for large industrial consumers
21 April 2015
[30]You can also read