A gendered aquaculture value chain analysis in northwestern Bangladesh
←
→
Page content transcription
If your browser does not render page correctly, please read the page content below
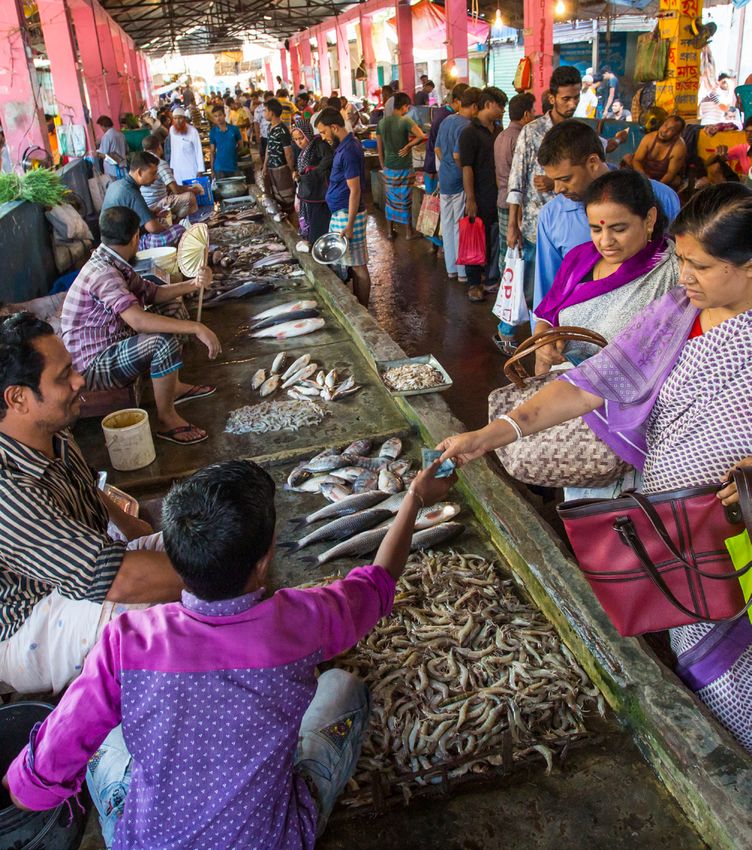
Photo credit: Noor Alam/WorldFish

A gendered aquaculture value chain analysis
in northwestern Bangladesh

                Funded by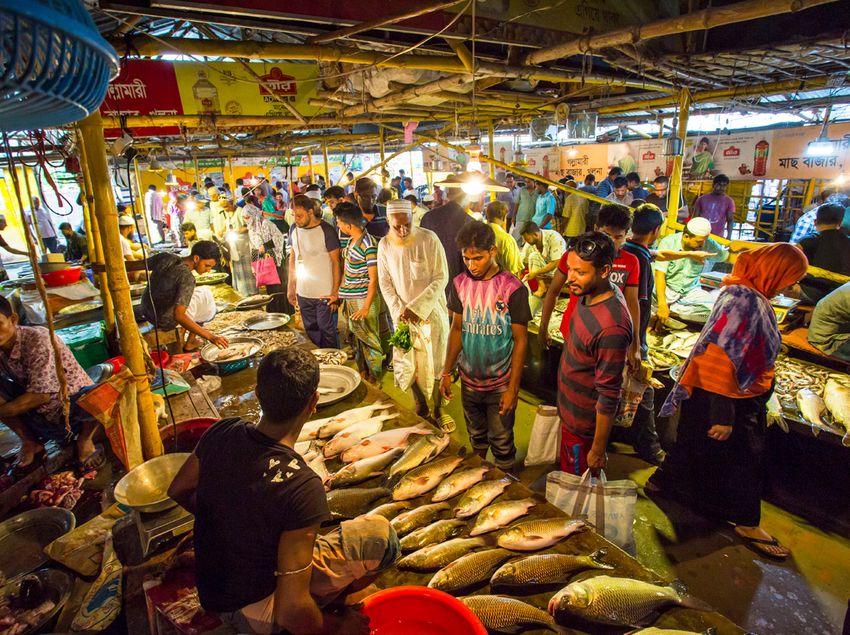
A gendered aquaculture value chain analysis in
northwestern Bangladesh

Authors
Froukje Kruijssen, Rahma Adam, Afrina Choudhury, Katrine Danielsen, Cynthia McDougall, Julie Newton,
Esther Smits and Colin Shelley

Citation
This publication should be cited as: Kruijssen F, Adam R, Choudhury A, Danielsen K, McDougall C,
Newton J, Smits E and Shelley CC. 2021. A gendered aquaculture value chain analysis in northwestern
Bangladesh. Penang, Malaysia: WorldFish. Program Report: 2021-02.

Acknowledgments
This work was undertaken as part of the CGIAR Research Program on Fish Agri-Food Systems (FISH) led by
WorldFish. The program is supported by contributors to the CGIAR Trust Fund.

Funding support for this work was provided by the Bill & Melinda Gates Foundation in the framework of
the Aquaculture: Increasing Income, Diversifying Diets and Empowering Women in Bangladesh and Nigeria
project [INV009865].

The study team would like to thank the women and men of Rajshahi and Rangpur divisions who generously
contributed their insights and time as well as the team from Data Management Aid, who conducted the
fieldwork. The team also acknowledges Khondker Murshed-e-Jahan, Ben Belton and Alvaro Paz Mendez for
their useful comments on an earlier version of this document.

Contact
WorldFish Communications and Marketing Department, Jalan Batu Maung, Batu Maung, 11960 Bayan Lepas,
Penang, Malaysia. Email: worldfishcenter@cgiar.org

Creative Commons License

Content in this publication is licensed under a Creative Commons Attribution-NonCommercial 4.0
International License (CC BY-NC 4.0), which permits non-commercial use, including reproduction,
adaptation and distribution of the publication provided the original work is properly cited.

© 2021 WorldFish.

Photo credits
Front cover, page 10, Noor Alam/WorldFish.

In partnership with

                                                    i
Table of contents
1. Executive summary 1
2. Introduction 3
3. Methodology 4
3.1. Conceptual framework 4
3.2. Study questions 5
3.3. Sampling framework and data collection methods 6
3.4. Data analysis 9
4. Value chain composition 11
4.1. Volumes 11
4.2. Value chain map 11
4.3. Products 13
4.4. Seasonality 14
4.5. Typology of actors 14
4.6. Gender norms and their effects on types of work 22
4.7. Summary of the value chain composition 23
5. Social and economic performance of the value chain 24
5.1. Use of fish 24
5.2. Productivity 24
5.3. Profitability 25
5.4. Employment 30
5.5. Summary of social and economic performance 32
6. Resource and power dynamics that affect performance of the value chain 33
6.1. Access and control regarding key resources 33
6.2. Decision-making at the intrahousehold level 35
6.3. Power relations and structures in the value chain 37
ii6.4. Distribution of benefits from the value chain 37
6.5. Summary of resource and power dynamics 38
7. Value chain upgrading 40
7.1. Introduction to upgrading 40
7.2. Upgrading within function 40
7.3. Upgrading to new value chain functions 46
7.4. Summary of value chain upgrading 48
8. Recommendations 49
8.1. Economic performance 49
8.2. Social and gender performance 49
List of figures 52
List of tables 53
Notes 54
References 55
Annex 1. Input use in fish production 57
Annex 2. Value chain barriers and recommendations 58
iii1. Executive summary
This document presents a value chain study, through an integrated gender lens, of the aquaculture sector
in Rajshahi and Rangpur divisions in northwestern Bangladesh. The study forms a foundational part of the
Aquaculture: Increasing Income, Diversifying Diets and Empowering Women in Bangladesh and Nigeria
(IDEA) project, funded by the Bill & Melinda Gates Foundation and led by WorldFish within the CGIAR
Research Program on Fish Agri-Food Systems (FISH). This project aims to contribute to the transformation
of the sector in the divisions toward greater inclusion and performance, leading to enhanced production,
nutrition and food security, as well as increases in women’s empowerment.
The aim of this value chain study was to generate a knowledge base to inform project interventions as well
as provide broad baseline information regarding chain composition and both social (including gender) and
economic performance. This report provides a functional analysis of the aquaculture value chain, unpacks
social and particularly gender and economic performance of the chain, identifies governance-related
(power) dynamics that influence performance, and synthesizes strategies for upgrading. It brings these
insights together to identify recommendations for the project, both directly within the interventions and
points of influence for the project via partnerships including policy.
The study applied a bespoke conceptual framework (Danielsen et al. forthcoming) that was created to
help address the common pattern of “gender-blindness” in value chain analyses in aquaculture. It also
used a mixed-methods approach to answer research questions related to the composition, functioning,
performance and inclusiveness of the aquaculture value chain in northwestern Bangladesh and the factors
that influence these outcomes.
The findings presented in this report represent a significant contribution and stepwise change in available
sector evidence. The study is the first comprehensive aquaculture value chain analysis in the divisions that
offers a gender-informed look at ways forward toward more inclusive, equitable and high performing chains
in the divisions. Although this study was designed and undertaken prior to COVID-19, its recommendations
are oriented toward and inform the same goals as those for pandemic recovery—building toward more
inclusive, equitable, resilient and nutritious aquaculture value chains.
A wide range of species is produced in the northwest, the majority in carp polyculture and mainly in ponds.
In this report, we distinguish homestead and extensive ponds from commercial ponds based on the
location of the pond, whether backyard or not, and the level of inputs and other resources used. Alongside
fish farmers, a multitude of actors is part of the value chain, including three types of actors specific to
Bangladesh, known as “patilwalahs,” “arotdars” and “farias.” Patilwalahs are seed traders that provide fry and
fingerlings from hatcheries and nurseries to producers, while farias buy and sell fish, and arotdars facilitate
fish auctions. Informal and ambulant retailers, as well as formal retailers that sell from a fixed location, both
sell the fish to consumers. Women and men both engage in paid and unpaid fish production roles, but
women are not recognized by male household members as fish farmers; rather they are seen as supporters.
Men tend to hold decision-making power regarding production. In this study, depending on the pond type,
only between 2% and 5% of the interviewed households considered the woman in the household as main
decision-maker for aquaculture. Downstream in the chain, no women were found as intermediaries and
retailers, or as hired labor for those businesses. However, they do contribute unpaid household labor to their
husband’s business.
1Almost 60% of total production remains in rural areas, through home consumption, gifts to relatives and
neighbors or through rural markets. This emphasizes the major role that aquaculture plays in local food
and nutrition security in Rajshahi and Rangpur. Productivity, revenues and profit margins vary between
production systems. The proximity of the resources identified as most critical to success—seed, feed, market
information, medicine and access to intermediaries—differs across villages, which affects performance
for those more remote. Financial constraints and a lack of good roads and transportation are generally
expressed as constraints to fish farming performance. Women face multiple additional constraints to
engaging and succeeding as fish farmers, because their access and/or decision-making power over ponds
and the fish produced are more limited than men’s. Women also have less access to quality inputs, services
and technical knowledge about aquaculture.
Power relations operate throughout the different levels of the value chain. Arotdars (auctioneers and
intermediaries) have the most powerful influence throughout the chain. They control the prices in
the market as well as supply/demand through credit relationships using “dadon,” a credit system in
which advances are paid (Section 4.5.6). Formal structures and informal structures, such as systems of
bribery, were identified as disadvantaging farmers of all genders from lower socioeconomic groups.
Formal and informal structural gender barriers (policy and gender norms and stereotypes, respectively)
were identified as strongly limiting women’s participation and benefits from the aquaculture value
chain. This is particularly evident in their lower ownership of key resources needed for engaging
in aquaculture—specifically ponds. Women have less decision-making power at all levels. Within
the household, men have more say over shared family resources, such as ponds and finances, and
overuse of benefits, including income and fish for food. Meanwhile, women have less bargaining
power with other market actors, because they are not recognized as farmers. Constraining gender
norms, such as those related to women’s role as homemakers and religious norms about women’s
mobility, are a key driver of the inequitable dynamics, reinforcing limits to women’s engagement
and success. However, there are indications of room for women to maneuver and possibilities for
investments to build on momentum for more equitable engagement, benefits and empowerment.
Finances were identified as a key constraint to upgrading, which limits farmers of all genders besides those
of higher socioeconomic status, while access to quality inputs and training were identified as barriers for all
farmers. Overall, however, men farmers have the networks, access to knowledge and control over resources
that give them better ability to upgrade much more than women farmers. Bringing these together, the
multiple dimensions of gender relations interact to influence gendered differences in the ability to upgrade.
As a result, women produce relatively few fish because they have low decision-making power, access to
resources and mobility. This has repercussions in terms of accessing other resources and benefits. At the
same time, they have low production, resources, status and reliance on what inputs come to them at the
farm gate because of gendered mobility constraints. This means that women are more dependent on actors
that supply poorer quality inputs, which feeds back to negatively affect the quality of their aquaculture
production and therefore their economic performance. Male farmers, including youths, expressed interest
in upgrading along the value chain to become involved in feed, hatchery and aorta businesses.
22. Introduction
This document presents a value chain study with an integrated gender lens of the aquaculture sector in
Rajshahi and Rangpur in northwestern Bangladesh. The study forms part of the contextual knowledge
foundation for the IDEA project, which works in all 16 districts of Rangpur and Rajshahi divisions. Its ultimate
goal is to reach 1 million households for its aquaculture production outcomes and 2 million households for
the nutrition outcomes.
The aim of the value chain study was to generate a knowledge base for designing project interventions.
These focus specifically on inclusive aquaculture value chains that are both more productive and contribute
to poverty reduction, and in which women and youths can be equitably included and benefit in safe and
dignified manners.
This report provides a functional analysis of the aquaculture value chain, including all fish farmed in ponds
in northwestern Bangladesh and marketed in all product forms, both downstream and upstream as well
as vertical and horizontal relationships and power relations. In addition, the report examines constraints
and opportunities to the performance of this chain. It also identifies specific constraints and opportunities
for women’s empowerment and homestead pond and smallholder participation, including women and
youths. Finally, it provides some initial ideas for designing interventions that the project can implement.
The study was designed on the basis of an innovative conceptual framework (Danielsen et al. forthcoming)
that brought together functional and economic analyses of value chains with an often-missing dimension
in value chain analysis: an integrated gender lens that draws on current gender theory. This framework
provided the basis for a shared understanding of key concepts and conceptual building blocks for staff
involved in the project and made the connections between them visible.
This document is structured as follows: After the methodology (Section 3), the report presents a functional
analysis of the value chain, including actors, products and seasonality (Section 4). Next, the report unpacks,
in an integrated way, the social and economic dimensions of the study, highlighting productivity,
profitability and employment (Section 5). Section 6 then describes resource and power dynamics in the
chain and how this affects performance. Section 7 highlights insights about strategies, constraints and
opportunities for diverse actors to upgrade within the chain. Section 8 provides recommendations for the
project and for other value chain actors. The final section presents a short conclusion.
33. Methodology
3.1. Conceptual framework This integrated approach is intended to inform
investments in value chains that go beyond
This study applied a bespoke conceptual sparking upgrading by more powerful,
framework (Danielsen et al. forthcoming) that ready-to-upgrade actors. Rather, this integrated
was created to help address the common pattern approach is intended to both inform upgrading
of “gender-blindness” in value chain analyses in and, more fundamentally, inform transitions
aquaculture (Kruijssen et al. 2018). Specifically, to more inclusive and equitable fish value
the framework aims to enable empirical chains. Figure 1 provides an overview of the
understanding of aquaculture value chains that framework and its key aspects of analysis.
not only “counts” where women and men are, but
rather brings together functional and economic
value chain analysis with gender analysis thinking,
informed by theory and current practice.
Gendered value chain Gendered value chain Gendered value chain Gendered value chain
composition performance governance (power upgrading
dynamics)
• Structural features: • Production and • Economic and social
functions, nodes, activities, transactions (prices, • Decision-making resources that affect
products, locations, types quality, capacity) in whole value economic and social
and numbers of value chain chain, and at node, value chain upgrading
• Financial returns, wages
actors (sex-disaggregated) household and
and other economic • Upgrading strategies
community-levels
• Volumes of product flows benefits of value chain actors
• Economic and social
• Technical features: • Social risks (e.g. terms • Effect of gender
resources that affect
seasonality of production, of engagement and division of labor on
decision-making
production systems, inputs, benefits) upgrading strategies
quality aspects, processing • Social and gender
• Distribution of • Effect of access
characteristics, waste and norms that affect
economic and social to resources on
losses, etc. decision-making
benefits upgrading strategies
and ability to assert
• Governance features: Rules,
• Control over outcomes choice and voice • Effect of power
regulations and policies,
dynamics on
coordination efforts, • Access to and control
upgrading strategies
hierarchies over economic and
social resources • Effect of social and
• Gender division of labor
required to perform gender norms on
• Social and gender analysis upgrading strategies
• Social and gender
of value dimensions of
norms that affect access
products, roles and nodes
to and control over
• Social and gender norms resources and benefits
that affect participation
of value chain actors
in particular tasks and
positions
Gendered constraints and opportunities in the value chain
• Analysis of interplay among factors and dimensions of gender relations in the value chain to explain constraints
and opportunities
• Interventions to overcome barriers and take advantage of opportunities
Source: Danielsen et al. forthcoming.
Figure 1. Gendered value chain analysis framework: key aspects for analysis.
4The conceptual framework identifies four key chain actors “to choose how and when to use
dimensions of gender relations in aquaculture them as input into the value chain or allocate
value chains (Danielsen et al. forthcoming): them to other uses” (Kruijssen et al. 2018, 332).
Following Kabeer (1999), resources include not
1. Gender division of labor: This is an analysis only material resources (such as technology,
of women’s and men’s different productive labor, financial capital, assets and infrastructure)
tasks, roles and positions throughout a given but also human and social resources (such as
value chain, including roles that are unpaid, knowledge, solidarity and social capital).
hidden or otherwise under-recognized
and/or undervalued. 4. Decision-making: This concerns the analysis
of who is involved in which decisions at
2. Social and gender norms: This means different levels in different locations and
investigating the collectively held definitions nodes in the value chain and unpacking
of how women and men should behave the nature of that involvement. It is about
and interact and with what resources (van control over resources as well as about
Eerdewijk et al. 2017). They also frame the power relations in the value chain.
context that women and men participate in
and benefit from aquaculture value chains,
including where men and women can operate 3.2. Study questions
and how (Kruijssen et al. 2018). The questions guiding the value chain analysis are
based in the conceptual framework (Figure 1). The
3. Access to resources and control over
questions are summarized in Table 1. Each question
resources and benefits: This is critical for
is presented again in its respective section of this
successful participation in value chains, because
report as a preface to the section’s key findings.
a lack of access to resources hinders value
Component Key questions
Gendered value What is the composition of the chain in terms of products, nodes, actor tasks and roles?
chain composition How is this divided among different types of people (gender, age, other social markers)?
How is this influenced by social and gender norms?
Gendered value What are the economic and social value chain benefits?
chain performance What factors influence the economic and social performance of the value chain? How are value
chain benefits distributed between men, women and youths? Why and to what effect?
Gendered value How are activities in the value chain coordinated? Who has the decision-making power at
chain governance different levels (household, community, whole chain, market/economy) of the nodes of the
value chains, and why is that so? And how does having decision-making power at a particular
node of the value chain have any effect on value chain performance and actor empowerment?
Gendered value How do different value chain actors (men, women, youths) increase the benefits they derive
chain upgrading from their participation in the aquaculture value chain? What upgrading strategies do different
actors in the value chain use and what are the outcomes of those strategies? Meaning, to what
extent are identified strategies successful? For whom? Why or why not?
Gendered How can economic and social benefits, including empowerment, from value chain
constraints and participation be secured and/or increased for different value chain actors (men, women,
opportunities in youths)? What interventions are needed to overcome barriers and take advantage of
value chain opportunities?
Source: Danielsen et al. forthcoming.
Table 1. Key questions guiding the value chain analysis.
53.3. Sampling framework and data Selection of villages
The farmers were the basis for the linked sampling
collection methods approach. The sample size for the farmer survey
3.3.1. Site selection was determined based on budget availability
and power, so there is sufficient power to detect
Selection of divisions (purposive) a meaningful difference in a given sample size or
The value chain analysis focuses on fish produced to confidently observe an anticipated effect. With
in pond systems in the northwest of Bangladesh. a sample size of 600 observations, it is possible,
The target area of the project consists of two for example, to detect a change in yields of 10%
specific divisions: Rangpur and Rajshahi. While among the survey population with a confidence
other types of aquaculture exist, such as seasonal level of 90%. The sample size for the market actor
cultured water bodies, pen culture and cage survey flowed from this and depended on the
culture, the vast majority of product originates number of markets sold to by sampled farmers.
from ponds (see also Section 4.2). A wide range
of species is produced in these ponds, used for
home consumption and sold in rural and urban 3.3.2. Methods overview
markets inside and outside the two divisions. The The study used primary data combined with some
primary target population for the project is small- secondary data, mainly aquaculture statistics from the
scale aquaculture farmers (men, women, youths) DOF. Collecting primary data involved consecutive
and their households in northwestern Bangladesh. mixed methods. Specifically, it comprised four
For this study, we also include all other value chain methods: a household survey, a market actor survey,
actors and supporters in the fish value chain. key informant interviews (KIIs) and focus group
discussions (FGDs). The data was collected in two
Selection of districts (purposive) stages. The qualitative data (FGDs and KIIs) was
Although the project takes place in all 16 districts collected first followed by the quantitative data (farm
of Rangpur and Rajshahi1 divisions, there were household and market survey). The market survey
constraints in terms of what was feasible for was also conducted in two phases. The first phase
collecting data. We selected the district with the involved following the fish from the farm households
largest volume of aquaculture production based to the markets that farmers sell in and the second
on the Department of Fisheries (DOF) (2018). following the fish from those markets to the ones that
Subsequently, we chose the second district to market actors sell in. KIIs were also conducted during
contrast the first in terms of production level, both market survey phases. The data collection
composition of production (ponds versus seasonal instruments built on tools developed within the
cultured water bodies) and location respective to context of two CGIAR Research Programs: Policies,
the first district selected. Institutions and Markets (PIM) and Livestock and
Fish (L&F). They used a methodology that EuropeAid
Selection of upazilas (random proportional to developed for value chain analysis (VCA4D4) and
population size) used tools for gender-sensitive value chain analysis
Using population data2 at the upazila level in developed by AgriProFocus, Royal Tropical Institute
Bangladesh, upazilas were selected randomly with and the Food and Agriculture Organization. The
probability proportional to population size. This fieldwork protocol, available upon request, describes
implied that more populated upazilas had a higher the tools and data collection processes in more detail.
chance of being selected. For each division, we
randomly selected the upazilas with probability Data to address each of the questions summarized
proportional to the population size to ensure in Table 1 has come from multiple sources
representativeness of the sample. Using the RAND (Table 2). As much as possible, we have indicated
function of Microsoft Excel, we randomized the the source of data in the text. We also used
upazilas and selected ones that represented 60% multiple sources to triangulate the findings.
of the total population of the selected districts.3
6The primary data used for this study was Because of this linked approach, and because
collected by Data Management Aid (DMA) in farmers were selected randomly, we assume
January 2020, just before the global outbreak that the actors in the subsequent stages are also
of COVID-19. The results therefore relate representative of the whole population.
to the situation before the pandemic.
It was clear that a large number of different
Respondent sampling production systems, species, intensity levels and
To gain a (gendered) understanding of the value practices are found among aquaculture farmers in
chain and its constraints and opportunities, we the northwest of Bangladesh, and this we aimed to
aimed to capture a diversity of views while being capture. However, we did not have information on
efficient. We used a two-fold linked approach: the number of farmers of each type. For the survey,
instead of stratifying the sample by farm type,
1. Farm households of different types were we therefore chose to randomly select farmers,
selected and interviewed. assuming that each major type of farmer would
2. We followed the value chain backward appear in the sample. We then classified farmers for
and forward by selecting and interviewing further analysis and to carry out extrapolation for
the input and service providers the the entire chain, based on the relative importance
interviewed farmers purchased from of a particular type of farmer in the sample.
and the actors in markets that those
farmers sold to, following the fish down
the value chain and up to consumers.
Data collection Respondents Purpose: to generate Question it addresses
method information about what
Farm household survey Farm household, main Production practices, Composition,
decision-maker, women costs, sales, profits, labor performance,
use, women’s roles upgrading
Market actor survey Market actors (those Fixed and variable costs, Composition,
who buy and sell fish) labor use, sales, women’s performance,
roles upgrading
Key informant interviews Input suppliers, (seed, Value chain activities, roles, Composition,
feed, ice, other inputs), labor use, constraints and performance,
intermediaries, retailers, opportunities, key trends, governance, upgrading,
stakeholders, consumers consumption behavior constraints and
opportunities
Focus group discussions Farmers (men, women, Livelihoods, production Composition,
youths in separate systems, roles, social and performance,
groups) gender norms, decision- governance, upgrading,
making, power relations, constraints and
value chain mapping and opportunities
youth aspirations
Source: compilation based on Danielsen et al. forthcoming.
Table 2. Overview of data collection methods.
7For the farm survey, 20 households were selected was made to ensure that every type of farmer in a
in each village using a transect technique and particular village was represented. For this study,
a sampling interval based on the number of youths are defined as those men and women in
households in a village. Villages were divided the village between the ages of 15 and 29.
into four zones, conducting five interviews per
zone and skipping households based on the For the market actor survey, a list was
sampling interval. Included households were subsequently generated of both market actors and
those involved in some type of aquaculture at any also markets where respondents sold their fish.
scale. The respondent interviewed was the person For buyers outside of markets, two respondents of
responsible for aquaculture. Neighbors were used each type were selected for every upazila. In the
as replacement households where respondents most mentioned physical markets, at least 10% of
were unavailable after three attempts.5 market actors present were interviewed using a
transect technique applied to market stalls.
The focus groups were held in communities
neighboring those where the survey was Key informants were purposively selected to
conducted to avoid overburdening respondents provide information on specific issues. Information
with multiple data collection efforts. Two sets of from the focus groups was used to identify key
tools were developed for focus groups. These input dealers and service providers (feed, seed,
were conducted with different groups, again to chemicals, health services, credit, etc.), as well as
reduce the burden of long sessions. The groups supporting organizations and their location and/or
were separated into men and women only, but contact info.
they were mixed in terms of types of aquaculture:
homestead, commercial, ponds, other water An overview of the sample size by respondent
bodies, and species. Local leaders provided type and method is presented in Table 3.
support to mobilize participants in the FGDs. Effort
Respondent Farm survey* Market survey Focus groups** Key informant
type interviews***
Men Women Men Women Men Women Men Women
Farm households 543 104 - - 20 groups 20 groups - -
(4 youth (4 youth
groups) groups)
Intermediaries 52 0 - - 43 0
Retailers 127 0 - - 72 1
Consumers - - - - - - 112 61
Input & service - - - - - - 56 0
providers
Other - - - - - - 13 0
stakeholders
* The main respondent was male in 84% of the surveys and female in 16%. Questions on roles carried out by women were, in all cases, answered by
female respondents to ensure accuracy. In 98% of the cases, these women were interviewed alone.
** Each group had 10 participants. In total, there 400 participants in the groups: 200 men (including 40 male youths) and 200 women (including 40
female youths).
*** If women were not explicitly visible to the researchers, attempts were made to reach women during the KIIs by asking farmers and market actors
about existing women in the value chain.
Source: fieldwork protocol, available upon request.
Table 3. Sample size, by actor and data collection method.
83.3.3. Data collection stage, further KIIs were conducted with arotdars,
retailers and consumers from markets that farmers
Secondary data identified during the farmer survey and later from
Secondary data from the DOF in Bangladesh was markets identified by the market actors who
used for the economic analysis, specifically the they further sell to. This led to interviews being
assessment of the total volume of the sector in conducted all across the country, as fish were sold
the two divisions. This data was then combined to different markets all around Bangladesh.
with our own primary data to estimate the total
volumes traded in the region and the number
of jobs in the sector. The extrapolation, done in 3.4. Data analysis
Microsoft Excel, was based on the proportions
of different typologies of producers and market
3.4.1. Overview
actors in our sample. This enabled us to show the The analysis of data consisted of three types using
quantities of fish flowing through different sales the following qualitative and quantitative methods:
channels to each of the actors.
Functional analysis: This provides a general
Survey data mapping and description of the main actors,
Survey data was collected from fish farmers and activities and operations in the value chain. It also
market actors. Firstly, we surveyed a random includes an overview of the products and product
sample of 647 fish farmers in Rajshahi (341) flows, the major production systems, a description
and Rangpur (306) divisions. Households were of the main governance mechanisms in the chain,
interviewed in detail about their production, and a short description of known constraints.
production practices, costs, labor use, sales and The functional analysis formed the basis for the
women’s roles. Afterward, a market survey was analyses in the other components.
conducted among 179 market actors in several
selected markets. These were either intermediaries Economic analysis: First, this consists of a financial
(30%) or retailers (70%). Market actors were analysis of each actor type (financial accounts,
surveyed about their fixed and variable costs, labor return on investment), as well as an assessment
use, sales and women’s roles. of the consolidated value chain (total value of
production, extrapolation for the sector). Second,
Focus groups and key informant data it assesses the inclusiveness of the chain by
A total of 400 people (200 men and 200 women) examining income distribution (business income,
participated in the focus groups, including 80 wages), and employment creation and distribution.
youths (40 male and 40 female). The FDGs were
led by a team of male and female qualitative Social and gender analysis: This explores
researchers and notetakers in four districts whether the aquaculture value chain is inclusive
(Natore, Rajshahi, Gaibanda and Rangpur) and and where different types of actors sit within the
eight upazilas of Rajshahi and Rangpur divisions. value chain. It delves into equity and power issues
The tools used in the FGDs were livelihoods and among these different value chain actors, including
aquaculture production systems, decision-making gender and intersectionality, such as age and
in the value chain, relationship ranking, value chain wealth status. It further looks into equitable access
mapping and youths. These tools are described of inputs, output market, information and services,
in the study protocol, which is available upon decision-making at the household and community
request. All the data was recorded with permission, level, and the social and economic upgrading
then transcribed verbatim and translated. strategies of these actors as they deal with various
opportunities and constraints along the value
The value chain actor and market data collected chain, including social and gender norms.
during the value chain mapping exercise from the
FGDs was then used to follow the different actors In carrying out the analysis, to create holistic
and conduct KIIs with farmer identified inputs and insights useful for systems interventions, these
service actors, NGOs, government, key experts, elements are not addressed discreetly, but rather
producer groups, market actors who buy and sell in an integrated way in the results, analysis and
fish, and also consumers. During the quantitative recommendations of this study.
93.4.2. Qualitative analysis both farmers and retailers were classified into
categories based on their characteristics. For
The data from the FGDs and KIIs was coded and farmers, these characteristics were input use
analyzed through the software N-Vivo 12 using (especially commercial feed) and hired labor.
a coding structure based on the gender value Retailers were classified into two categories based
chain conceptual framework (Danielsen et al on their number of fixed assets and whether they
forthcoming). hired labor. Furthermore, the team combined
data of some variables into summary variables. An
3.4.3. Quantitative analysis example of this concerns combining variables on
Survey data was analyzed in the statistical software specific cost posts into one variable with all costs.
STATA. First, we cleaned the data and removed
the most extreme outlier values—those that Some data manipulation was needed to conduct
exceeded the mean values with more than four an analysis of the annual operating accounts. In
times the value of the standard deviation. Next, the first place, the primary unit of analysis for the
the variables needed for the analysis were created. operating accounts was a year. As some data was
Most data was specified per fish species, but this presented in a different unit (for example, per day,
analysis is species-specific.6 Therefore, data from per week or per month), data was transformed
all species of fish was aggregated. Afterward, where necessary.
Photo credit: Noor Alam/WorldFish
Gollamari fish market in Khulna, Bangladesh.
104. Value chain composition
This section covers the following research a minor extent. Due to the dominance of pond
questions: What is the composition of the chain culture in Rajshahi and Rangpur, our analysis
in terms of products, nodes, and actor tasks and focuses on pond culture as the dominant system.
roles? How is this divided among different types of
people (gender, age, other social markers)? How is 4.2. Value chain map
this influenced by social and gender norms?
The composition of the value chain is presented
in Figure 2. It should be noted that the share of
4.1. Volumes men and women value chain actors is based on
According to national statistics, the total the survey. In the focus groups, we also asked for
aquaculture production in Rangpur and Rajshahi information on specific cases of women in certain
divisions had a volume of about 487,000 t in roles. This means that while we found only one
2017–2018 (Table 4), an increase of almost 16% woman retailer and no women intermediaries, we
from 2015–2016 (DOF 2017). This comprised 20% report on some women in the qualitative results. The
of the country’s aquaculture production in 2017– value chain starts with the hatcheries that produce
2018, which was 1% more than in 2015–2016. The fry and fingerlings. This seed is sold to the four
volume produced in Rajshahi was almost double different types of farmers, either directly or through a
that of Rangpur (330,000 t versus 160,000 t). This is network of nurseries and also seed traders, known as
a direct result of the water surface area allocated to patilwalahs. The volumes shown for each farmer, in
fish production in Rajshahi, which is almost twice the blue boxes, are estimates of the total volume of
that of Rangpur. Together, the two districts have fish produced in aquaculture by this type of farmer
allocated about 136,000 ha to aquaculture. in the two divisions. This is based on the relative
quantities produced by farmers in the sample,
The predominant form of fish cultivation is pond extrapolated to the entire sector in the northwest,
culture. According to official statistics, 93% of using the official statistics on total production
total production was produced in ponds in the (DOF 2018). The share of self-consumption is
2017–2018 period. An additional 6% originated based on the mean value of the respondents in
from seasonally cultured water bodies. Other our farm survey. Other information given in the
production systems, such as shrimp culture, pen figure is the amount of labor provided by men and
culture and cage culture, were only practiced to women. We describe this further in Section 4.4.
Division Ponds Seasonally Shrimp/ Pen culture Cage culture Total
cultured prawn
waterbody culture
Annual production (t)
Rajshahi 307,410 20,995 47 3 472 328,930
Rangpur 147,345 10,275 39 191 133 157,908
Water surface (ha)
Rajshahi 69,440 20,016 14 1 N/A 89,471
Rangpur 36,304 10,461 20 118 N/A 46,903
Source: DOF 2018.
Table 4. Total fish production and water surface in Rajshahi and Rangpur divisions (2017).
11The arrows show which share of total production of actor. Finally, we have classified consumers
is sold to other actors in the chain. For example, based on their location of purchase, either rural or
all homestead producers together produce urban. The assumption is that all fish given away
about 29,000 t annually. Of this production, is consumed by rural consumers. This is further
about 68% is used for home consumption by discussed in Section 5.2.
the producing households, about 21% is given
away to neighbors and relatives, 9% is sold Inputs to farmers include feeds from feed traders
to arotdars and finally 1% is sold to farias. (smaller businesses) or feed dealers (larger
businesses) who source their feeds from feed mills.
The volumes indicated for the subsequent Other inputs include fertilizer to enhance pond
actors in the value chain are based on the flows productivity and chemicals. Fish are generally
of product they receive from farmers and other transported using nonmechanized vehicles or
actors. This is to some degree a simplification, as motorized vehicles. Nonmechanized vehicles are
in some cases there are multiple intermediaries flatbed bicycle rickshaws, which are referred to as
between the farmer and the retailer. The retailers vans. Motorized vehicles include automated vans,
are further classified into two categories: (1) small automobiles like nosimons and CNG automobiles
or traveling retailers and (2) medium and large (four-stroke three wheelers), easy bikes (battery-
retailers. Slightly more than half of what the fish charged rickshaws with more seating capacity),
intermediaries sell goes to small or ambulant trolleys, pickup trucks and larger trucks. The live
retailers (55%) while the remainder goes to fish component of the value chain has specialized
medium and large retailers. The food service trucks to transport fish. These are either open in
sector (hotels and restaurants) is another supplier design or hold fish in large tanks with aeration,
of fish to consumers, in this case served as meals. which is a more controlled system. Ice dealers and
We do not have quantitative data on this type traders support the iced fish value chain.
Hatcheries
Nurseries
Seed traders (patilwalahs)
Homestead pond farmers Extensive pond farmers Improved extensive Commercial pond farmers
pond farmers Feed
29,000 t/yr 87,000 t/yr 203,000 t/yr
Self-consumption 30% 136,000 t/yr Self-consumption 16% • Mills
Self-consumption 68%
Self-consumption 23% • Traders
*PDM: 98% M, 2% F *PDM: 95% M, 5% F *PDM: 98% M, 2% F • Dealers
*PDM: 98% M, 2% F
GDL: 56% M, 44% F GDL: 54% M, 46% F GDL: 63% M, 37% F
GDL: 54% M, 46% F
PW: 94% M, 6% F PW: 85% M, 15% F PW: 98% M, 2% F Other input dealers
PW: 99% M, 1% F
2%
14% 61%
9% 59%
Given away 4%
Ice traders
78%
1% 4%
Given away 21%
Transport services
Intermediaries: farias Intermediaries: arotdars • Regular vans, rikshas, etc.
27,000 t/yr 295,500 t/yr • Specialized transport
for live fish
Given away 7%
PDM: 100% M, 0% F
GDL: 86% M, 14% F
Given away 1%
Small and ambulant retailers Medium and large retailers Food service Financial services
179,000 t/yr 140,000 t/yr (hotels, restaurant) • Chain finance
PDM: 99% M, 1% F PDM: 100% M, 0% F No data from surveys • Microfinance
• Formal finance
GDL: 97% M, 3% F GDL: 98% M, 2% F
Extension services
40% 57%
42%
Rural consumers 60% Urban consumers
152,000 t/yr 187,000 t/yr
*Note: PDM: Primary decision-maker, GDL: Household gender division of labor, PW: Person that does most work, M: Male, F: Female
Source: own data, DOF 2018.
Figure 2. Aquaculture value chain map for northwestern Bangladesh.
12The qualitative data shows that although 4.3. Products
throughout the value chain the majority of
transactions are still cash-based, short- and A wide variety of species is produced and sold
medium-term credit arrangements between in the aquaculture value chain in northwestern
actors are common. Most agreements are informal, Bangladesh. Both men and women prefer
with only some larger transactions, such as local (desi) species of fish. According to KIIs
feed, being subject to formal agreements. Fish with consumers, the top 10 most popular fish
prices depend on species, size, color, freshness among both women and men are, in order,
and product form, whether live or iced. rohu, pangas, tilapia, koi, silver carp, catla,
small fish (various), bata, puti and common
Figure 3 shows the location of the rural and carp. Generally, the species men and women
urban fish markets in northwestern Bangladesh. consumers report buying most frequently are
Although there are many rural fish markets in the the same. The exceptions are puti and other
region, the exact number is unknown. The markets small fish, which only women mentioned.
depicted in the map are the ones where WorldFish
is carrying out the fish market price survey.7
Bhutan
Nepal
Location of rural and urban markets in the IDEA project India
Rangpur
Mymensingh
Rajshahi Sylhet
Bangladesh
Dhaka
Tentulia
Khulna Chattagram
Barishal
Panchagarh Sadar
Patgram Burma
Panchagarh Patgram Bay of Bengal
Atwari
Boda
Dimla
Domar
Debiganj
Baliadangi Bhurungamari
Hatibandha
Thakurgaon Sadar
Jaldhaka
Thakurgaon Nilphamari Kaliganj
Nageshwari
Ranisankail Birganj Nilphamari Sadar Aditmari Phulbari
Kishoreganj Lalmonirhat
Haripur Gangachara
Kurigram
Pirganj
Khansama
Rangpur
Saidpur
Lalmonirhat Sadar
Kurigram Sadar
Bochaganj Kaharole Taraganj Rajarhat
!!
Rangpur Sadar ! Kaunia
Dinajpur Badarganj Pirgachha
Ulipur
Biral Chirirbandar
Parbatipur
RangpurMitha Pukur Raumari
Dinajpur Sadar Chilmari
! Sundarganj
Fulbari
Char Rajibpur
Nawabganj Pirganj
Sadullapur
Birampur
Gaibandha Sadar
!!
Gaibandha
Hakimpur Ghoraghat Palashbari
Fulchhari
Panchbibi
!
Sapahar
Dhamoirhat
Joypurhat Gobindaganj
! Saghatta
Joypurhat Sadar
Kalai
Patnitala
Porsha
Khetlal Shibganj
! Sonatola
Mahadebpur
Badalgachhi
Akkelpur !
Bogra Sadar
Bholahat Naogaon Dhupchanchia Gabtali
Sariakandi
Gomastapur
Kahaloo
!
Niamatpur
! Naogaon Sadar! Adamdighi Bogra
C. Nawabganj
Nachole
!
Manda
Shajahanpur
Dhunat
Raninagar
Shibganj
Nandigram
Kazipur
Sherpur
Tanore
Baghmara
Atrai
Rajshahi
Nawabganj Sadar Mohanpur
Singra Sirajganj Sadar
Godagari
!
Durgapur
! Royganj
Rajshahi Shah Makhdum
Paba
! Natore Sadar Tarash
! Puthia !!
!
Rajpara Boalia Matihar
Natore
Gurudaspur
Sirajganj Kamarkhanda
Ullah Para
Bagati Para
Charghat
! Baraigram
Belkuchi
Bhangura
Chauhali
!!
Chatmohar
Legend Bagha Lalpur
Faridpur Shahjadpur
! Rural market
µ
Atgharia
Ishwardi Santhia
! Urban market Pabna!
!Pabna Sadar
Division boundary Bera
District boundary Sujanagar
Upazila boundary 0 15 30 60
km
Source: WorldFish 2019.
Figure 3. Map of rural and urban fish markets in northwestern Bangladesh.
13Fish buyers generally look for five characteristics of often stock larger, advanced fingerlings (from
fish to determine their worth: size, product form nurseries) of specific species that can be grown
(iced or live), species, color and smell. Overall, to market size within a few months. The seasonal
consumers expressed a strong preference for live ponds in Rangpur and Rajshahi are available from
fish. In addition, interviews show that large fish are April/May to November/December. Tilapia culture
preferred over small fish, especially in cities. They is high in those ponds, as this species can be grown
are also considered tastier than small fish and so to market size relatively quickly.
are sold at a higher price. For those with a limited
budget, smaller, iced fish are preferred because In perennial ponds, fish culture is done throughout
they are more affordable. the year, even if the ponds are small. Farmers
reported two preferred culture periods: (1) March
According to key informants, the vast majority of to February (rohu, catla, mrigal, silver carp, big
fish is still being sold fresh (dead and on ice), but in head, common carp) and (2) July to June (rohu,
recent years live fish supplies have increased, to all catla, mrigal, silver carp, bighead and common
markets. Live fish are perceived to be freshest and carp). The latter was reported mainly in Gurudaspur
fetch higher prices. This trend is a result of reports Upazila of Natore District in Rajshahi Division and
of using of formalin (a classified carcinogen) to Paba Upazila of Rajshahi District. Commercial
preserve fish—a practice that can be damaging to farmers buy fingerlings or advanced fry at low
both human health and the natural environment. prices from September to November for stocking.
Both men and women show a preference for
buying live fish, particularly shing, catfish, koi, Since seasonal weather patterns dictate the grow-
tengra and tilapia. But only men expressed out cycle, there are major peaks in supply just
limitations in accessing this product form. There before the winter, when fish growth slows down,
is a growing demand for the national fish, hilsa, the prevalence and severity of disease increases
which is harvested from rivers. There is also an and seasonal ponds start to dry up. This peak in
increasing number of complaints about the high supply, particularly tilapia, means that overall fish
cost of some fish, such as rohu and catla, and live prices are low during this period. During the rainy
fish in local markets. season, the high supply of open water fish, such as
hilsa, also contributes to low prices of farmed fish
Among consumers, both males (who made during the rainy season. This is not only a result of
up 65% of the total sample) and females (35%) higher supplies of fish in general, but also because
reported recent increases in fish consumption many consumers prefer wild over cultured fish,
in terms of both quantities per meal and the though in practice they may not be able to
frequency of meals with fish. Markets that supply distinguish them. During winter, when supplies are
fish have increased in numbers, and they supply a low, fish prices increase.
wider variety of fish, including some new species.
This is the case both in larger markets as well as 4.5. Typology of actors
small local markets. Some women consumers
reported preferring going to markets that have a This section describes each of the value chain
larger variety and selection of live fish. actors, including input and service providers,
and describes the roles and responsibilities
that men and women have in each of these
4.4. Seasonality functions (Section 3.1). The information in this
Seasonality in fish production stems from variations section is derived from the FGDs and KIIs, unless
in water availability and temperatures. These otherwise indicated.
affect the growth rate of farmed fish, as well as
the availability of wild caught fish. These seasonal 4.5.1. Seed producers and traders
variations result in temporal fluctuations in species
and quantities available, as well as prices and Hatcheries
consumption levels. Some farmers have ponds that Hatcheries produce fish fry from broodstock to
are seasonal, which only contain sufficient water sell to nursery operators and patilwalahs as well
for aquaculture part of the year; others have ponds as directly to farmers of all intensity levels, though
that are perennial. In the seasonal ponds, farmers with increasing quantities and frequency as farm
14intensity levels increase. Together, they produce are usually farmers who also farm fish. In the
20 species of fish, of which 12 are indigenous and survey, no women were reported as owners in
eight imported. These consist of various species any of the seed businesses, nor as employees in
of carp and catfish, together with tilapia, but hatcheries, though experts have indicated they do
they usually specialize in one or a few species. exist. Women are hired as labor in nurseries and
Hatcheries vary in size and sales volumes and farms, but only for digging ponds and removing
also in staff employed (between one and 10 silt and mud.
employees). During the fieldwork, no women
were found to work at a hatchery. Sales are usually 4.5.2. Producers
conducted in cash, using bKash (a mobile financial
service provider) or on short-term credit. Almost all The main role of farmers (or producers), the
of the clients are men. Only 4% or less are women. majority of whom are involved in carp polyculture,
is to produce fish. Farmers produced between
Nurseries five and 13 species of fish, including carps,
Nurseries supply fingerlings to farmers (mainly catfish, barbs and tilapia. The top five most
homestead, extensive and improved extensive) and popular fish farmed were silver carp, rohu, tilapia,
patilwalahs. The nurseries from the two divisions shing and common carp. Farmers mostly sell
produce nine indigenous species and seven that unprocessed fish on ice, but in recent years
are produced from imported (or exotic) species, a new product form of live fish has gained
consisting of various species of carp, catfish and popularity. The fish are sold to intermediaries
barb. Only one female client was mentioned by all (arotdars and farias), retailers, members of
nurseries interviewed. They employ anywhere from harvest teams, and directly to consumers.
one to 12 staff, and all of them are men. Most sales
are cash-based, with some short-term credit (15–20 Based on the data collected, and a classification
days) or bKash. No formal agreements are made based on pond location, inputs and use of hired
with clients in advance. labor, we distinguish four types of producers:
homestead pond farmers, extensive pond
Mobile fingerling and fry traders or patilwalahs farmers, improved extensive pond farmers and
These sell fingerlings and fry to farmers, both commercial pond farmers. From the survey data,
homestead and commercial, by going house to it seems as if these categories do not overlap
house through spot market transactions. They much—meaning those that report having a
trade in seven species of fish that are indigenous homestead pond do not also report having
and eight that are imported, consisting of various another pond elsewhere. However, the FGDs
species of carp, catfish, barb and tilapia. In terms reveal that some farm households might have
of business operation capacities, the scale varies both a homestead and a commercial pond.
significantly, from zero staff to as many as 25
(mainly day laborers), all of whom are men. In Table 5 shows the main characteristics for each
terms of financial operations, the payment options type of producer. Homestead pond farmers
include cash and short-term credit (10–90 days), as operate backyard ponds. The main purpose
well as bKash. Between 4% and 15% of their clients of these ponds is usually to produce food for
are female, particularly widows or women whose the household, but they are often used for
husband is absent. Women farmers, especially, other purposes, such as washing clothes, water
appreciate the role of the patilwalah because they collection, bathing, etc. Homestead ponds are
deliver fingerlings to their homes, which means relatively large (larger than improved extensive
the women do not need to challenge norms ponds and extensive ponds): on average 0.28 ha.
around their mobility. Men value nurseries and Extensive pond farmers operate ponds to sell part
hatcheries because they believe the quality is of their produce, but their production levels are
better and they have more choice. low and they use little hired labor or commercial
feeds. With an average pond surface of just 0.16
Generally, only men operate hatcheries and ha (40 decimals), extensive ponds are the smallest
nurseries and work as patilwalahs. Hatchery pond type. Improved extensive pond farmers
owners are from a higher wealth status, while typically have one or two hired laborers and use
patilwalahs are usually poorer. Nursery operators some commercial feed, up to 1000 kg/ha. Finally,
15commercial pond farmers have a higher use amount of time households use for aquaculture,
of inputs and labor and a larger output. In this both commercial and improved extensive farms
sample, a producer is classified as a commercial use about two full-time equivalent (fte) laborers
farmer if the use of commercial feed per hectare annually, while labor spent on extensive ponds and
exceeds 100 kg/ha and at least three hired laborers homestead ponds is about 1 fte per year. Women’s
are working on the farm. Commercial pond share in total labor days is more or less the same
farmers produce, on average, 748 kg of fish every for homestead, improved extensive and extensive
year on their entire farm. farms, at 45%, and slightly lower for commercial
farms, at 37%, as shown in Figure 4 (right).
Roles and responsibilities
Household labor, defined as labor-input provided From the FGDs, we find that for homestead
by members of the household, is an important production, in terms of family labor, women
source of labor for production and related activities carry out activities such as feeding (most
for all farm types. From the focus groups with men reported), preparing the feed, giving food to
and women farmers, we found marked social and hired workers, liming (only reported in one
gender differences in the type of roles that men, FGD by women), water management, weeding
women and youths played, as well as in terms (men and women reported in one FGD each),
of wealth status in laborer versus farmer. Overall, harvesting for consumption using spears for
women play a more active role on homestead catching fish, controlling predatory species
farms compared to commercial farms. Generally, (women reported in one FGD), pond preparation,
fish farming in homestead ponds relies mostly on silt or sludge removal, and harvesting for sales
family labor, whereas for other ponds more labor (mentioned by women in one FGD). Women are
is hired, usually men. Figure 4 (right) shows the also involved in sorting fish, by size and species.
number of household laborers who provide input
into production, for each of the producer types, Men also perform these roles, with the exception
based on the farm survey data. This shows that of preparing feed for fish and the food for
commercial pond farmers use most family labor: laborers. In addition, men reported a more active
there are on average three household members role in sludge removal, soil management, pond
working on a commercial farm. Homestead pond digging, pond preparation, dike repair, controlling
farmers use the least amount of family labor predatory species, water management, weeding,
(2.3 on average). For all categories, it can be harvesting for sale and consumption, liming,
concluded that it is most common that family fertilization and marketing. The only role that
members working in their aquaculture ponds are women perform more than men is feeding.
older than 30 years of age and that more male Young men (namely sons of the household) were
labor is used than female labor. In terms of the more present than older men in some activities,
Homestead pond Extensive pond Improved Commercial pond
extensive pond
Pond surface (ha) 0.28 0.16 0.22 0.33
(0.26) (0.18) (0.21) (0.28)
Total harvest during 106 319 500 749
the previous 12 (91) (382) (607) (608)
months (kg)
Common species Carp polyculture, Carp polyculture, Carp polyculture, Carp polyculture,
especially with rohu especially with rohu especially with rohu especially with rohu
(86%) and mrigal (90%) (95%) (97%)
(63%)
Note: standard errors in parentheses.
Source: farm survey data.
Table 5. Fish farm characteristics, per producer type.
16You can also read