A harmonised definition of cities and rural areas: the new degree of urbanisation
←
→
Page content transcription
If your browser does not render page correctly, please read the page content below

Working Papers
A series of short papers on regional research
and indicators produced by the Directorate-General
for Regional and Urban Policy

WP 01/2014

                                                     Regional Working Paper 2014

                                                     A harmonised
                                                     definition of
                                                     cities and rural
                                                     areas: the new
                                                     degree of
                                                     urbanisation
                                                     Lewis Dijkstra and Hugo Poelman

                                                     Regional and
                                                     Urban Policy
> Executive Summary
This paper describes the new degree of urbanisation (DEGURBA) classification. This
classification distinguishes three types of areas: densely, intermediate and thinly
populated areas. This new approach was developed to harmonise several similar but
not identical spatial concepts. The new classification is based on a new source of
information: the population grid. This paper shows the benefits of this approach in
terms of greater comparability and data availability. It describes the method and how
it was developed. The annex contains the original and the new guidance notes on the
degree of urbanisation and a section on how to update the degree of urbanisation.
It also contains the United Nations (UN) recommendations on localities and urban/rural
areas and the definitions of urban areas used in Europe in a recent United Nations
Population Division (UNPD) report.

Disclaimer: This Working Paper has been written by Lewis Dijkstra and Hugo Poelman,
European Commission Directorate-General for Regional and Urban Policy (DG REGIO)
and is intended to increase awareness of the technical work being done by the staff
of the Directorate-General, as well as by experts working in association with them, and
to seek comments and suggestions for further analysis. The views expressed are the
authors’ alone and do not necessarily correspond to those of the European Commission.
A H A R M O N I S E D D E F I N I T I O N O F C I T I E S A N D R U R A L A R E A S : T H E N E W D E G R E E O F U R B A N I S AT I O N        1

                                     > Contents
                                     1.		Introduction                                                                                       2
                                     2.		Why a new degree of urbanisation?                                                                  2
                                     3.		What is the new definition? (Short version)                                                        5
                                     4.		What are the benefits?                                                                             7
                                     5.		How does it work? (Definition long version)                                                        7
                                     6.		What are the changes between the old
                                         and the new degree of urbanisation?                                                               11
                                     7.		Conclusion                                                                                        14

                                     Annexes                                                                                               16
                                     1.		Original degree of urbanisation                                                                   16
                                     2.		New degree of urbanisation                                                                        17
                                     3.		How to update the new degree of urbanisation                                                      18
                                     4.		UN principles and recommendations                                                                 21
                                     5.		Definitions used of urban areas in UNPD report (2009)                                             23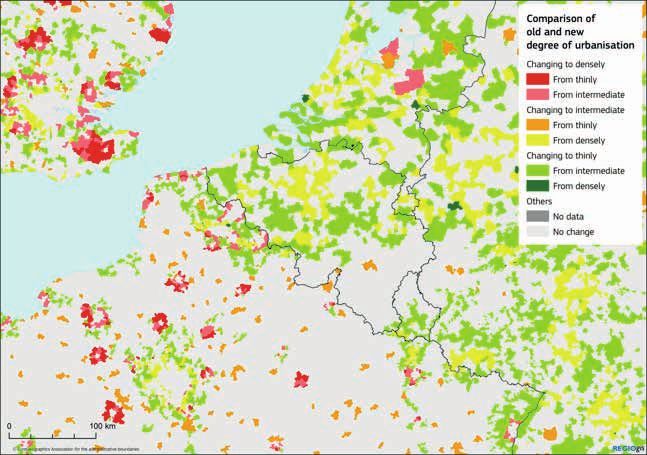
2

    1         INTRODUCTION                                                 2.1	Using a new tool:
                                                                                the population grid
    Urban and rural areas are two central concepts used by a wide          A small but growing number of countries in the EU have created
    range of policymakers, researchers, national administrations and       population grids based on population registers or other detailed
    international organisations such as the Organisation for               sources of where people live (the so-called bottom-up method).
    Economic Cooperation and Development (OECD), the UN and the            This provides much more detailed and accurate information about
    EU. These two terms are readily understood by the general public,      the population distribution within a country and within LAU2s.
    but a clear definition at the international level has remained
    elusive. For example, the UN publishes data on cities, urban areas     To have a population grid that covered all EU countries, including
    and rural areas, but relies almost entirely on national definitions    those which do not have a bottom-up grid, a disaggregation grid
    of these areas. The UN principles and recommendations state            (top-down method) was created for the countries without a bot-
    that due to different characteristics of urban and rural areas         tom-up grid. The top-down method usually disaggregates LAU2
    across the globe, a global definition is not possible. These           population data according to land use or land cover information.
    recommendations also draw attention to the difficulty of finding
    data for these areas.                                                  When this method was first developed, the Joint Research
                                                                           Centre’s (JRC) disaggregation grid for 2006 was used for the
    The new degree of urbanisation provides a solution for this double     countries without a bottom-up population grid.
    problem of data availability and lack of a shared definition. In the
    European Union and the European Free Trade Association (EFTA)          More recently, a grid combining bottom-up and top-down grids
    countries (Iceland, Liechtenstein, Norway and Switzerland), the new    has been published for free download:
    degree of urbanisation provides access to data from a wide range
    of surveys, including the labour force survey and the survey on        http://epp.eurostat.ec.europa.eu/portal/page/portal/gisco_
    income and living conditions.                                          Geographical_information_maps/publications/
                                                                           geostat_population_grid_report
    This new degree of urbanisation also introduces a new harmonised
    city definition, which was developed in close cooperation with the
    OECD. Most international data collections had to rely on national      2.2       Harmonising spatial concepts
    definitions. This new harmonised definition captures large cities in
    a new and comparable way.                                              The revision of the degree of urbanisation also created the oppor-
                                                                           tunity to streamline and harmonise a number of similar but not
                                                                           identical spatial concepts for which data was being collected.

    2
      WHY A NEW DEGREE                                                     2.2.1	Spatial concepts used
                                                                                  by the European Commission
      OF URBANISATION?                                                     Four urban-rural spatial concepts were being used:

    The original degree of urbanisation was introduced in 1991 to          1 rural areas as defined by the OECD methodology;
    indicate the character of the area where the respondent lives.         2	thinly populated area (original degree of urbanisation);
    It distinguished three types of areas: densely populated,              3	densely populated area (original degree of urbanisation);
    intermediate and thinly populated areas. This definition was           4 Urban Audit city.
    based on the population size, density and contiguity of local
    administrative units level 2 (LAU2, see annex 1 for the official       As part of the OECD method to identify predominantly urban,
    names of this level in each country in the original language).         intermediate and predominantly rural regions, all LAU2 with
    As this method is based on LAU2s which vary considerably in            a population density below 150 inhabitants per km2 were clas-
    area size, the results are distorted and reduce the comparability      sified as rural.
    between countries with large LAU2s and small LAU2s.
                                                                           The original degree of urbanisation method used a lower den-
    To ensure that cities in LAU2s with a large area are still above the   sity threshold (100 inhabitants per km2) for thinly populated
    density threshold of the densely populated category, the original      areas but in combination with population size and contiguity.
    degree of urbanisation had to use a relatively low threshold           For example, a single LAU2 with a density above 100 inhabit-
    (500 inhabitants per km2). This low threshold meant that for           ants per km2 but with less than 50 000 inhabitants would still
    countries with large LAU2s, the cities were still identified as        be classified as thinly populated.
    densely populated, but in other countries it meant that too many
    LAU2s were included in the densely populated category.                 Both the OECD method and the original degree of urbanisation
                                                                           led to several large cities (although not always the same ones)
    To avoid this distortion, the method had to find a way of looking      being classified as thinly populated or rural.
    at the population distribution inside LAU2s and using smaller
    units with the same size. The population grid with a resolution        The densely populated areas had to have a density of 500 inhab-
    of 1 km2 solved this problem.                                          itants per km2 and a minimum population of 50 000 inhabitants.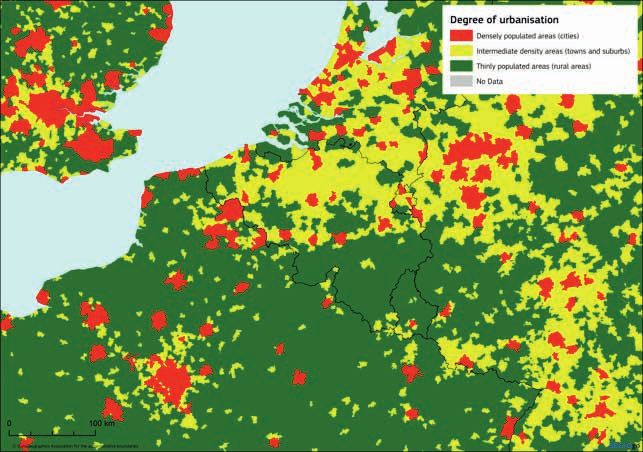
A H A R M O N I S E D D E F I N I T I O N O F C I T I E S A N D R U R A L A R E A S : T H E N E W D E G R E E O F U R B A N I S AT I O N                                                3

This method identified the vast majority of cities, but it also                                                  The UNPD only publishes figures using a two-way split in urban
included LAU2s which were more suburban than urban or                                                            and rural. Therefore, the degree of urbanisation needs to be
included several smaller towns but no single centre of at least                                                  simplified to a two-way split. Urban areas would equal densely
50 000 inhabitants.                                                                                              populated and intermediate density areas. Rural areas would
                                                                                                                 equal thinly populated areas. The alternative names as defined
The Urban Audit covered a large sample of cities with at least                                                   in the new degree of urbanisation anticipate this two-way split.
50 000 inhabitants. These cities were not selected in a harmonised                                               Intermediate or small urban areas and densely populated or
manner. The Urban Audit was not identical to the densely popu-                                                   large urban areas are clearly intended to be combined into
lated areas identified by the original degree of urbanisation.                                                   ‘urban areas’.

Figure 1: Four conflicting spatial concepts                                                                      Despite the variety of definitions used, the population in rural
                                                                                                                 areas in the EU has hovered around 29 % for the past decade.
       Urban-Rural                       Degree of                           Urban Audit
         Typology                      urbanisation                                                              The differences for individual countries, however, are some-
                                                                                                                 times quite substantial.
        Rural LAU2                    Thinly populated
                                        Intermediate                                                             Figure 3: Harmonising with UNPD data
                                           density
                                     Densely populated                              Cities                               UNPD reports               Degree of urbanisation
                                                                                                                                                  Name            Alternative name
                                                                                                                            rural areas     Thinly populated         Rural areas
In 2010, the European Commission published a new definition
                                                                                                                           Urban Areas     Intermediate density   Town and Suburbs
of urban and rural regions, which was similar in approach to the
                                                                                                                                            Densely populated          Cities
OECD method but relied on population grids instead of LAU2s
(for more information see Eurostat Regional Yearbook 2010).
This definition introduced the concept of rural grid cells. They
are used to define rural regions and rural LAU2s. This ensures                                                   2.2.3	Urban Morphological Zones,
that rural areas and rural regions are defined based on the                                                             Urban Clusters and Centres
same concept (rural grid cells). It also meant that rural areas
and thinly populated areas were now identical (1).                                                               A last spatial concept which could be harmonised is the urban mor-
                                                                                                                 phological zone (UMZ) as used by the European Environmental
The new degree of urbanisation uses urban centres to identify                                                    Agency (2). It is defined as ‘a set of urban areas laying less than
all cities with a centre with at least 50 000 inhabitants. All these                                             200m apart’. This concept only looks at a number of CORINE (3)
cities were subsequently included in the Urban Audit and Urban                                                   land cover classes and does not consider population distribution.
Audit cities without a centre of this size were dropped. As
a result, densely populated areas are now identical to the cities                                                Core Classes:
used in the Urban Audit data collections.
                                                                                                                 •    111 – Continuous urban fabric
Figure 2: Harmonised spatial concepts                                                                            •    112 – Discontinuous urban fabric
                                                                                                                 •    121 – Industrial or commercial units
                           Revised degree of urbanisation
                                                                                                                 •    141 – Green urban areas
                            Thinly populated = Rural LAU2
                                 Intermediate density
                                                                                                                 Enlarged core classes: 123 (Port areas), 124 (Airports) and 142
                              Densely populated = Cities                                                         (Sport and leisure facilities), are also included in the UMZ if they
                                                                                                                 are neighbours to the core classes or if they are next to another
                                                                                                                 enlarged core class which is a neighbour to the core classes.
2.2.2	UNPD publications on urban
       and rural areas                                                                                           122 (Road and rail networks) and 511 (Water courses), when
                                                                                                                 neighbours to the enlarged core classes, cut by 300m buffer.
The new degree of urbanisation can also be used to supply data
to the UN on urban and rural areas. In this case, the degree of                                                  Forests and scrub (311, 312, 313, 322, 323, 324), when they
urbanisation does not replace another EU-wide definition, but                                                    are completely within the core classes.
a myriad of different national definitions. For an example of the
variety of definitions of urban areas used in UNPD reports see                                                   The UMZs are constructed using a higher resolution (100 m x 100 m)
annex 5.                                                                                                         data as compared to the 1 km2 grid. However, the presence of strip

1     For more information on the link between the degree of urbanisation and the urban-rural regional typology follow this link: http://epp.eurostat.ec.europa.eu/
      statistics_explained/index.php/Territorial_typologies
2     http://www.eea.europa.eu/data-and-maps/data/urban-morphological-zones-2006-umz2006-f3v0
3     CORINE stands for 'coordination of information on the environment' see http://www.eea.europa.eu/publications/COR0-landcover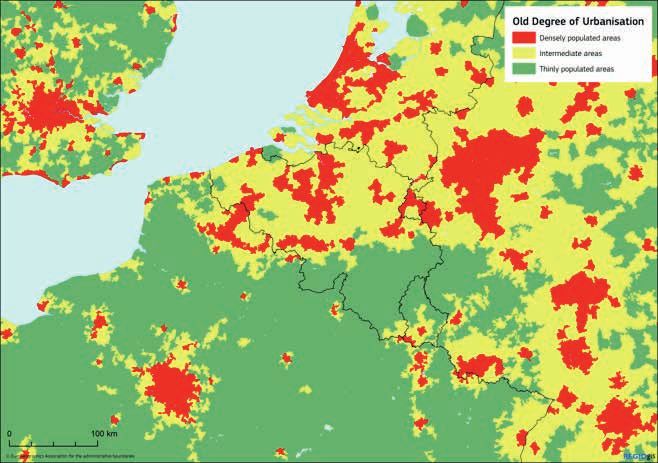
4
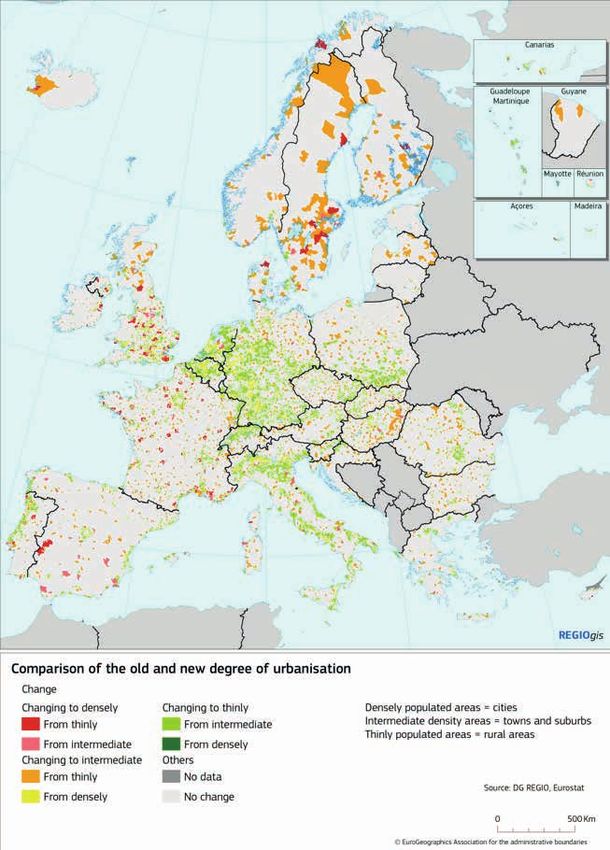
Map 1: New degree of urbanisation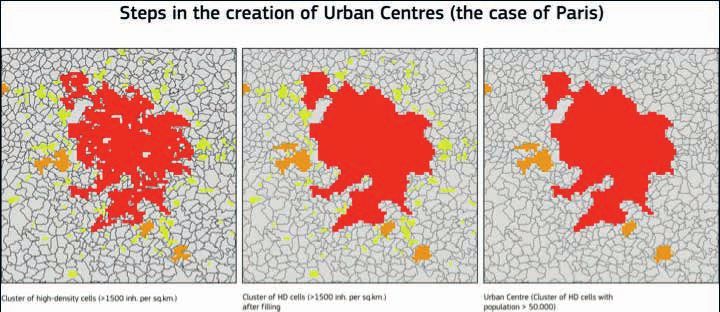
A H A R M O N I S E D D E F I N I T I O N O F C I T I E S A N D R U R A L A R E A S : T H E N E W D E G R E E O F U R B A N I S AT I O N                                                5

or linear development along certain roads leads to UMZs with the                                                 3	WHAT IS THE
                                                                                                                    NEW DEFINITION?
shape of a spider web linking separate urban centres with very few
economic links.

Although the UMZ concept is clear to experts, the general public
may be confused by the references to urban areas and urban
                                                                                                                    (SHORT VERSION)
functions. The UMZ method does not check for population den-
sities or population size as the other urban area definitions do.                                                The new degree of urbanisation creates a three-way classification
Although the UMZ talks of urban areas, it primarily refers to                                                    of LAU2s as follows:
'built-up areas'. Also the references to urban functions should
not be interpreted as referring to a functional urban area or                                                    1	Densely populated area: (alternative name: cities)
a functional economic area. The UMZ method does not analyse                                                         •	At least 50 % living in high-density clusters (4) (alternative
functional economic links or commuting flows.                                                                          name: urban centre).

As the UMZs are not used to collected data, but only to aggregate                                                2	Intermediate density area (alternative name: towns and
existing information, replacing the UMZs with urban centres does                                                    suburbs)
not increase data availability. The main benefit of using urban                                                     •	Less than 50 % of the population living in rural grid cells;
centres instead of UMZs would be the closer link with data col-                                                        and
lected following the degree of urbanisation.                                                                        • Less than 50 % living in a high-density cluster.

                                                                                                                 3	Thinly populated area (alternative name: rural area)
                                                                                                                    •	More than 50 % of the population living in rural
                                                                                                                       grid cells.

Map 2: Urban morphological zones, Urban clusters and Urban centres

4     To ensure that the population of each high-density cluster is appropriately represented (min. 75 %) by densely populated LAU2s, 25 LAU2s were added to this
      category. This also ensures that 20 high-density clusters are included, which otherwise would be dropped.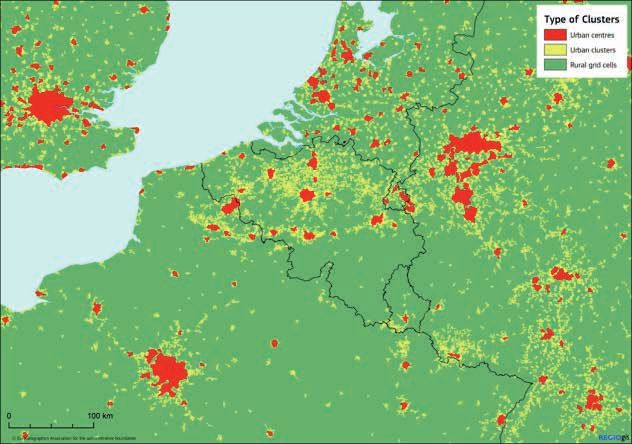
6
The set of two images below gives an example of Cork in Ireland. 3.2 Adjustments and validation by
national statistical institutes
Figure 4: Cork, Ireland: Type of cluster
and degree of urbanisation The application of this methodology was sent to the national sta-
tistical institutes (NSI) for adjustments and validation. The NSIs
could make two types of adjustments: adjusting city boundaries
and adjusting LAU2 classifications.
3.2.1 Adjusting city boundaries
The guidance note highlights that due to the variation of the area
size of LAU2s, the match between the high-density cluster and
the densely populated LAU2s could be adjusted within certain
constraints. In this context, several NSIs have requested changes
to the densely populated areas to ensure a better match between
the appropriate political level and/or a level for which annual data
is collected.
3.2.2 Other adjustments
Due to the sources of the population grid and the fairly coarse res-
olution of the population grid, the classification of a limited number
of LAU2s may not correspond to this approach. As a result, Na-
tional Statistical Institutes (NSI) were invited to critically review this
classification and to make, where necessary, adjustments to the
classification.
3.3 Updates
The current classification has been based on population data for
2006 and the LAU2 boundaries of 2011. There are two types of
updates that will be needed: updates because the LAU2 bounda-
ries have changed; and updates because the population distribu-
tion has changed.
3.1 Definitions 3.3.1 Annual updates due to changes
in the LAU2 boundary
• High-density cluster (or urban centre):
Contiguous (5) grid cells of 1 km2 with a density of at least 1 500 in The first changes will have to be made annually and can be imple-
habitants per km2 and a minimum population of 50 000. mented in two ways: applying the methodology as described here
to the new layer of LAU2s; or estimating the degree of urbani
• Urban clusters: sation based on the changes. The first approach is more labour
Clusters of contiguous (6) grid cells of 1 km2 with a density of at intensive.
least 300 inhabitants per km2 and a minimum population of 5 000.
The second approach is particularly suitable if the changes are
• Rural grid cells: minor or consist mainly of mergers. In such cases, the degree of
Grid cells outside urban clusters. urbanisation of the new LAU2s could be based on the codes of
the previous ones. For example, a merge of LAU2s with the same
• Density: degree of urbanisation would still have the same degree. Merging
Population divided by land area. two LAU2s with different degrees of urbanisation could be
resolved by given precedence to the highest degree of urbanisa-
tion: densely + intermediate = densely; or intermediate + thinly =
intermediate. Taking into account the relative population size of
these two LAU2s could further refine the process.
5 Contiguity does not include the diagonal (i.e. cells with only the corners touching) and gaps in the cluster are filled (i.e. cells surrounded by a majority
of high-density cells applied iteratively). For more detail see section 4.5.
6 Contiguity includes the diagonal. For more detail see section 4.5.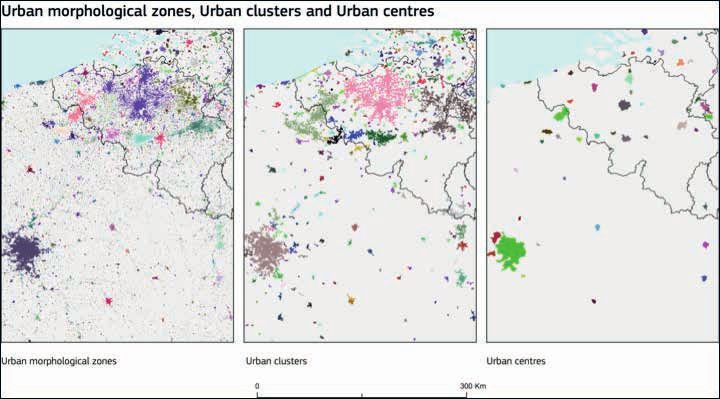
A H A R M O N I S E D D E F I N I T I O N O F C I T I E S A N D R U R A L A R E A S : T H E N E W D E G R E E O F U R B A N I S AT I O N                                              7

3.3.2	Updates due to changes in the                                                                             unemployment rates in Urban Audit cities within a country was
       distribution of population                                                                                not necessarily the same as the unemployment rate in densely
                                                                                                                 populated areas in that country based on the Labour Force
As this classification is expected to be relatively stable, there is no                                          Survey (LFS). Therefore, the Urban Audit had to estimate unem-
need to update it annually. In addition, an update can only be done                                              ployment rates based on sources other than the LFS. Now the
based on a 1 km2 population grid, which not all countries have or                                                unemployment rate of the densely populated area will be iden-
update annually. For the disaggregation grid, updated land cover                                                 tical to the unemployment rate of the Urban Audit cities.
data and census tract or LAU2 population data is needed. This is                                                 In countries with only one Urban Audit city, such as Luxembourg
typically only available every five years. As a result, this classifica-                                         and Malta, LFS will provide a direct estimate of the unemploy-
tion will only be updated to reflect changes in the population distri-                                           ment rate of the city, sample size permitting.
bution every five years.

The next update will be for the population of the reference year                                                 4.3              Linked to regional classification
2011, which should be available in 2015, allowing the modifi-
cation to be used to start in January 2016.                                                                      In 2010, a new urban-rural regional typology was published in
                                                                                                                 the Eurostat regional yearbook (7) to be used by all Commission
                                                                                                                 services. This typology was derived from the OECD method. The

4	WHAT ARE THE
                                                                                                                 OECD method defines rural regions based on the share of popu-
                                                                                                                 lation in rural LAU2s defined by population density, while the

   BENEFITS?
                                                                                                                 new method is based on grid cells of 1 km2. As the grid cells are
                                                                                                                 identical in size, this new method eliminates the distortions of
                                                                                                                 using LAU2s that vary in size.

The new degree of urbanisation offers several benefits. It improves

                                                                                                                 5	HOW DOES IT
the comparability and increases data availability. Lastly, the degree
of urbanisation is also linked to two regional classifications, which

                                                                                                                    WORK? (DEFINITION
increases the coherence of spatial analysis.

4.1             Better comparability                                                                                LONG VERSION)
The problem with the original degree of urbanisation is that it
relied on the population size of LAU2s as one of the main criteria.                                              This section describes the methodology in full detail. This meth-
If a LAU2 was large enough, even the presence of a large city                                                    odology has been jointly developed by the Directorate-General
would lead to it being classified as thinly populated. For example,                                              for Agriculture and Rural Development and the Directorate-
the original degree of urbanisation classified the LAU2 of                                                       General for Regional and Urban Policy with support of the Joint
Uppsala (SE), Aalborg (DK) and Badajoz (ES) as thinly populated                                                  Research Centre and Eurostat.
despite the presence of cities with more than 100 000 inhabit-
ants. As a result, the degree of urbanisation of countries with
large LAU2s underestimated the population in cities compared to                                                  5.1              Population grid
countries with small LAU2s.
                                                                                                                 This new classification is based on a 1 km² population grid.
This new approach also uses the criterion of population density                                                  A grid based on geo-coding address locations and population
but applied to units of analysis of the same size: 1 km2 grid cells.                                             register data is available for Croatia, Denmark, Sweden, Finland,
As a result, it can look inside the large LAU2s and detect the pres-                                             Austria, the Netherlands, Slovenia, Switzerland and Norway and
ence of towns or cities within a LAU2. Therefore, the results are                                                the classification is based on the 'bottom-up' grids in these
less distorted and more comparable between countries.                                                            Member States.

                                                                                                                 For the remaining countries, the classification relies on the pop-
4.2             More data                                                                                        ulation disaggregation grid created by the JRC based on LAU2
                                                                                                                 population and CORINE land cover (8). The disaggregation grid
Instead of having separate data collections for the different spa-                                               has a resolution of 100 m x 100 m, but has been aggregated to
tial concepts, the harmonisation of spatial concepts ensures that                                                a cell size of 1 km2 for this analysis.
more data is available for the new degree of urbanisation.
                                                                                                                 Because the CORINE land cover map does not cover the four
For example, in the past the Urban Audit cities did not equal the                                                French overseas regions, Madeira and Açores in Portugal, the
densely populated areas. As a result, the weighted average of                                                    population disaggregation grid does not cover these regions.

7     http://epp.eurostat.ec.europa.eu/statistics_explained/index.php/Urban-rural_typology
8     A provisional version, disaggregating the LAU2 population of 2006 has been used. More information about the disaggregation method can be found at:
      http://www.eea.europa.eu/data-and-maps/data/population-density-disaggregated-with-corine-land-cover-2000-2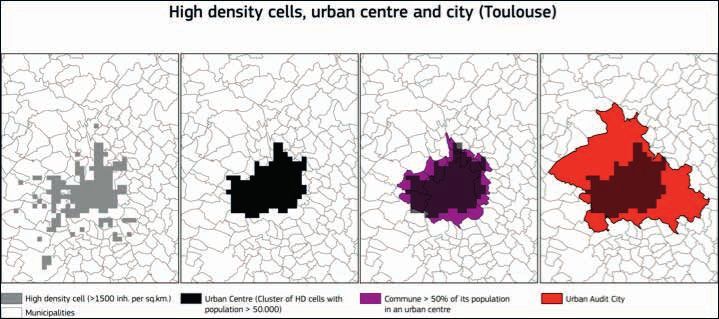
8

                                                                                                 Population in group                              Urban Cluster
    Therefore, the classification for these regions has been done
    based on other sources (LandScan (9) data) which DG for Regional                                             Population
                                                                                                                   3050
    and Urban Policy has acquired.

    5.2	Rural grid cells and urban clusters                                                  Population
                                                                                                6000

    A rural LAU2 has 50 % of its population living in rural grid cells.
                                                                                           The resulting raster of urban clusters is available here:
    • Rural grid cells:                                                                    https://circabc.europa.eu/sd/a/a932d937-82fe-48b6-9c14-
    Grid cells outside urban clusters.                                                     1d549ac494f3/URB_CLST_2006.zip

    • Urban clusters:                                                                      The urban clusters can be overlaid on LAU2s, which allows us to
    Clusters of contiguous (10) grid cells of 1 km2 with a density of                      calculate the share of population of each LAU2 living in an urban
    at least 300 inhabitants per km2 and a minimum population                              cluster. If less than 50 % live in an urban cluster, the LAU2 is clas-
    of 5 000.                                                                              sified as rural.

    The calculation is done in two steps:
    First, all cells with a population density of 300 inhabitants per                      5.3
                                                                                               High-density clusters (city centres)
    km2 are selected. Secondly contiguous cells are plotted (see fig-
    ure below):                                                                            To make a distinction between densely (large urban) and inter-
                             Contiguous groups                                             mediate (small urban) we classify as densely those LAU2s where
                                                                                           50 % or more of the population lives in a high-density cluster.
        400             550     2100                G1                G2       G2
                                                                                           • High-density cluster:
        500                      400                G1                         G2
                                                                                           Contiguous (11) grid cells of 1 km2 with a density of at least 1 500 in-
        1500    350                                 G1       G1                            habitants per km2 and a minimum population of 50 000.
        2000 1250                                   G1       G1
                                                                                           The raster of high-density clusters is available here:
                                                                                           https://circabc.europa.eu/sd/a/d4ded292-c66b-4927-ae8e-
    The groups of contiguous cells with a density above the thresh-                        2c6f2b606b46/HDENS_CLST_2006.zip
    old with a total population of 5 000 or more are selected. These
    are urban clusters.                                                                    The method to identify high-density clusters is similar to the
                                                                                           method of the urban clusters. First, all cells with a population
                                                                                           density of more than 1 500 inhabitants per km2 are selected.
                                                                                           Secondly, contiguous high-density cells are grouped. In contrast

    Map 3: Step in the creation of Urban Centres (the case of Paris)

    9     http://www.ornl.gov/sci/landscan
    10 Contiguity includes the diagonal.
    11 Contiguity does not include the diagonal (i.e. cells with only the corners touching) and gaps in the cluster are filled (i.e. cells surrounded by a majority
       of high-density cells applied iteratively).
A H A R M O N I S E D D E F I N I T I O N O F C I T I E S A N D R U R A L A R E A S : T H E N E W D E G R E E O F U R B A N I S AT I O N 9
to the urban clusters, diagonal contiguity is not included. The 5.5.1 LAU2 without a raster equivalent
last steps fill gaps and smooth sharp borders (see figure
below). This is done by applying the majority rule iteratively. Some small LAU2s do not have a raster equivalent. These have
This means that if five or more of the cells surrounding a cell been classified according to the share of area in rural grid cells
belong to a single high-density cluster, it is added to that high- and high-density clusters.
density cluster. This is repeated until no more cells are added.
The high-density clusters can be overlaid with LAU2s, which 5.5.2 Border effects
allows us to calculate the share of the population of each LAU2
living in a high-density cluster. If more than 50 % live in a high- Thinly populated LAU2s classified as intermediate density or
density cluster, the LAU2 is classified as densely populated. densely populated may be classified incorrectly if rural grid
cells cover most of the territory. The LAU2s with a population
As a last step, a number of LAU2s are included in the densely below 5 000 inhabitants and with 90 % or more of its area in
populated class to ensure that all high-density clusters have at rural grid cells were reclassified as thinly populated.
least 75 % of their population in this class.
Small LAU2s classified as ‘rural areas’ may be classified incor-
rectly due to the coarse resolution of the population grid com-
5.4 Three contiguity rules pared to the small size of the LAU2s. LAU2s with an area less
than 5 km² but with a share of surface outside rural grid cells
This section illustrates the three contiguity rules mentioned higher than 30 % were reclassified as intermediate density or
above: densely populated according to the share of the corresponding
cluster.
1 Contiguous including diagonals (urban clusters)
If the central square in Figure 1 is above the density thresh-
old, it will be grouped with each of the other surrounding 5.5.3 LAU2 with no population
eight cells that exceed the density threshold. in the raster equivalent
2 Contiguous excluding diagonals (high-density clusters) A few LAU2s do not have a population in their raster equivalent,
If the central square in Figure 1 is above the density thresh- although according to the census they do have a density higher
old, it will be grouped with each of the four cells directly than 150 inh./km². These have been classified according to the
above, below or next to the central square that exceed the surrounding LAU2s and the census data.
density threshold. This means that cell numbers 2, 4, 5 and 7
can be included. Cell numbers 1, 3, 6 and 8 cannot as they
have a diagonal connection. 5.5.4 LAU2s outside the current
population grid
3 The majority rule (gap filling in high-density clusters)
The goal for the high-density clusters was to identify urban The CORINE land cover map does not cover the four French
centres without any gaps. Therefore enclaves needed to be overseas regions, the Azores and Madeira of Portugal. DG
filled. If the central square in Figure 1 is not part of a high- Regional and Urban Policy has acquired the LandScan popula-
density cluster, it will be added to a high-density cluster if tion grid for these regions and used that grid to classify the
five or more of the eight surrounding cells belong to a single LAU2s of these regions.
high-density cluster. This rule is applied iteratively until no
more cells can be added.
5.6 Adjusting the cities
5.5 Completing and correcting The definition of the degree of urbanisation specifies that:
the classifications
As LAU2s vary considerably in area, this methodology will lead
To classify LAU2s based on a population grid, the LAU2s have to a closer match between a high-density cluster and densely
to be transformed into a raster as well, which can lead to some populated LAU2s in countries with small LAU2s than in those
situations which require an ad-hoc solution. with large LAU2s. To take this difference into account, the clas-
sification can be adjusted as following:
Contiguous grid cells
• A densely populated LAU2 can be classified intermediate as long
1 2 3 as 75 % of its high-density cluster population remains in densely
4 5 populated LAU2s.
6 7 8 • A thinly populated or intermediate density LAU2 can be classi-
fied as densely populated if it belongs to a group of LAU2s
with a political function and if the majority of the population of
this group of LAU2s lives in a high-density cluster.10
An example of the application of the first rule is Vienna.
Map 4: High density cells, urban centre and city (Wien)
An example of the second rule is Toulouse.
Map 5: High density cell, urban centre and city (Toulouse)
These modifications were made based on requests from the Due to these two sources of possible distortion, national statis-
national statistical institutes and verified by the European tical institutes were asked to verify and validate the classifica-
Commission. tion. NSIs could propose additional cities with an urban centre
with at least 50 000 inhabitants. These were verified by the
Commission to ensure that they indeed had such an urban cen-
5.7 Other adjustments tre, for example by examining the population size of the high-
density clusters below 50 000 within the city boundaries or
This method can be distorted by two elements: the type of grid analysing the data produced using a more precise national pop-
used; and the geography of the area. ulation grid. For example, the city of Trondheim did not have
a centre of 50 000 inhabitants according to this methodology,
In countries where no bottom-up grid was available, the method but this is likely to be due to the geography of the city.
may be less accurate due to the resolution of the data (mainly
CORINE land cover and LAU2 population) used in the population In some cases, NSIs have asked to exclude a city. Some of the
disaggregation grid. More information about the disaggregation reasons to exclude a city were that it lacked functions of a centre,
method can be found at: http://www.eea.europa.eu/data-and-maps/ it had a negative commuter balance or the population of its
data/population-density-disaggregated-with-corine-land- urban centre was likely to be below 50 000 (today). These
cover-2000-2. Future updates will increasingly rely on bottom-up requests were verified by the Commission and if the estimated
grids and disaggregation using high resolution data. population of the urban centre was close to the threshold and/or
the other reasons were valid, the city was excluded.
The method does not take into account the presence of steep
slopes. As a result, the method may not identify high-density NSIs could also request minor corrections to the thinly popu-
clusters or urban clusters in these types of areas. lated and intermediate categories.A H A R M O N I S E D D E F I N I T I O N O F C I T I E S A N D R U R A L A R E A S : T H E N E W D E G R E E O F U R B A N I S AT I O N 11
6 WHAT ARE THE CHANGES BETWEEN THE OLD
AND THE NEW DEGREES OF URBANISATION?
Overall the change between the old and the new degree of Despite the change in methodology and the use of the population
urbanisation leads to a slightly lower population share in densely grid, there is still a relatively high level of continuity in the clas-
populated areas: a drop from 47 % to 40 %, while the population sification: 73 % of the EU population does not change its degree
share in intermediate density areas increase by 6 percentage of urbanisation (see table). In some countries, the share of popu-
points and in thinly populated areas by 0.4 percentage points. lation shifting between categories is more important. As a result,
(see table). data for the old and new degrees of urbanisation may not be
fully comparable and a break in the series should be flagged.
Change in share of total population in pp
Share of total population in % (new – old)
Densely Intermediate Thinly Densely Intermediate Thinly
populated density populated populated density populated
EU 40 31 29 -7 6 0
Belgium 27 57 17 -28 16 12
Bulgaria 43 23 35 -1 14 -14
Czech Republic 30 33 37 -4 8 -3
Denmark 34 21 45 -1 10 -9
Germany 34 42 24 -14 6 8
Estonia 41 17 43 5 7 -12
Ireland 35 21 44 2 14 -17
Greece 50 24 27 -1 1 0
Spain 33 31 36 7 16 -23
France 38 25 38 -12 12 0
Italy 33 42 25 -11 2 9
Croatia 29 29 42 -3 11 -8
Cyprus 52 22 26 -4 9 -5
Latvia 42 20 38 -2 18 -16
Lithuania 41 5 54 0 4 -4
Luxembourg 18 37 45 -22 -3 25
Hungary 29 35 36 -3 12 -10
Malta 50 43 8 -34 26 8
Netherlands 44 41 15 -19 7 13
Austria 30 29 41 -6 4 2
Poland 35 24 41 -5 7 -2
Portugal 43 30 27 2 -5 2
Romania 33 22 45 -4 8 -4
Slovenia 18 32 50 0 -3 3
Slovakia 21 36 43 -2 10 -8
Finland 45 22 33 1 1 -2
Sweden 38 31 31 14 16 -31
United Kingdom 57 29 13 -8 11 -3
Switzerland 28 49 22 -21 16 5
Iceland 70 15 15 70 -52 -18
Norway 26 34 40 2 13 -1512
Share of total population in the same degree Share of total population changing degree
Densely Intermediate Thinly Changing Changing to Changing
Total Total
populated density populated to densely intermediate to thinly
density
EU 73 37 15 21 27 3 16 7
Belgium 60 27 28 5 40 0 28 12
Bulgaria 79 42 5 32 21 1 17 2
Czech Republic 75 30 17 28 25 0 16 9
Denmark 76 30 6 40 24 4 15 5
Germany 70 34 24 12 30 0 18 12
Estonia 73 33 1 39 27 7 15 4
Ireland 77 30 4 43 23 5 17 1
Greece 76 37 7 33 24 1 18 5
Spain 79 44 13 22 21 6 11 4
France 75 39 10 26 25 6 13 6
Italy 69 31 26 13 31 3 16 11
Croatia 81 29 14 38 19 0 15 4
Cyprus 78 50 7 22 22 3 15 4
Latvia 81 42 1 38 19 0 19 0
Lithuania 94 41 0 53 6 0 5 1
Luxembourg 53 18 15 20 47 0 22 25
Hungary 70 25 14 31 30 4 21 5
Malta 59 50 9 0 41 0 34 8
Netherlands 64 42 20 2 36 2 21 13
Austria 79 30 17 32 21 0 13 9
Poland 78 35 10 33 22 0 15 7
Portugal 70 33 18 20 30 10 12 8
Romania 83 33 10 40 17 0 12 5
Slovenia 78 18 23 37 22 0 9 13
Slovakia 72 19 17 35 28 2 19 8
Finland 70 25 9 36 30 8 22 0
Sweden 56 23 6 28 44 16 26 3
United Kingdom 74 53 11 10 26 5 18 3
Switzerland 62 28 23 12 38 0 27 11
Iceland 15 0 0 15 85 70 15 0
Norway 69 19 12 37 31 6 22 3
Map 6A H A R M O N I S E D D E F I N I T I O N O F C I T I E S A N D R U R A L A R E A S : T H E N E W D E G R E E O F U R B A N I S AT I O N 13 Map 7
14

 7         CONCLUSION                                                 The new degree of urbanisation also uses the same building
                                                                      blocks as the urban-rural regional typology. As a result, the data
                                                                      collected for rural areas is linked to the data collected for rural
 The new degree of urbanisation takes advantage of a new tool,        regions as they are both defined by the share of population in
 the population grid, to create a more accurate classification.       rural grid cells.
 It takes account of the population distribution within and between
 local administrative units level 2.                                  Last but not least, this new degree of urbanisation could also be
                                                                      used to provide the UN with annual data for urban and rural
 In addition, the switch to the new classification allows a further   areas. Until now, annual data for these type of areas was diffi-
 harmonisation of spatial concepts by ensuring that the cities        cult to find and was based on a wide diversity of urban-rural
 and densely populated areas are identical and as well as thinly      classifications which undermined the comparability of the data.
 populated areas and rural areas.

 Map 8 Type of clusters
A H A R M O N I S E D D E F I N I T I O N O F C I T I E S A N D R U R A L A R E A S : T H E N E W D E G R E E O F U R B A N I S AT I O N 15 Map 9 New degree of urbanisation Map 10 Old degree of urbanisation
16

 > ANNEXES

 1	ORIGINAL DEGREE OF URBANISATION
 DEGURBA Col 174: Degree of urbanisation
 Periodicity: QUARTERLY
 Short description: Degree of urbanisation

     Column          Code                 Description                  2006+     2001-2005     1998-2000    1992-1997        1983-1991
      174                            Degree of urbanisation
                       1            Densely-populated area              ✓             ✓            ✓             ✓               x
                       2               Intermediate area                ✓             ✓            ✓             ✓               x
                       3             Thinly-populated area              ✓             ✓            ✓             ✓               x

 Purpose                                                                    Belgium          Gemeenten/Communes
                                                                            Czech Republic   Obce                                6.249
 Variable needed to calculate employment and unemployment
                                                                            Denmark          Kommuner                              271
 rate breakdown by density of population.
                                                                            Germany          Gemeinden                          13.176
 Definitions                                                                Estonia          Vald, Inn                             241
                                                                            Greece           Demotiko diamerisma/Koinotiko       6.130
 The concept of ‘urbanisation’ has been introduced to indicate the                           diamerisma
 character of the area where the respondent lives. Three types of           Spain            Municipios                          8.108
 area have been identified:                                                 France           Communes                           36.678
                                                                            Ireland          DEDs/Wards                          3.440
 1 Densely-populated (Code 1).                                              Italy            Comuni                              8.100
 2 Intermediate (Code 2).
                                                                            Cyprus           Dimoi, koinotites                     614
 3 Thinly-populated (Code 3).
                                                                            Latvia           Pilsētas, novadi, pagasti             530
 In the definition of ‘degree of urbanisation’ there is a criterion         Lithuania        Seniūnijos                            515
 of geographical contiguity together with a population threshold.           Luxembourg       Communes                              118
 Harmonised, comparable correspondence between the degree                   Hungary          Települések                         3.145
 of urbanisation and NUTS 5 regions has been (re-)defined on                Malta            Kunsilli                               68
 the basis of 2001 census data (for Member States and candi-                Netherlands      Gemeenten                             489
 date countries) in 2005.                                                   Austria          Gemeinden                           2.381
                                                                            Poland           Gminy                               2.478
 An ‘area’ consists of a group of contiguous ‘local areas’ where
 a ‘local area’ corresponds to the following entities in the respec-        Portugal         Freguesias                          4.257
 tive countries:                                                            Slovenia         Občine                                193
                                                                            Slovakia         Obce                                2.928
                                                                            Finland          Kunnat/Kommuner                       446
                                                                            Sweden           Kommuner                              290
                                                                            United Kingdom   Wards (or parts thereof)           10.679
                                                                            Bulgaria         Naseleni mesta                      5.340
                                                                            Croatia
                                                                            Romania          Communes, Municipiu, Orajse         2.951
                                                                            Turkey           Köy                                37.675
                                                                            Iceland          Sveitarfélag                          101
                                                                            Norway           Kommuner                              433
                                                                            Switzerland      Gemeinden/Communes/Comuni           2.815
A H A R M O N I S E D D E F I N I T I O N O F C I T I E S A N D R U R A L A R E A S : T H E N E W D E G R E E O F U R B A N I S AT I O N 17
The three types of area described above are defined as follows: Definitions
Code 1: Densely-populated area The concept of ‘urbanisation’ has been introduced to indicate
the character of the area where the respondent lives. Three
This is a contiguous set of local areas, each of which has a den- types of area have been identified and defined using a criterion
sity superior to 500 inhabitants per square kilometre, where the of geographical contiguity in combination with a minimum pop-
total population for the set is at least 50 000 inhabitants. ulation threshold based on population grid square cells of
1 km2. These grid cells all have the same shape and surface,
Code 2: Intermediate area which avoids distortions caused by using units varying in size.
The three types to be distinguished are:
This is a contiguous set of local areas, not belonging to
a densely-populated area, each of which has a density superior • densely-populated (Code 1);
to 100 inhabitants per square kilometre, and either with a total • intermediate (Code 2);
population for the set of at least 50 000 inhabitants or adjacent • thinly-populated (Code 3).
to a densely-populated area.
The degree of urbanisation creates a classification of all LAU2s
Code 3: Thinly-populated area (Local Administrative Units – Level 2) as follows:
This is a contiguous set of local areas belonging neither to Thinly populated area (alternative name: rural area):
a densely-populated nor to an intermediate area. • More than 50 % of the population lives in rural grid cells.
A set of local areas totalling less than 100 km2, not reaching Intermediate density area (alternative name: towns and sub-
the required density, but entirely enclosed within a densely-pop- urbs/small urban area):
ulated or intermediate area, is to be considered to form part of • Less than 50 % of the population lives in rural grid cells; and
that area. If it is enclosed within a densely-populated area and • Less than 50 % lives in high-density clusters.
an intermediate area it is considered to form part of the inter-
mediate area. Densely populated area: (alternative names: cities/large urban area):
• At least 50 % lives in high-density clusters (12).
2 NEW DEGREE OF
In the above, the following definitions are used:
URBANISATION
• Rural grid cells:
Grid cells outside urban clusters.
• Urban clusters:
DEGURBA – Col 168 Clusters of contiguous (13) grid cells of 1 km2 with a density of
Periodicity: QUARTERLY at least 300 inhabitants per km2 and a minimum population
Short description: Degree of urbanisation of 5 000.
Codes • High-density cluster:
1 Densely-populated area Contiguous (14) grid cells of 1 km2 with a density of at least
2 Intermediate area 1 500 inhabitants per km2 and a minimum population of
50 000 (alternative names: urban centre or city centre).
3 Thinly-populated area
In order to properly classify LAU2s based on the grid cell approach
Purpose described, a few additional correction rules must be provided:
Variable needed to calculate employment and unemployment • If the LAU2s do not have a raster equivalent, they are classi-
rate and main population characteristics separately for urban fied according to the share of territory in rural grid cells and
and rural areas. high-density clusters.
12 Furthermore, each high-density cluster should have at least 75 % of its population in densely populated LAU2s. This also ensures that all high-density
clusters are part of at least one densely populated LAU2, even when this cluster represents less than 50 % of the population of the LAU2.
13 Contiguity for urban clusters does include the diagonal (i.e. cells with only the corners touching). Gaps in the urban cluster are not filled
(i.e. cells surrounded by urban cells).
14 Contiguity for high-density clusters does not include the diagonal (i.e. cells with only the corners touching) and gaps in the cluster are filled
(i.e. cells surrounded by high-density cells).
15 Please note that this threshold refers to the population in the LAU2, whereas the threshold used in the definition of an urban cluster refers
to the set of contiguous grid cells – the cluster – which may cover cells belonging to several LAU2s.18
• Thinly populated LAU2s may be classified as intermediate or Poland Gminy
densely populated due to border effects if rural grid cells Portugal Freguesias
cover most of the territory. For that reason, LAU2s with Romania Communes, Municipiu, Orajse
a population below 5 000 inhabitants (15) and 90 % of its area
Slovenia Občine
in rural grid cells are reclassified as rural areas.
Slovakia Obce
• Very small densely populated LAU2s may be classified as thinly Finland Kunnat/Kommuner
populated due to the coarse (16) resolution of the population grid. Sweden Kommuner
For that reason, LAU2s with an area of less than 5 km² but with United Kingdom Wards (or parts thereof)
a share of surface outside rural grid cells higher than 30 % are Turkey Köy
reclassified as intermediate density or densely populated Iceland Sveitarfélag
according to the share of the correspondent cluster.
Norway Kommuner
Switzerland Gemeinden/Communes/Comuni
As LAU2s vary considerably in area, this methodology will lead
to a closer match between a high-density cluster and densely
populated LAU2s in countries with small LAU2s than in those
with large LAU2s. To take this difference into account, the clas- Note: This new methodology of classifying urban and rural
sification can be adjusted as follows: areas has been agreed by DG Regional Policy, DG Agriculture
and Rural Development and Eurostat. It replaces the methodol-
• A densely populated LAU2 can be classified as intermediate as ogy used in the LFS so far. The older methodology can be con-
long as 75 % of its high-density cluster population remains in sulted in previous versions of the explanatory notes.
densely populated LAU2s.
The definition of urban clusters is drawn from the new method-
• An thinly populated or intermediate density LAU2 can be classi- ology to classify urban and rural regions developed and agreed
fied as densely populated if it belongs to a group of LAU2s with by DG Regional Policy, DG Agriculture and Rural Development,
a political function and if the majority of the population of this Eurostat and the JRC in 2010. The definition of high-density
group of LAU2s lives in a high-density cluster. clusters is drawn from work done in 2011 by the OECD and
DG Regional Policy on a new metropolitan area definition.
A LAU2 consists of municipalities or equivalent units in the
28 EU Member States and EFTA countries and corresponds to
3 HOW TO UPDATE
the following entities:
Belgium
Bulgaria
Gemeenten/Communes
Naseleni mesta
THE NEW DEGREE
Czech Republic
Denmark
Obce
Kommuner
OF URBANISATION
Germany Gemeinden
Estonia Vald, Linn The new degree of urbanisation (DEGURBA) has been applied to
Greece Demotiko diamerisma/Koinotiko the local administrative units (17) (LAU) as of 1 January 2011.
diamerisma It will have to be updated to take into account the possible
Spain Municipios changes in the LAU boundaries. This can be done by reapplying
France Communes the full methodology or by applying a simpler approach which
Ireland DEDs/Wards does not rely on using geographical information systems. This
simpler approach is particularly suitable for relatively minor
Croatia
changes in the LAU boundaries. This section describes this sim-
Cyprus Dimoi, koinotites
pler method to update the DEGURBA.
Latvia Pilsētas, novadi, pagasti
Lithuania Seniūnijos LAU boundaries change in three different ways: mergers,
Luxembourg Communes boundary shifts and splitting. The most common change to
Hungary Települések LAUs in the last decade is merging, boundary shifts are less
Malta Kunsilli common and splitting is least common. Therefore, this section
Netherlands Gemeenten starts with a detailed description of how to deal with mergers.
The second part focuses on boundary shifts. The last part pro-
Austria Gemeinden
vides a simple approach to splitting.
16 ‘Coarse’ in relation to the small area of these particular LAUS2s.
17 In most cases, LAU level 2 was classified. In some cases, where the LAU2s are small and little to no data is available at that level, level 1 was classified
instead. In a few cases, the matching with the political functions of the densely populated areas meant that LAU1s were used for densely populated areas,
while LAU2s were used for thinly populated and intermediate areas.A H A R M O N I S E D D E F I N I T I O N O F C I T I E S A N D R U R A L A R E A S : T H E N E W D E G R E E O F U R B A N I S AT I O N 19
3.1 Merging LAU 3.1.4 Merges between thinly populated
areas and intermediate density areas
3.1.1 Merging LAUs with the same degree These merges can be addressed in two simple ways: using the pop-
of urbanisation ulation in an urban cluster; and using the population of the LAUs.
The new degree of urbanisation is additive, meaning that if two 1. If the population in the relevant urban cluster(s) is available in
LAUs are classified as low density, classifying both LAUs the list published by the Commission (19) and the population in
together will also make them low density (idem for the two the relevant LAUs has not changed significantly since 2006,
other degrees). adding the population in an urban cluster for each of the LAUs
and dividing it by the total population of the new LAU will deter-
If two or more LAU2s of the same degree of urbanisation mine the DEGURBA.
merge, the new merged LAU should remain in the same degree.
If more than 50 % of the population of the new LAU lives in an
urban cluster, the new LAU should be intermediate density.
3.1.2 Merging LAUs with different degrees
of urbanisation If the population share is less than 50 %, the new LAU should
be thinly populated.
The new degree of urbanisation treats the densely populated areas
or cities in a specific manner, which means that merges between 2. If the population in an urban cluster cannot be identified based
a thinly populated or intermediate density area and a densely pop- on the list published by the Commission (due to previous
ulated area have to be addressed in a particular manner. changes) or if the population in these LAUs has changed signifi-
cantly since 2006, the DEGURBA of the new LAU can be deter-
mined based on the population distribution between the LAUs.
3.1.3 Merges with a densely populated area
If more than 50 % of the population of the new LAU comes
The new DEGURBA specifies that each high-density cluster from thinly populated LAUs, the new LAU should be thinly
should have at least 75 % of its population covered by a densely populated.
populated LAU2. This implies that a densely populated area can
(in relatively rare cases) have less than 50 % of its population If more than 50 % of the population of the new LAU comes
inside a high-density cluster. Therefore, even if a merge leads to from intermediate density LAUs, the new LAU should be inter-
a drop of the share of population in a high-density cluster to mediate density.
below 50 %, the new LAU will most likely have to be densely pop-
ulated to ensure that at least 75 % of the population of the high-
density cluster remains included in a densely populated area. 3.2 Boundary shifts
The new DEGURBA foresees a method to match the densely Whereas merges can be dealt with perfectly by using a simple
populated area with a geographic area which has administra- method, boundary shifts cannot always be as reliably addressed.
tive functions. As the merging of the LAU will lead to the admin- In some rare cases, boundary shifts even between LAUs in the
istrative function covering both the old and the new LAU, this same degree of urbanisation can lead to a change in classifica-
link should be maintained in the new LAU. tion (20). Due to this complexity, a simple rule of thumb may be the
most efficient approach.
The new DEGURBA is also linked to a city data collection (the
Urban Audit). Therefore, all changes in the densely populated If a LAU loses less than 25 % of its population or gains less
area should be mirrored in the Urban Audit. Therefore, these 50 % of its population due to boundary shifts, the degree of
changes should be made in consultation with the national urbanisation does not change.
Urban Audit coordinators. These elements mean that:
This rule of thumb will probably cover 90 % of all boundary shifts
All merges with a densely populated area should be classi- and ensures a maximum continuity in degree of urbanisation.
fied as densely populated (18).
18 In exceptional cases, where the high-density cluster is close to the 50 000 population threshold and the merge leads to a very low population share
living in the high-density cluster, the new LAU can be classified as thinly populated or intermediate (depending on the size of the urban cluster)
if this LAU is simultaneously dropped from the Urban Audit.
19 For each LAU2, an estimate of the 2006 population inside an urban cluster and the total population is published on the RAMON website
(Eurostat’s metadata server). The 2006 figures should be used to keep consistency between the total population and the urban cluster population.
The Commission will publish 2011 figures for the two types of clusters and the LAU when they are available. In most cases, using 2006 data instead
of more recent data will make no difference in the classification.
20 For example, two thinly populated areas have a number of small and medium-sized towns which contain in each case about 45 % of their population.
A number of these towns are shifted to the other area, tipping the population in urban clusters over 50 %.
This would lead to a thinly populated LAU2 becoming intermediate.20
If this is not the case, a further investigation may be required. If this occurs, it cannot be assessed purely on population shares
Three cases are described below. of the original LAU. Two simple methods can be used in these
situations:
3.2.1 Changes in DEGURBA can be excluded 1 Look at the map with the urban clusters and high-density
clusters and the LAU boundaries to determine whether the
For each LAU, the share of population in three types of grids shift in boundary is likely to change the population share per
cells is known. This share allows us to identify situations where cluster in the revised LAU.
the DEGURBA cannot be changed. 2 Look at a local map to determine whether the boundary shifts
primarily affect rural areas, suburban or urban areas.
For example, if a LAU that has 100 % of its population in rural
grid cells shrinks, it will always remain thinly populated. If that
LAU adds population, it would have to more than double its 3.3 Splitting LAU
population (with population living exclusively in an urban clus-
ter) before it would become intermediate. This type of change is relatively rare. Therefore, the main rec-
ommendation is one of continuity, i.e. give the same degree of
If a boundary shift leads to a change in population that is urbanisation to all the new LAUs.
too small to tip the population share of the revised LAU
below 50 % of the relevant grid cells, it keeps the same If a LAU is split, the new LAUs should get the same degree of
degree of urbanisation. urbanisation as the old LAU.
If there are concerns that the new LAUs may have different
3.2.2 Changes in DEGURBA are unlikely but urban structures, the same approaches described for boundary
cannot be excluded shifts can be used:
If the boundary shifts lead to a change in population that is 1 Check the population share per grid cell for the old LAU. For
theoretically sufficient to tip the share of population below or example, if the old LAU has 100 % of its population in rural
above 50 %, but the shift is between LAUs with the same grid cells, splitting will have no impact.
degree of urbanisation, than the same degree of urbanisation 2 Check the pattern of urban clusters and high-density clusters
should be kept. on the map.
3 Check the urban structure on a local map.
3.2.3 Changes in DEGURBA are likely
3.4 Conclusion
In some cases, changes in DEGURBA are likely. Take for exam-
ple, if a city annexes a suburb located in a neighbouring LAU. This section provides an overview of how to identify the degree
The city (densely populated area) gains a small share of popu- of urbanisation of LAUs that have changed since 2011 without
lation (DEGURBA unchanged). The intermediate area loses 30 % using geographic information systems (GIS). The Commission
of its population and that population it lost was located in an will update the degree of urbanisation when a complete 2011
urban cluster (suburb). The population in the revised LAU now population grid becomes available and apply it to the most
has less than 50 % of its population living in an urban cluster recent LAU boundary set available.
and thus becomes thinly populated.
3.5 Summary table
Merging LAUs
Merging the same degree of urbanisation Merging densely populated areas with other Merging thinly populated and intermediate
areas areas
1 merged with 1 = 1 1 merged with 2 = 1 2 merged with 3 = 2 or 3
2 merged with 2 = 2 1 merged with 3 = 1 depending on population share in urban
3 merged with 3 = 3 clusters or in original LAUs
Boundary shifts
Rule of thumb: If a LAU loses less than 25 % of its population or gains less 50 % of its population due to boundary shifts, the degree
of urbanisation does not change
Changes excluded Changes unlikely Changes likely
Change in population too small to change Change in population is bigger but unlikely to Boundary shifts target a specific type
degree of urbanisation change degree of urbanisation of grid cells or urban structure
Splitting LAUs
Splitting 1 = 1 and 1
Splitting 2 = 2 and 2
Splitting 3 = 3 and 3A H A R M O N I S E D D E F I N I T I O N O F C I T I E S A N D R U R A L A R E A S : T H E N E W D E G R E E O F U R B A N I S AT I O N 21
4 UN PRINCIPLES AND 2.83. Hence, although the traditional urban-rural dichotomy is
RECOMMENDATIONS
still needed, classification by size of locality can usefully sup-
plement the dichotomy or even replace it where the major con-
cern is with characteristics related only to density along the
Principles and Recommendations for continuum from the most sparsely settled areas to the most
Population and Housing Censuses, Revision 2. densely built-up localities.
2008. UN Publication Sales No. E.07.XVII.8
2.84. Density of settlement may not, however, be a sufficient crite-
Locality (core topic) rion in many countries, particularly where there are large localities
that are still characterised by a truly rural way of life. Such coun-
2.78. For census purposes, a locality should be defined as a distinct tries will find it necessary to use additional criteria in developing
population cluster (also designated as inhabited place, populated classifications that are more distinctive than a simple urban rural
centre, settlement and so forth) in which the inhabitants live in differentiation. Some of the additional criteria that may be useful
neighbouring sets of living quarters and that has a name or are the percentage of the economically active population employed
a locally recognised status. It thus includes fishing hamlets, mining in agriculture, the general availability of electricity and/or piped
camps, ranches, farms, market towns, villages, towns, cities and water in living quarters and the ease of access to medical care,
many other population clusters that meet the criteria specified schools and recreation facilities. For certain countries where the
above. Any departure from this definition should be explained in facilities noted above are available in some areas that are still rural
the census report as an aid to the interpretation of the data. since agriculture is the predominant source of employment, it
might be advisable to adopt different criteria in different parts of
2.79. Localities as defined above should not be confused with the country. Care must be taken, however, to ensure that the defi-
the smallest civil divisions of a country. In some cases, the two nition used does not become too complicated for application to the
may coincide. In others, however, even the smallest civil division census and for comprehension by the users of the census results.
may contain two or more localities. On the other hand, some
large cities or towns may contain two or more civil divisions, 2.85. Even in the industrialised countries, it may be considered
which should be considered as segments of a single locality appropriate to distinguish between agricultural localities, mar-
rather than separate localities. ket towns, industrial centres, service centres and so forth, within
size-categories of localities.
2.80. A large locality of a country (that is to say, a city or
a town) is often part of an urban agglomeration, which com- 2.86. Even where size is not used as a criterion, the locality is
prises the city or town proper and also the suburban fringe or the most appropriate unit or classification for national purposes
thickly settled territory lying outside, but adjacent to, its bound- as well as for international comparability. If it is not possible to
aries. The urban agglomeration is therefore not identical with use the locality, the smallest administrative unit of the country
the locality but is an additional geographical unit, which may should be used.
include more than one locality. In some cases, a single large
urban agglomeration may comprise several cities or towns and 2.87. Some of the information required for classification may be
their suburban fringes. The components of such large agglom- provided by the census results themselves, while other informa-
erations should be specified in the census results. tion may be obtained from external sources. The use of informa-
tion provided by the census (as, for example, the size-class of the
Urban and rural (core topic) locality or the percentage of the population employed in agricul-
ture), whether alone or in conjunction with information from other
2.81. Because of national differences in the characteristics that sources, means that the classification will not be available until the
distinguish urban from rural areas, the distinction between the relevant census results have been tabulated. If, however, the cen-
urban and the rural population is not yet amenable to a single defi- sus plans call for the investigation of a smaller number of topics in
nition that would be applicable to all countries or, for the most part, rural areas than in urban areas or for a greater use of sampling in
even to the countries within a region. Where there are no regional rural areas, the classification must be available before the enu-
recommendations on the matter (21), countries must establish their meration takes place. In these cases, reliance must be placed on
own definitions in accordance with their own needs. external sources of information, even if only to bring up to date any
urban-rural classification that was prepared at an earlier date.
2.82. The traditional distinction between urban and rural areas
within a country has been based on the assumption that urban 2.88. The usefulness of housing census data (for example, the
areas, no matter how they are defined, provide a different way availability of electricity and/or piped water) collected simultane-
of life and usually a higher standard of living than are found in ously with, or not too long before, the population census should
rural areas. In many industrialised countries, this distinction has be kept in mind. Images obtained by remote sensing may be of
become blurred and the principal difference between urban and use in the demarcation or boundaries of urban areas when den-
rural areas in terms of the circumstances of living tends to be sity of habitation is a criterion. For assembling information from
a matter of the degree of concentration of population. Although more than one source, the importance of a well-developed sys-
the differences between urban and rural ways of life and stand- tem of geocoding should not be overlooked.
ards of living remain significant in developing countries, rapid
urbanisation in these countries has created a great need for
information related to different sizes of urban areas.
21 emphasis addedYou can also read