A Low-carbon roadmap for Belgium - Study realised for the FPS Health, Food Chain Safety and Environment - Klimaat.be
←
→
Page content transcription
If your browser does not render page correctly, please read the page content below

A Low-carbon roadmap for Belgium
Study realised for the FPS Health, Food Chain Safety and Environment

Industry sector – refineries document

This document is based on content development by the consultant team as well as
expert workshops that were held on the 17-07-2012 and 21-09-2012
Content – Industry sector - refineries

         ▪ Summary and references
         ▪ Context and historical trends
         ▪ Methodology
         ▪ Details of the ambition levels and costs per lever
         ▪ Resulting scenarios

                                                                2
Executive summary for the refineries sector
                          • 3 trajectories for production of refineries in Belgium have been defined, which include a range between ~-
                            8% to at least ~-50% of 2010 production levels in 2050.
Construction of                  • A low carbon world scenario will have impact on the refinery sector.
different future                 • At the moment: overcapacity world wide, no new builds in EU and US
  production                     • Today Belgium refinery sector very competitive in terms of energy efficiency, directly linked to
  trajectories                      petrochemical sector in Antwerp, but high labour costs. Belgian refinery output is twice the
                                    Belgian demand.
                                 • Trajectories 2 and 3 will be hard linked to the oil demand of the other sectors.

                        • GHG reduction potential (assuming constant production) is high - (Levers 3 description)
                             • Energy efficiency can be improved and reduce emissions by 30%
                             • Extra CHP potential is limited and can increase with 15% compared to the current level
  Estimate of                • Process improvements and new technology can be implemented from 2030 on and will improve energy
 potential and                  efficiency by 15%
cost for the GHG             • A 50% substitution of liquid fossil fuels by natural gas allows for an additional 11% of emission
   reduction                    reductions
 opportunities               • CCS can be applied on the remaining emissions and will reduce for a further 85%.

                        • NOTE: While the future production of refineries is under pressure, the uncertainty on investments in reduction
                          technologies increases. Building integrated scenario’s, we will take this into account.
   NOTE Except explicit mention, the reduction potential figures are mentioned at constant production, as reduction percentage versus 2010. Actions are
                                                                                                                                                          3
   applied in sequential order. Levers are of ambition 3 (except for CCS where level 2 is also detailed)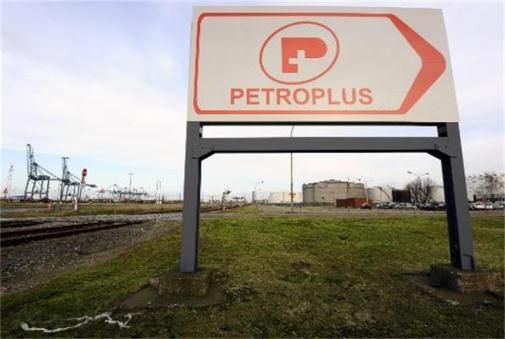
List of references
www.gva.be, www.vandaag.be, www.petrolfed.be
http://www.petrostrategies.org/Learning_Center/refining.htm
Presentation from Total Fina Antwerp, TFA scheme
Integrated Pollution Prevention and Control (IPPC), Reference Document on Best Available Techniques for Mineral Oil and Gas Refineries, February 2003;
http://eippcb.jrc.es/reference/BREF/ref_bref_0203.pdf
Industrial Emissions Directive 2010/75/EU, Best Available Techniques (BAT) Reference Document for the Refining of mineral oil and gas, Draft 2 March 2012;
http://eippcb.jrc.es/reference/BREF/REF_D2%20_032012.pdf
http://www.petrostrategies.org/Learning_Center/refining.htm
Concawe, The potential for application of CO2 capture and storage in EU oil refineries, report no. 7/11 Prepared for the CONCAWE Refinery Management Group by its Ad
Hoc Group on Carbon Capture and Storage; October 2011
IMJV data on thermal capacity
www.petrolfed.be – jaarverslag 2001 – 2006 - 2011
ATC PTIT Refining Trends for the future: a 2020 scenario, Axens IFP Group Technologies; http://www.authorstream.com/Presentation/Goldye-53781-ATC-PTIT-Refining-
Trends-future-2020-Sce-Scenario-Agenda-Global-Demand-Refined-Products-Projected-2005-refini-Education-ppt-powerpoint/
Europia, Annual report 2011
Flanders Common Reporting Format v1.6
Concawe, EU refinery energy systems and efficiency, report no. 3/12 Prepared for the CONCAWE Refinery Management Group by its Special Task Force RT/STF-1;
http://solomononline.com/documents/Whitepapers/EII_AM_WWW.pdf
Petroleum federation of India, FACTS SEP 2008; http://www.petrofed.org/
EUROPIA Contribution to EU energy pathways to 2050 Roadmap, July 2011
Benchmarkconvenant, www.benchmarking.be: jaarverslag 2010
ECN, Raffinaderijen naar 2030, ECN-E--10-064, December 2010
Platts newsfeed, http://www.platts.com/RSSFeedDetailedNews/RSSFeed/Oil/8279079
VITO & Econotec, KEY ASSUMPTIONS FOR SUBSEQUENT CALCULATION OF MID AND LONG TERM GREENHOUSE GAS EMISSION SCENARIOS IN BELGIUM
Ecolas, Evaluatie van het reductiepotentieel voor diverse polluentemissies naar het compartiment lucht in de sector van de petroleumraffinaderijen in Vlaanderen, i.o.v.
Aminal, Augustus 2002
E3M-lab, jrc-ipts, Ecofys, Sectoral Emission Reduction Potentials and Economic Costs for Climate Change (SERPEC-CC) - Industry & refineries sector, October 2009
UCE, Icarus-4, Sectorstudy for refineries, September 2001
4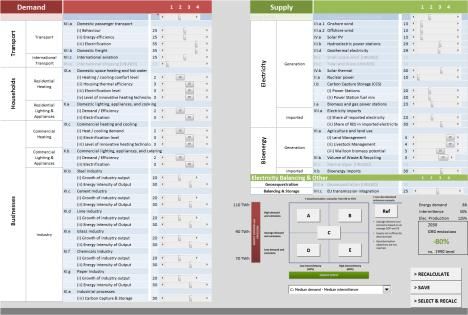
Content – Industry sector - refineries

         ▪ Summary and references
         ▪ Context and historical trends
         ▪ Methodology
         ▪ Details of the ambition levels and costs per lever
         ▪ Resulting scenarios

                                                                5
Geographical distribution of production sites
Antwerp, hot spot in Belgium
Destillation capacity (2011)
• Total Raffinaderij Antwerp
(TRA): 18,2 Mton
• Esso Belgium: 16,2 Mton
• Petroplus Refining Antwerp
Antwerp Terminal and
Processing Company (ATPC):
only desulferisation of mid-
destillates
• Petroplus Refining Antwerp
bitumen Antwerp Processing
Company (ATC): 1,2 Mton
• BRC relaunch by Gunvor,
Independent Belgian Refinery:
5,5 Mton
SOURCE: www.gva.be , www.vandaag.be, www.petrolfed.be 6
Details GHG for production sites (ETS registry)
Excluding cracker NC3 for TRA, cracker is included in chemical sector
Including all CHP installations (autoproducers + CHP in co-operation with electricity sector)

                                                                                 GHG emissions (kton
                                           Production site                             CO2)
                                                                                 2010 2009 2008
                                   Total Raffinaderij Antwerp                     3098 3058 3191
                                          Esso Belgium                            1799 1839 1666
                                       ATPC + ATC bitumen                           55    93       93
                                      Independent Belgian
                                                                                       522   526    525
                                            Refinery
                                              Total                               5474       5516   5475

    SOURCE: ETS registry, Belgium, excluding NC3 cracker (data from TRA, 21/09/2012)                       7
Technical detail refinery processes
Refinery complexity: from low to high
Flux of the process

CD: Atmospheric distillation, VD: Vacuum distillation, REF: reforming, FCC: fluid catalytic cracking,
COK: coking, HYT: hydrotreating, HR: hydrodesulferization

    SOURCE: http://www.petrostrategies.org/Learning_Center/refining.htm                                 8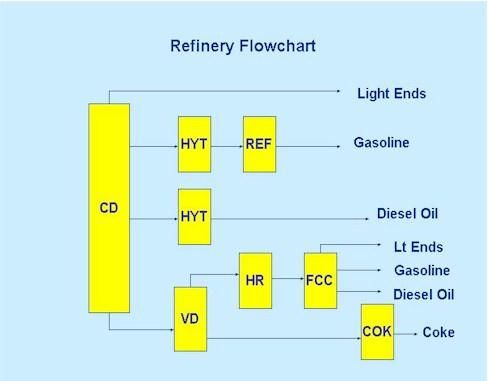
Nelson complexity index (2003) increased by 2010
The higher the index number, the greater the cost of the refinery and the higher the value of its products

                                                                                                         ▪    TRA:
                                                                                                             ▪ medium
                                                                                                                complexity, 8.3
                                                                                                             ▪ Second largest
                                                                                                                refinery complex in
                                                                                                                EU
                                                                                                         ▪    Esso:
                                                                                                             ▪  Complexity not
                                                                                                                known
                                                                                                         ▪    AT(P)C:
                                                                                                             ▪ Complexity not
                                                                                                                known
                                                                                                         ▪    IBR: 4.5

    SOURCE: BREF mineral oil and gas refineries, http://eippcb.jrc.es/reference/BREF/ref_bref_0203.pdf
             IBR: Petroplus Holdings AG, Company overview 2009                                                                        9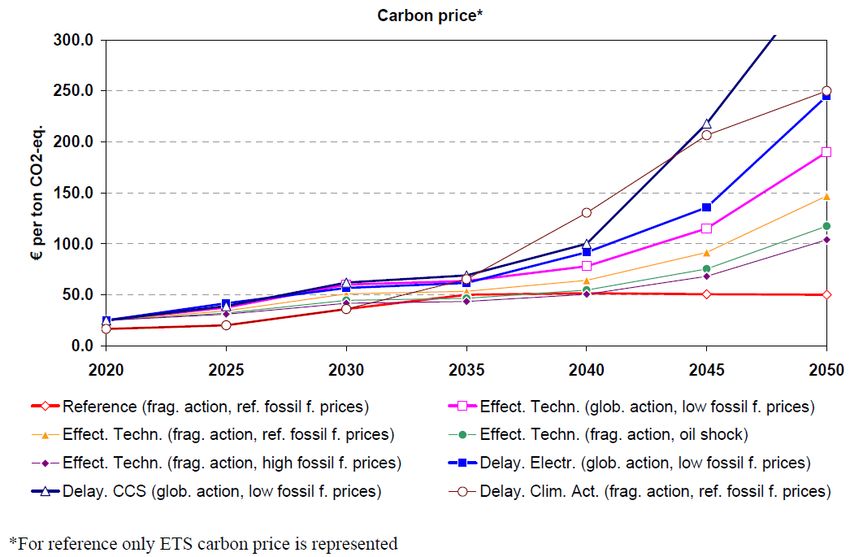
SOURCE: BREF mineral oil and gas refineries, http://eippcb.jrc.es/reference/BREF/ref_bref_0203.pdf
Most important processes energy use emissions
process furnaces and boilers, gas turbines, FCC regenerators, flare system and incinerators
11
SOURCE : www.concawe.be, the potential for application of CO2 capture and storage in EU oil refineriesMost important processes energy use emissions
process furnaces and boilers, gas turbines, FCC regenerators, flare system and incinerators
DISTILLATIE CONVERSIE ZUIVERING BLENDING
LPG
Ethyleen
Stoomkraker
Propyleen
Benzeen
Xyleen
Aromaten Eenheden
Crude Oil
Katalytische
reforming eenheid
60.000 bpsd Kerosine
RA
Crude Oil
Kero Merox
PL
27.000 bpsd
Atmosferische Distillatie eenheden
CDU3 & 4: 360.000 bpsd
Gasolie
Katalytische
Ontzwavelingseenheden
HDS1 - 4: 120.000 bpsd
ETBE eenheid
(Ethyl Tertiaire Buthyl Ether)
Benzine
Alkylation
16.500 bpsd
Atmosferische residu Clean Gasoline
Katalytische
ontzwavelingseenheid 57.000 bpsd
Kraakeenheden
ARDS: 96.000 bpsd FCCU1 & 2: 100.000 bspd
Stookolie
Visbreaker
Eenheid
Bitumen
Vacuüm
SOURCE: TFA scheme, IMJV data on thermal capacity Eenheid 12Belgian CO2 emissions decreased by 7,55% since 1990,
slightly below the 8% Kyoto 2010 objective
Belgium CO2 emissions in the 2010 NIR CRF
(MtCO2e)
Delta 90-10
-7,55% %
151
143 146 144
132 -7,55%
29
Energy industries 30 29 29
26 -12% Refinery +9,4%
33 33
Industrial energy use 33 29
24 -28%
19 16 16 13 -15%
Industrial processes 16
Building residential 22 21 22 23 +14%
21
Building commercial 4 6 6 6 7 +57%
Transport 20 23 25 26 24 +18%
Agriculture 15 15 13 12 1 12 1 -16%
Waste 1 3 1 3 1 2 2 1
Other
1990 1995 2000 2005 2010
NOTE: Excluding LULUCF, international bunkers and biomass
SOURCE: NIR CRF v1.4 13Refining capacity of refinery sector remained stable,
applied destillation capacity decreased
Destillation capacity remained stable from 1973-2010
Cracking capacity almost tripled
Applied destillation capacity decreased from 86 to 72%
Total processed crude oil + intermediate products [Mton]
Refining capacity [Mton]
Applied destillation capacity [%]
50 40 100
35 90
40 80
30
70
30 25 60
Mton
20 50
%
20
15 40
10 30
10
20
5
0 10
Destillation Cracking Reforming Desulferisation 0 0
1973 2000 2005 2010 2011
1973 2000 2005 2010 2011 Processing crude oil Used destillation capacity [%]
14
SOURCE : www.petrolfed.be – jaarverslag 2011Belgium netto production decreased,
Gasoline, residual oil - transport diesel
Percentage ‘diesel + fuel oil’ increased from 34% in 1973 to 44% in
2010
40
35
Other products
30
Naphta
25 Bitumen
Mton
20 Liquified gases
Residual fuel oil
15
Diesel + fuel oil
10
Kerosine
5 Car gasoline
0
1973 2000 2005 2010 2011
SOURCE : www.petrolfed.be – jaarverslag 2001 – 2006 - 2011 15Diesel to gasoline market ratio in EU-27 (1/3)
Diesel use increased dramatically in EU-27, gasoline use decreased
16
SOURCE : www.concawe.be, EU refinery energy systems and efficiencyDiesel to gasoline market ratio in EU-27 (2/3)
Imbalances and flows in 2005
4
4 Europe 2005:
North
23 25
18
35 ▪ EU: gasoline over-
America -10 CIS 6
production, kerosene
& diesel under-
-25
production
-4
▪ EU export gasoline to
-28
4 6 20 Asia - USA
7 Pacific ▪ EU import diesel
6 -10 27 -8
from Russia, USA
Africa &
Middle East
6 3
-5
Central & 12
South Gasoline
America Jet/Kerosene
Diesel All figures in
Fuel Oil
SOURCE : ATC PTIT Refining Trends for the future a 2020, Axens IFP Group Technologies
Mt/y 17Diesel to gasoline market ratio in EU-27 (3/3)
Major gasoline and diesel trade flows to and from EU Asia new importer of EU gasoline
2010:
▪ EU: gasoline over-
production, gasoil &
diesel under-
production
▪ EU export gasoline to
USA & Asia
▪ EU import diesel
from Russia, Asia,
USA
▪ Gasoline from not EU
≠ gasoline from EU
SOURCE : Europia, Annual report 2011 18EU-27 refineries energy use and energy efficiency
Energy use vs energy efficiency in refinery sector (1990-2010)
Higher energy consumption, but also higher efficiency because of more complex processes
▪ EII: Energy intensity
index developed by
HSB Solomon
Associates LLC
▪ EII is ratio of real
energy use vs
reference energy use
▪ Av. improvement:
- industry: 0,8 %/y
- refinery: 0,6 %/y
▪ Reference energy use
is calculated per type
of installation (AD,
VD, desulf, reformer,
…)
19
SOURCE : www.concawe.be, EU refinery energy systems and efficiency, http://solomononline.com/documents/Whitepapers/EII_AM_WWW.pdfEU-27 refineries energy use and energy efficiency
Increase in upgrading ratio driving the market
▪ Upgrading ratio: FCC
equivalent / CDU
capacity
▪ EU and USA not
increasing
▪ Asia strong
increase predicted
SOURCE: http://petrofed.winwinhosting.net, FACTS SEP 2008 20EU-27 change in energy mix used in refineries
Switch from heavy fuels to natural gas
▪ Why is this shift
happening:
▪ Price
▪ (because of GHG
reductions)
small impact
previous years
▪ also air pollutant
reductions
▪ CHP
implementation
▪ Low-S fuel sold
▪ Others ?
SOURCE : www.concawe.be, EU refinery energy systems and efficiency 21Belgium: GHG emissions have increased slightly since 1990
GHG emissions in refinery sector (1990-2010)
(MtonCO2e)
▪ All GHG emissions
5,00 covered by ETS
4,80 ▪ Despite decrease in
processed crude oil
4,60 GHG emissions
increase
4,40
▪ Increased
4,20 demand for
diesel, lower S-
Mton
4,00
content
3,80 ▪ Intermediate
3,60
products (high S-
content)
3,40 ▪ Percentage
3,20
diesel/total
destilled
3,00 ▪ Change in crude
1990 1995 2002 2005 2006 2007 2008 2009 2010
oil mix
SOURCE: FLA CRF v1.6 22EU-27 refining capacity: prospects (1/5)
Impact of external shocks (1980-2009)
23
SOURCE: Europia, Roadmap 2030-2050EU-27 refining capacity: prospects (2/5)
World refinery utilization rates
SOURCE: http://petrofed.winwinhosting.net, FACTS SEP 2008 24EU-27 refining capacity: prospects (3/5)
By 2030 oil demand could decline by 11% and by 30% in 2050 versus 2009
▪ From EU Roadmap
2050:
▪ Oil is likely to remain
in the energy mix in
2050 for long-
distance passenger
and freight transport
in all scenario’s
▪ Refinery sector will
remain in EU, but
sector must be able
to adapt capacity
levels to economic
realities
SOURCE: EU Roadmap 2050 Energy (upper), Europia, Roadmap 2030-2050 (lower) 25EU-27 refining capacity: prospects (4/5)
Policy scenarios deriving from the Competitive Low carbon Roadmap literally shape
the end of the refining business as we know it today.
EU refining capacity will need to adapt to EU demand decrease
GHG compared to 1990 2005 2030 2050
Total -7% -40 to -0.44% -79 to -82%
Sectors
Power (CO2) -7% -54 to -68% -93 to -99%
Industry (CO2) -20% -34 to -40% -83 to -87%
Transport (incl. CO2 avation, excl. Maritime) 30% 20 to -9% -54 to -67%
Residential and serices (CO2) -12% -37 to -53% -88 to -91%
Agriculture (non-CO2) -20% -36 to -37% -42 to -49%
Other non-CO2 emissions -30% -72 to -73% -70 to -78%
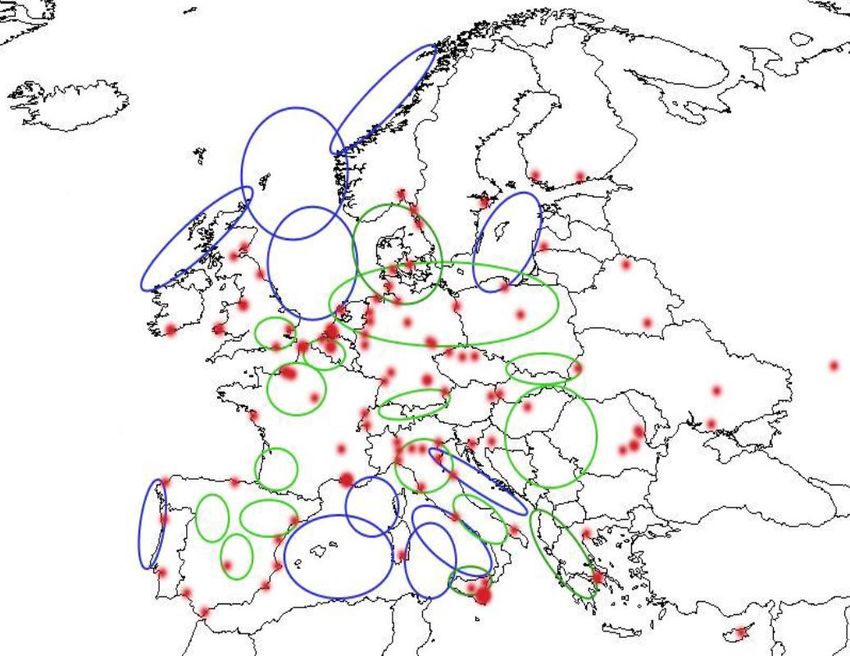
SOURCE: Europia, Roadmap 2030-2050 26EU-27 refining capacity: prospects (5/5)
EU legislation impacts directly EU refining costs and margins compared to other
regions
▪ Force capacity
reduction
▪ EU competetive
disadvantage, poor
investment outlook
▪ Threat for industrial
value chain
petrochemicals?
▪ Labour cost BE very
high compared to
neighbouring
countries
▪ IED: Industrial
Emissions Directive,
IPPC BAT
SOURCE: Europia, Roadmap 2030-2050 27Belgian refining capacity: prospects (1/3) Benchmark convenant (Steel + refineries) taking into account complexity Evolution primairy energy use of the refineries and steel companies at constant production level 2010 SOURCE: Benchmarkconvenant, www.benchmarking.be: jaarverslag 2010 28
Belgian refining capacity: prospects (2/3)
Trends apparent at world, EU and Belgian level
World EU Belgium
• Global refining capacity surplus • Competitiveness under pressure • Complexity of refineries
set to reach 6 million b/d by 2016 • Net margin decreasing increased
• ‘Capacity creep’ by • Overcapacity • Net margin decreasing since
debottlenecking and • Energy prices rise: gas prices 2008
improvement in equipment • Costs of environmental • Labour costs very high:
reliablility higher capacity regulation rise
• Capacity increase in Asia • FR vs BE: - 39 %
• Utilization rate is decreasing • NL vs BE: - 31 %
• USA no new capacity for • Market asks for more diesel, less
S content (liquid fuels in total) • Today Be refinery sector very
decades, decrease in operating competitive in terms of energy
refineries higher energy use, more complex
refineries efficiency
• Challenges: • Directly linked with
• Western Europe: shortage diesel,
• Crude oil sourcing, security too much gasoline production. petrochemical activities in ‘Port
• Crude oils become heavier Gasoline export more difficult of Antwerp’
• Margin improvement ethanol additive • Survival of the fittest = the most
• Environmental issues • from 1995 to 2007: -22 refineries complex, efficient refineries ?
BUT average crude capacity per Refineries that can adapt ?
refinery increased by 16% • Production Be = 2x own use in Be
SOURCE: ECN: Raffinaderijen naar 2030, http://www.platts.com/RSSFeedDetailedNews/RSSFeed/Oil/8279079, www.petrolfed.be (o.a. Nieuwsbrief N°3
2011), VITO & Econotec: KEY ASSUMPTIONS FOR SUBSEQUENT CALCULATION OF MID AND LONG TERM GREENHOUSE GAS EMISSION
SCENARIOS IN BELGIUM; Europia: STUDY ON OIL REFINING AND OIL MARKETS (Pervin & Gertz, Inc.) 29Belgian refining capacity: prospects (3/3)
New markets on the long term
Flexi refinery: handle wide range of crude oils, from high naphtenic acid to high S levels
Product mix improvement:
shift to mere production of feedstock for petrochemical sector capacity decrease necessary?
Next era: strong integration with biorefining
Bio-refinery future
Co-process feedstocks of bio-origin, production of second generation biofuels
Bio-substitutes for petroleum derivates, green chemistry, biofuels, bioplastics
Can refineries be adapted to bio-refineries?
Large-scale production of biofuels from algae
Alcohol production from ligno cellulosic material
Pyrolysis of biomass and gasification of biomass, pet-residue and coke
Location Belgium for bio-refining not ideal ?
Biomass availability limited
Import by bulk transport more difficult than crude oil
Can refineries reinvent themselves ?
SOURCE: VITO and http://petrofed.winwinhosting.net 30Content – Industry sector - refineries
▪ Summary and references
▪ Context and historical trends
▪ Methodology
▪ Details of the ambition levels and costs per lever
▪ Resulting scenarios
31Industry is one of the various sectors studied in the process of
constructing the low carbon scenarios
Focus of the consultations
Bottom up study by sector of Test each sector with Adapt the DECC model to
1 feasible GHG reductions 2 external experts 3 Belgian data and improve it
100% = 131,4 MtCO2e
Agriculture and waste
(incl. LULUCF) Others Consultations by sector
Power generation
Transport
8%
1% 20% with external experts
18%
18% Industry (combustion)
Discussions with
25%
Buildings
10% international experts
Industry (processes)
Review conclusions with the
Define and model Detail key implications for
4 various scenarios 5 these scenarios 6 steering and high level
consultation committees
5 scénarios de décarbonisation de 80 à 95%
Demande et Scénario A Scénario B
Federal administration
DEMANDE ENERGETIQUE et
émissions élevées
Industry
EMISSIONS
Demande et
émissions Scénario E
moyennes
Demande et
Scénario D Scénario C
Civil organizations
émissions faibles
Part intermittente faible Part intermittente faible
Academics
(~40%) – CSC inclus (~60%) – CSC exclus
OFFRE ENERGETIQUE ET CAPTURE D’EMISSIONS
…
Note: Orange = covered by this workshop 32The Open-source Prospective Energy and Emissions Roadmap Analysis
tool (OPE²RA) developed in partnership with the DECC (UK) will be
used to develop the scenarios
Cross-
government
engagement
Energy and emissions
Natural resources
Emissions
Technology
Industry Workshops
and Evidence
33OPE²RA balances demand and supply based on fixed input
parameters as well as modifiable levers
-80 to -95%
GHG
emissions
vs. 1990
34Industrial sectors modelled
Sector Consultation
Refineries Belgian Petroleum Federation
Iron & Steel Steel Federation
Chemicals Essenscia
Paper Cobelpa
Food Fevia
Bricks & Ceramics Bricks Federation
Non-ferrous metals Agoria
Cement Low Carbon Wallonia Roadmap
Lime Low Carbon Wallonia Roadmap
Glass Low Carbon Wallonia Roadmap
35A detailed analysis is performed for
each industrial sector
Understanding the industry Modelling demand Modelling trajectories with
trajectories intensity levels + CCS
Analyses Definition of the value chain Analyses of growth and competitivity Potential of CO2 reduction incl. costs
Results Modelling the emissions tree Demand trajectories Trajectories with different intensity levels
+ CCS
SOURCE: Climact 36Levers are applied in a sequential manner on an
indepth modeling Chemical industry
example
Modeling logic for the chemical industry
Capacity Production Fuels Process emissions Emissions Fuel costs Capex costs
Intensity
2010-2050 2010-2050 2010-2050 2010-2050 2010-2050 2010-2050 2010-2050
Sub-industries % Electricity
Organic and % Solid fuels
non-organic TWh tCO2e € €
Tons Tons % Liquid fuels tCO2e
Fertilizers /tons /ton
% Gaseous fuels
Industrial gases produced
% Biomass
Para chimicals
% Others
Action
TWh
Carbon intensity € €
/tons
level 3
…
Action CCS TWh tCO2e € €
level 3 /tons
Situation in 2050
374 ambition levels are defined for each lever
Level 1 Level 2 Level 3 Level 4
• Minimum effort • Moderate effort • Significant effort • Maximum effort to
(following current easily reached requiring cultural reach results close to
regulation) according to most change and/or technical and
• No additional experts important financial physical constraints
decarbonisation • Equivalent to the investments • Close to what’s
efforts/policies development of • Significant considered
• What will become a recent programs for technology progress reachable by the
« Reference some sectors most optimistic
scenario » observer
One of the key objectives of the consultation is to support the
estimation of these levels based on existing expertise
38Content – Industry sector – refineries
▪ Summary and references
▪ Context and historical trends
▪ Methodology
▪ Details of the ambition levels and costs per lever
▪ Resulting scenarios
39Growth prospects Belgium (1/2)
3 trajectories influencing energy demand will be modelled compared to
reference
Refineries
Possible growth scenarios
European population: 1% • Reference trajectory from study
Trajectory 1 100% RE in Belgium, only taking
Linked to demand prospects in other into account 202020 goals of EU
sectors. Belgian refineries exporters climate-energy package
of gasoline. • CAGR -8% in 2050
Background: low-carbon world, not • Trajectory linked to outcome fuel
only EU or Be Trajectory 2 demand other sectors when at
same trajectory level 2
• At least: CAGR -30% in 2050 cf.
Europia Roadmap 2050
• Trajectory linked to outcome fuel
Trajectory 3 demand other sectors when at
same trajectory level 3
• At least: CAGR -50% in 2050
40Growth prospects Belgium (2/2)
Production according to trajectories 1, 2 et 3
Production of total final products, ktons
Delta 2010-2050
30.000
▪ Trajectories 2 & 3 for
Trajectory 1 -8% refinery sector will be
25.000
linked with
trajectories for other
20.000 sectors (esp.
Trajectory 2 -30%
Transport, industry)
15.000 ▪ Background: low-
Trajectory 3 -50% carbon world, not
only EU or Be.
10.000
Trajectory 2& 3 linked to demand
5.000 Can be lower
0
2010 2020 2030 2040 2050
41Reduction potential
Reduction levers are additional and applied in the following order
Methodology
Energy Process
Product mix Fuel switching End of pipe
efficiency improvements
• Augmenting the • Reduce mechanical • Modification of • Towards fuels which • Carbon capture and
proportion of and thermal losses processes emit less CO2 storage
product which • Recuperate thermal
require less CO2 for energy (CHP)
production
opposite movement
is going on
Use sweeter Advanced
Energy efficiency Fuel vs. gas CCS
crude mixes distillation
Advanced Fossil fuels vs.
Biorefineries CHP catalysts biomass
Thermal cracking
[Beyond scope]
Sustainability of BAT application
biomass
Flare gas
recovery
42Energy efficiency (1/5)
Reduce thermal losses
• How to reduce thermal losses:
• Heat recovery from product streams, particularly from distillation columns
• Boiler water and feed preheating using waste heat
• Installation of additional levels of refrigeration
• Total reduction potential of efficiency measures = 20-50% (SERPECCC study),
payback period generally less than 2 years, but
• Complexity and high level of process integration implementation difficult,
mostly integrated during turnaround or planned shutdown of a unit.
• Sector: gradual renewal of units is common practice
• BPF: “Belgian refineries are in top 10 of most efficient refineries”
SOURCE: SERPECCC study 43Energy efficiency (2/5)
Reduce thermal losses
•In detail: what measures can be implemented:
• Process control and energy monitoring: use of plant-wide energy optimization
model to optimize the flows of intermediates, hydrogen, steam, fuel and
electricity use, integrated with an energy monitoring system.
Efficiency gains: 2-8% Belgium 4%
Cost: -89 €/ton CO2
• Process integration or pinch technology: find optimum site-wide utility levels
by integrating heating and cooling demands of various processes
Efficiency gains: 20-30%, economically feasible: 10-15% Belgium 12%
Cost: -69 €/ton CO2
• Steam generation and distribution : steam production correctly dimensioned,
steam trap maintenance
Efficiency gains: Belgium 2%
Cost: -84 €/ton CO2
SOURCE: SERPECCC study 44Energy efficiency (3/5)
Reduce thermal losses
•In detail: what measures can be implemented:
• Efficient drive systems: electric motors (pumps, compressors, fans, …)
represent 80% of electricity use look at entire motor system, matching speed
and load, correct sizing, upgrading
Efficiency gains: Belgium 16%
Cost: -84 €/ton CO2
• Power recovery FCC: recover energy from elevated pressure
Efficiency gains: Belgium 0%
Cost: -63 €/ton CO2
SOURCE: SERPECCC study 45Energy efficiency (4/5)
Reduce thermal losses benchmark convenant: 0,75 %/y
Level 1 Level 2 Level 3 Level 4
• Minimum effort • Moderate effort • Significant effort • Maximum effort to
(following current easily reached requiring cultural reach results close to
regulation) according to most change and/or technical and
• AV efficiency impr. experts important financial physical constraints
0,25 %/y 2010-2050 • Excluding electricity investments • Maximum process
use • Including electricity integration
• AV efficiency impr. use • AV efficiency impr.
0,5 %/y 2010-2050 • AV efficiency impr. 1,7 %/y 2010-2050
0,9 %/y 2010-2050
• 10% efficiency • 18% efficiency • 30% efficiency • 50% efficiency
improvement improvement improvement improvement
• Note: Building integrated scenario’s we will take into account that due to demand decrease, the refinery industry will be less
inclined to make energy improvement investments
SOURCE: SERPECCC study 46Energy efficiency (5/5)
CHP potential, cost 22 €/ton CO2
Level 1 Level 2 Level 3 Level 4
• Minimum effort • Moderate effort • Significant effort • Maximum effort to
(following current easily reached requiring cultural reach results close to
regulation) according to most change and/or technical and
experts important financial physical constraints
investments
• 0% extra • 10% extra • 15% extra • 20% extra
implementation of implementation of implementation of implementation of
CHP CHP CHP CHP
• Note: Building integrated scenario’s we will take into account that due to demand decrease, there is less potential for CHP
SOURCE: VITO 47Process improvements (1/4)
•In detail: what measures can be implemented:
• CDU: Theoretically 3 MJ/bbl needed for crude destillation = 3% of conventional
proces that uses 105 MJ/bbl major savings possible
• Advanced distillation: e.g. Progressive Crude Distillation: redesigning the crude
preheater and the distillation column especially suited for new construction or large crude
distillation expansion projects
Reduction energy use : Belgium 7% (19-30% reduction in CDU)
Cost: -65 €/ton CO2
• Dividing wall destillation: 30% reduction energy use CDU
• Fractionating, thermical and mechanical integration destillation columns
Reduction energy use: to 37 MJ/bbl or 65% reduction in CDU
Cost: 800 $2005/bbl
• Thermal cracking processes (available > 2020): switch from destillation to cracking
no double counting with ‘advanced destillation’ !
Reduction energy use : 15% compared to total use
SOURCE: SERPECCC study, ECN Raffinaderijen naar 2030 (Haddad & Manley, 2008) 48Process improvements (2/4)
•In detail: what measures can be implemented:
• FCC: uses vacuum destillates (vacuum gasoil) as input LPG, gasoline, olefines
as output
• Under pressure, because of overproduction of ligth fractions in EU.
• Advanced catalysts for Fluid Catalytic Cracker
Reduction energy use : 2%
• Flare gas recovery: installing recovery compressors and collection and storage
tanks combined with new ignition systems
Reduction energy use: Belgium 2%
Cost: -83 €/ton CO2
SOURCE: SERPECCC study, ECN Raffinaderijen naar 2030 49Process improvements (3/4)
•In detail: what measures can be implemented:
• Fouling mitigation of heat exchangers
Reduction energy use : 2%
• Advanced catalysts for hydroprocessing
Reduction energy use : 2%
• Biodesulpherisation as alternative to hydrodesulpherisation: lower
temperature, atmospheric pressure
Reduction energy use : unknown
SOURCE: Icarus-4 refineries 50Process improvements (4/4)
Level 1 Level 2 Level 3 Level 4
• Minimum effort • Moderate effort • Significant effort • Maximum effort to
(following current easily reached requiring cultural reach results close to
regulation) according to most change and/or technical and
experts important financial physical constraints
investments
• Not applied • Not applied • Applied starting • Applied starting
from 2030, 15% from 2020, 23%
reduction energy reduction energy
use use
SOURCE: SERPECCC, Icarus-4 51Fuel switching : Switch to gas
Level 1 Level 2 Level 3 Level 4
• Minimum effort • Moderate effort • Significant effort • Maximum effort to
(following current easily reached requiring cultural reach results close to
regulation) according to most change and/or technical and
experts important financial physical constraints
investments
• 0% extra switch to • 25% extra switch to • 50% extra switch to • Up to 100% switch
gas > 2010 gas > 2010 gas > 2010 to gas
SOURCE: VITO 52Fuel switching : Switch to biomass
Level 1 Level 2 Level 3 Level 4
• Minimum effort • Moderate effort • Significant effort • Maximum effort to
(following current easily reached requiring cultural reach results close to
regulation) according to most change and/or technical and
experts important financial physical constraints
investments
• No biomass • No biomass • No biomass • No biomass
SOURCE: VITO 53Reduction potential: CCS (1/4) Industrial costs USD/tCO2e SOURCE: IEA 54
Reduction potential: CCS (2/4)
CCS potential is based on size of installations

                                    ton CO2eq by production site category
             Industry                                                                 Total     Level 1        Level 2        Level 3        Level 4
                                1 M
  Iron & steel                1.291.469            787.034           4.386.583     6.465.086              0%        68%            80%            85%
  Non ferrous metals            310.098                  -                     -     310.098              0%             0%             0%        85%
  Chemical                    1.777.925          1.185.959           3.088.691     6.052.575              0%        51%            71%            85%
  Refineries                     54.765            521.974           5.784.870     6.361.609              0%        85%            85%            85%
  Lime                          363.771          1.517.514           1.240.023     3.121.308              0%        40%            85%            85%
  Glass                         457.924            601.861                     -   1.059.785              0%             0%        57%            85%
  Cement                        155.095            695.438           3.998.520     4.849.053              0%        82%            85%            85%
  Food                          981.850                  -                     -     981.850              0%             0%             0%        85%
  Pulp & paper                  768.785                  -                     -     768.785              0%             0%             0%        85%
  Bricks & ceramics             567.888                  -                     -     567.888              0%             0%             0%        85%
  Total                       6.729.570          5.309.780          18.498.687     30.538.037             0%        59%            73%            85%
  Coverage level 1
  Coverage level 2
  Coverage level 3
  Coverage level 4

     SOURCE: ETS registry (Belgium), analyse VITO&Climact                                                                                               55
Reduction potential: CCS (3/4)
CCS potential is based on size of installations
TRA
Esso
IBR
56
SOURCE : www.concawe.be, the potential for application of CO2 capture and storage in EU oil refineriesReduction potential: CCS (4/4)
Location of EU refineries and potential CO2 storage areas
▪ Red dots: refineries
▪ Blue areas: offshore
storage
▪ Green areas: onshore
storage
57
SOURCE : www.concawe.be, the potential for application of CO2 capture and storage in EU oil refineriesReduction potential:
Maximum reduction potential for different levers, horizon 2050
Refinery sector
Reduction potential (negative numbers) or implementation
Type of lever Improvement (positive numbers) (2050) in % Cost Description
1 2 3 4
Product mix Change in crude oil mix N/A N/A N/A N/A /
Energy efficiency measures -10% -18% -30% -50% -89 to -63 €/ton CO2
Energy efficiency
CHP 0% +10% +15% +20% 22 €/ton CO2
Process improvements from
Process improvement NA NA -15% -23% -84 to 200 €/ton CO2
2020 or 2030
Switch fuel towards gas 0% 25% 50% 100% Cost of fuels
Alternative
combustibles
Switch fossil fuels towards
NA NA NA NA /
biomass
End of pipe CCS 0% 85% 85% 85% 45 €/tCO2
58Carbon price evolution EU Roadmap 2050 SOURCE: Impact assessment: A Roadmap for moving to a competitive low carbon economy in 2050 59
Content – Industry sector - refineries

         ▪ Summary and references
         ▪ Context and historical trends
         ▪ Methodology
         ▪ Details of the ambition levels and costs per lever
         ▪ Resulting scenarios

                                                                60
Resulting scenario’s
Sector calls for “evidence-based assessment” of the conclusions.
In the report we will emphasize the global context in which we work:
− security of supply
− global competition
− energy efficiency
− diesel/gasoline imbalance
61Reduction potential
Emissions according to different trajectories
Trajectory 1 (CAGR -8% in 2050), GHG emissions for different ambition levels excl. CCS
(MtonCO2e)
13
12
11 1 -12%
10
9 2 -20%
8 3 -32%
7
6 4
5
-52%
4
3
2
1
0
2010 2015 2020 2025 2030 2035 2040 2045 2050
SOURCE: OPE²RA model 62Reduction potential
Emissions according to different trajectories
Trajectory 2 (CAGR -30% in 2050), GHG emissions for different ambition levels excl. CCS
(MtonCO2e)
12
11
10
9
8 1 -33%
7 2 -39%
6 3 -48%
5
4 4 -64%
3
2
1
0
2010 2015 2020 2025 2030 2035 2040 2045 2050
SOURCE: OPE²RA model 63Reduction potential
Emissions according to different trajectories
Trajectory 3 (CAGR -50% in 2050), GHG emissions for different ambition levels excl. CCS
(MtonCO2e)
12
11
10
9
8
7
6 1 -52%
5 2 -56%
4 3
-63%
3 4
2 -74%
1
0
2010 2015 2020 2025 2030 2035 2040 2045 2050
SOURCE: OPE²RA model 64Reduction potential
GHG emissions for different trajectories and ambition levels
(MtonCO2e and % change (% of 2010 level))
MtCO2e -8% -30% -50% -83 à -87%
12
10
-40%
8
-34%
6
-24% Level 1
4
Level 2
2 Level 3
Level 4
0
Baseline Levels on Levels on Levels on EU target
2010 Trajectory 1 Trajectory 2 Trajectory 3 Industry
2050
SOURCE: OPE²RA model 65Reduction potential
Details for trajectory 2 with ambition level 2, incl. CCS
GHG emissions in 2050 using different levers
(% of 2010)
12 11,80
-30%
11
10 3,58
9
-12%
8 +3% -0% -0%
1,40 -52%
7 0,36 0,01 0,00 -91%
6
5
4 6,09
3
2
1,08
1
0
2010 baseline 2050 BAU Energy CHP Fuel to gas CDU, FCC, flare CCS Residual
efficiency
NOTE: Percentage reductions are calculated vs the 2010 baseline
SOURCE: OPE²RA model 66Reduction potential
Details for trajectory 2 with ambition level 4, incl. CCS
GHG emissions in 2050 using different levers
(% of 2010)
12 11,80
-30%
11
10 3,58
9
-25%
8
7 3,00 -95%
6 +2% -0%
-10%
0,26 0,04
5 1,16 -31%
4
3
3,64
2
1 0,65
0
2010 baseline 2050 BAU Energy CHP Fuel to gas CDU, FCC, flare CCS Residual
efficiency
NOTE: Percentage reductions are calculated vs the 2010 baseline
SOURCE: OPE²RA model 67Cost
Marginal cost and abatement potential for different levers
under trajectory 2 with ambition level 4
GHG abatement curve for the year 2050 (trajectory 2, ambition 4)
€/tCO2e, % emission abatement in 2050 (% of 2010 level)
€/tCO2e
CCS
100
45
50
0
-50 100% 2.0 2.5 3.0 3.5 4.0 4.5 5.0 5.5 6.0 6.5 7.0 7.5 8.0
-56
-100 -89 CDU, FCC, Flare
-150 Energy
-200 efficiency
-250 % emission
-300 abatement in 2050
-350 (% of 2010 level)
-343
Fuel to gas
NOTE: Hypothesis of cost neutral energy efficiency measures
SOURCE: OPE²RA model 68Thank you. Pieter Lodewijks – 014 335926 – pieter.lodewijks@vito.be Erik Laes – 014 335909 – erik.laes@vito.be Jan Duerinck – 014 335878 – Jan.Duerinck@vito.be
You can also read