A Moment of Truth: Ohio's Transportation Funding Problem, and How to Solve It - Fix Our Roads Ohio
←
→
Page content transcription
If your browser does not render page correctly, please read the page content below
A Moment of Truth:
Ohio’s Transportation Funding Problem,
and How to Solve It.

                        Better Transportation for Working and Living

                                                     JANUARY 2019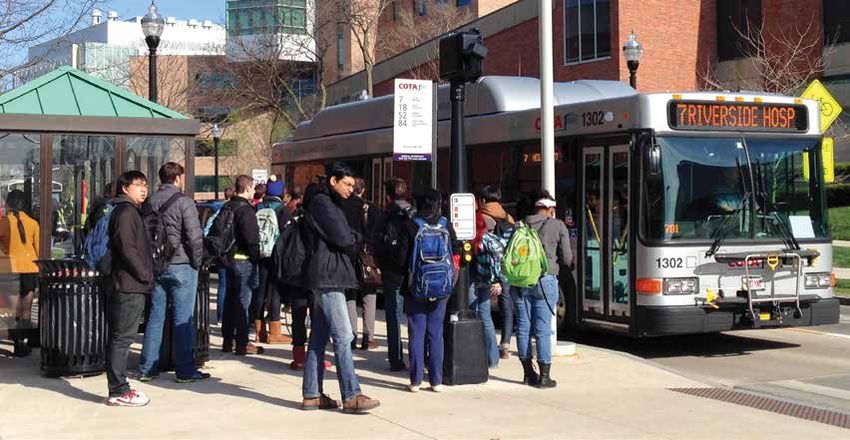
Fix Our Roads Ohio — Case Statement
As Ohio addresses the economic and social challenges of the 21st Century, the state faces a major shortage of reliable
funding for our state’s roads and bridges. Unless action is taken soon to address the issue, the system will continue to fall
into disrepair and become further congested – damaging the overall vitality of our state and the people who live here.

A diverse group of Ohioans with a shared interest in the future of our state’s economy and lifestyle has come together to
ask Ohio policy makers to focus on our state’s transportation funding structure and enact solutions. Fix Our Roads Ohio
(FOR Ohio) is a coalition of stakeholders that have united in an effort to educate state leaders on the critical needs of Ohio’s
transportation infrastructure, and to advocate for a dedicated funding solution that provides long-term, smart investment in
Ohio’s transportation future.

Overview                                                                        Our state’s economy and quality of life are directly
                                                                                tied to the quality of our transportation system. The
Ohio has one of the largest and most active transportation
                                                                                high volume of passenger vehicles and commercial
systems in the United States, with 262,350 total road lane
                                                                                freight traffic flowing through the state every day
miles and 44,657 bridges. Ohio is located within one day’s
                                                                                supports businesses, provides jobs and ultimately
drive of 60% of the population of the United States and
                                                                                drives Ohio’s economy. But population growth and
Canada and ranks near the top of the pack compared with
                                                                                economic development mean increased demands on
all other states in many other measurements:
                                                                                our roads and bridges. As traffic congestion worsens
    2nd largest inventory of bridges
                                                                                each year, more and more roads suffer from potholes
    3rd largest in freight volume
                                                                                and rutted pavement. Congestion costs Ohio motorists
    4th largest interstate highway system (based on
                                                                                an estimated $4.7 billion each year in lost time and
    lane miles)
                                                                                wasted fuel. Many of Ohio’s bridges are showing their
    6th in the country in total Vehicle Miles Traveled,
                                                                                age with structural deficiencies.
    at 118.6 billion miles annually

                                           Annual Cost of Congestion in Ohio Cities
                                                                       Cost Per Commuter                      Total Cost
                     Urban Area Annual Hours Annual Cost of                                         Total Annual     Total Annual Cost
                                of Delay Per Congestion Per                                        Hours of Delay      of Congestion
                                 Commuter      Commuter                                            (in thousands)       (in millions)
  Cincinnati OH-KY-IN                41         $ 989                                                    48,485           $ 1,159
  Cleveland OH                       38         $ 887                                                    45,051           $ 1,046
  Columbus OH                        41         $ 933                                                    40,025           $ 921
  Toledo OH-MI                       38         $ 920                                                    15,905           $ 381
  Dayton OH                          25         $ 590                                                    14,604           $ 346
  Akron OH                           27         $ 634                                                    12,283           $ 284
  Youngstown OH-PA                   20         $ 466                                                     7,744           $ 181
  Canton OH                          16         $ 367                                                     4,761           $ 107
  Huntington WV-KY-OH                16         $ 362                                                     3,280           $      77
  Lorain-Elyria OH                   14         $ 308                                                     2,550           $      58
  Lima OH                            12         $ 325                                                       938           $      25
  Wheeling WV-OH                     11         $ 275                                                       954           $      24
  Parkersburg WV-OH                  14         $ 317                                                       965           $      22
  Middletown OH                       8         $ 182                                                       850           $      20
  Mansfield OH                       10         $ 232                                                       838           $      19
  Weirton-Steubenville WV-OH-PA      10         $ 239                                                       742           $      18
  Springfield OH                      9         $ 195                                                       796           $      18
  Newark OH                           7         $ 167                                                       621           $      14
  Total Ohio Cities 				                                                                               201,392            $ 4,720
Source: Texas Transportation Institute 2015 Urban Mobility Scorecard

2 Fix Our Roads Ohio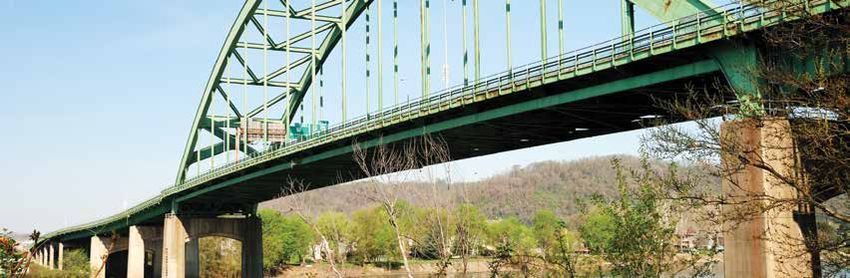
State                                                                               Preliminary information from ODOT indicates
  In the Ohio Department of Transportation’s preliminary                              that, absent new revenues, the agency will make
  budget plan for FY 2020 and 2021, the vast majority                                 significant program cuts in the next biennium
  of highway revenues are allocated for highway                                       in order to meet its requirement to present a
  maintenance rather than increasing capacity and building                            balanced budget. The anticipated reductions will
  a transportation system that will carry Ohio into the future.                       eliminate funding for new projects aimed to add
  Unfortunately, available funding is about to dramatically                           capacity and relieve congestion on Ohio roads, as
  decrease with the expiration of Ohio’s Turnpike Bond                                well as delay needed maintenance and upgrades
  program and the continuing influence of inflation. This is                          to existing bridges and roadways. A cutback in
  demonstrated by the decreasing size of the ODOT capital                             transportation investment will negatively ripple
  program from a high of approximately $2.4 billion in FY                             through Ohio’s economy as road conditions worsen
  2014 to approximately $1.7 billion in FY 2020.                                      and construction jobs are lost.

  According to the TRIP transportation research group’s 2018                          Local
  report, Modernizing Ohio’s Transportation System, 30% of                            The predicament of insufficient funding for roads and
  Ohio’s major roads are in poor or mediocre condition. The                           bridges is not limited to the state-maintained system. The
  FHWA National Bridge Inventory, which compiles data for                             County Engineers Association of Ohio has reported that
  bridges spanning more than 20 feet, rates 1,653 of Ohio’s                           only 40% of the funds needed to bring aging roads to
  bridges as structurally deficient, meaning there is significant                     current standards, replace or repair all eligible bridges,
  deterioration of the bridge deck, supports or other major                           pave county roads on a 10-year cycle, and perform
  components. Without adequate funding, Ohio roads and                                ongoing maintenance, are currently available to perform
  bridges will continue to fall into disrepair.                                       this work. This deficiency in funding leads to a continuing

                                            ODOT Capital Program Funding 2014-2021
                $2,500
                                $2,422                                       $2,291
                $2,000                                             $2,203                  $2,210
                                                 $2,081
$ in Millions

                                                                                                         $2,019
                $1,500                                                                                                 $1,740        $1,708

                $1,000

                $500

                $0
                                2014              2015             2016      2017          2018           2019          2020          2021
                         Source: ODOT pro forma Budget 2020-2021 10/4/2018

                                                                                          Better Transportation for Working and Living 3
downward spiral of deteriorating roadway and bridge                                              our roads is directly related to our quality of life and to
conditions.                                                                                      the economic competitiveness of our state.

Technology                                                                                       A recent study by the American Road & Transportation
Beyond these critical existing needs, the future of                                              Builders Association (ARTBA) studied the impact on
transportation contemplates advanced technology such                                             economic benefits under two scenarios: 1) an Ohio
as autonomous vehicles and smart mobility. Ohio has                                              Department of Transportation (ODOT) capital program
been a leader in the development of this technology. At                                          at 2014 and 2015 levels of $2.4 billion, and 2) an ODOT
current funding levels, however, Ohio can’t even maintain                                        program of $1.7 billion, a 29% decrease, as anticipated
its existing system, and is ill-prepared to be a leader in                                       in ODOT’s next biennium budget. The study found the
constructing necessary infrastructure improvements for                                           difference in economic activity generated by these
future needs.                                                                                    two scenarios to be significant. Specifically, the report
                                                                                                 found that over a 10 year period, should ODOT’s budget
Over the years, there have been a number of short-                                               decrease, the State of Ohio would forego $2.4 billion per
term efforts at the state and federal levels to provide                                          year in output, tax revenues, earnings and user benefits.
transportation funding. In January 2019 Ohio will seat a                                         The reduction in funding would deprive jobs to 8,710
new Governor and a new session of the General Assembly                                           Ohioans who would otherwise generate $417 million per
will begin. Among the most critical decisions facing                                             year in earnings. In addition, with the higher investment
the new administration and legislature will be                                                   level, the percent of travel on deficient roadways would
how to adequately provide sustainable, long-term                                                 decrease from 22.3% of travel to 13.4% after 10 years.
funding of Ohio’s transportation infrastructure at                                               At the anticipated lower level of funding, the percent of
the state and local levels.                                                                      travel on deficient roadways would increase to 25.4% of
                                                                                                 all travel.
An Investment in Roads                                                                           Investing in Ohio’s transportation future is about
is an Investment in                                                                              ensuring safe, effective, efficient transportation for
Ohio’s Economy                                                                                   all Ohioans. In combination with road and bridge
Ohio’s roads, highways, and bridges are vital links for the                                      improvements, FOR Ohio believes that any responsible
state’s residents, businesses, and visitors, providing daily                                     funding plan must consider public transit systems to
access to homes, jobs, shopping, healthcare and social                                           address urban and rural mobility needs in addition to
services, natural resources, and recreation. The quality of                                      highways, roads, and bridges.

               Annual Economic Impacts and User Benefits of Two Highway
                        and Bridge Investment Scenarios in Ohio
                                                                                    ODOT                           ODOT
                                                                                                                                            Foregone
                                                                               Capital Program                Capital Program
                                                                                                                                             Benefits
                                                                                 $1.7 Billion                   $2.4 billion
  Economic Impacts
  Employment 		 21,484                                                                           jobs 		 30,194 jobs 		 8,710 jobs
  Total Output                             $   3.8                                               billion $   5.3 billion $   1.5 billion
  Earnings                                 $   1.0                                               billion $   1.4 billion $ 417.2 million
  Total Tax Revenues*                      $ 194.2                                               million $ 273.0 million $ 78.7 million
  Total Economic Impacts                   $ 5.0                                                 billion $   7.1 billion $   2.0 billion
  User Benefits**                          $   2.1                                               billion $   2.5 billion $ 400.2 million
  Total Economic Impacts and User Benefits $ 7.1                                                 billion $   9.6 billion $   2.4 billion
  *State Payroll Tax; Federal Payroll Tax; State & Local Income Tax; State and Local Sales Tax
  **Safety Benefits; Operating Benefits; Travel Time Benefits; Maintenance Savings
Source: American Road & Transportation Builders Association December, 2018

4 Fix Our Roads Ohio
Current State of Funding of Ohio has identified $1.12 billion in needs on the county-
maintained system alone.
First levied in 1925, the primary source of road and
bridge funding in the state of Ohio is the Motor Fuel User
During the stimulus/bond program periods, the traditional
Fee. The fee is a fixed per-gallon-purchased fee rather
and most productive source of road and bridge funding —
than a percentage of the price-per-gallon. This means
the motor fuel user fee (gas tax) — provided the bulk of
that regardless of the price per gallon of gasoline, the fee
funding for maintaining roads at the state and local levels.
remains constant: 18.4 cents per gallon for the federal fee
and 28 cents per gallon for the state fee. (The federal fee
has not changed since 1993. The last state adjustment to Impact of Inflation on Ohio Motor
this motor fuel user fee was in 2005.)
Fuel User Fee 2005 vs. 2018
(Buying Power, Cents-per-Gallon)
According to the Ohio Department of Transportation,
$100 in construction in July 2005 cost $152 in June 2018.
$0.30
Today’s purchasing power of the state’s 2005 28-cent
motor fuel user fee now equates to 18-cents in 2018 $0.28
dollars. At the state level, one cent of fuel fee generates $0.20
approximately $66 million in revenue. $0.18
$0.10
Available funding for roads and bridges is decreasing by
$250 million on average per year, due to the conclusion
$0.00
of the Ohio Turnpike bonding program. The Ohio Turnpike 2005 2018
and Infrastructure Commission issued bonds in August Source: Modernizing Ohio’s Transportation System TRIP, June 2018
2013 in the amount of $1 billion and another issuance in
2018 for $550 million. The entirety of that amount will
be encumbered for specific projects by the end of State
Fiscal Year 2019.
Impact of Inflation on
Construction Costs 2005 vs. 2018
Bond programs necessarily come to an end. The
unfortunate result is a large decrease in available funding $200
and an ensuing fiscal and political scramble to ensure
funding for the upkeep of Ohio roads. $150
$152
Additionally, the Ohio Turnpike bond program (and before $100
it, federal stimulus funding), benefited state and interstate $100
systems, but did little to meet local highway and bridge
funding needs. In fact, the County Engineers Association $50
2005 2018
Source: ODOT
Better Transportation for Working and Living 5Funding Solution Options source that supports necessary funding on a long-term,
sustainable basis.
Given the ongoing maintenance and construction needs
of Ohio’s roads and bridges, and the decline in available
Option: Phase in an increase to Ohio’s Motor
funding being generated to meet those needs, FOR Ohio
Fuel User Fee. The goal should be to recover
offers a package of revenue-raising options to provide
the losses caused by inflation since 2005 and
a sustained and reliable funding stream to maintain
and improve Ohio’s state and the expiring turnpike bond program and to index
local transportation system. The the fee (using the ODOT
options include: State Motor Fuel Tax Rates Construction Materials Index)
(Cents-per-Gallon) in order to provide long-term
Increase the Motor Fuel User stability. Alignment with
Fee. One of the most obvious 44.1¢ the corresponding rates in
solutions is an adjustment to the neighboring states would be
motor fuel users’ fee (motor fuel 58.7¢ a sensible guideline.
tax), which is the primary source
of Ohio’s highway construction 28¢ Levy an Alternative Fuel
revenue. At 28 cents per gallon, Vehicle Fee. Construction and
42.9¢
Ohio currently ranks 29th in the maintenance of Ohio’s road and
nation, and is much lower than 35.7¢ highway system comes largely
border states Indiana, Michigan, from users of the system via the
26¢
and Pennsylvania. The gas tax motor fuel user fee. With the advent
collection mechanism is already Source: American Petroleum Institute, December 2018 of alternative fuel vehicles, there is
https://www.api.org/oil-and-natural-gas/consumer-information/motor-
in place. And by indexing the fee fuel-taxes/gasoline-tax a rapidly-growing cross section of
so that it keeps up with inflation, it motorists who are using the roads,
will not require lawmakers to continually make changes but because they don’t purchase gasoline, they are not
over time. Ohio’s motor fuel tax is an inherently fair contributing toward the maintenance and construction of
user fee – those who use the roads pay for better and the system. Now is the time to assess system maintenance
safer roads. Finally, the fee is the only identified revenue to these unique vehicles. To date, nineteen states have
6 Fix Our Roads Ohioimplemented some form of fee collection from alternative
fuel vehicle owners. State Transit Investment by
Per Capita Funding
Option: Adopt an annual Alternative Fuel State State Transit Per Capita
Vehicle Fee to put Ohio in line with other states. Funding FY 2016 FY 2016
Alignment with fees in neighboring states would DC $ 531,633,000 $ 776.86
be a sensible guideline. Massachusetts $ 1,729,471,556 $ 253.45
New York $ 5,011,381,700 $ 252.64
Study alternatives to the motor fuel vehicle user Alaska $ 173,199,886 $ 233.57
Illinois $ 2,574,752,065 $ 200.59
fee. The threat of constrained oil supplies and an ever- Maryland $ 1,125,249,671 $ 186.77
increasing number of alternative-fueled vehicles make it Connecticut $ 582,693,314 $ 162.41
clear that the long-term use of petroleum-based fuels will Delaware $ 138,327,530 $ 145.20
be dwindling. Ohio must engage in the ongoing national Pennsylvania $ 1,647,371,630 $ 128.83
Minnesota $ 416,207,000 $ 75.33
discussion related to alternative funding methodologies.
California $ 2,301,559,553 $ 58.57
Rhode Island $ 54,521,504 $ 51.55
Option: Engage in future funding discussion New Jersey $ 349,353,029 $ 38.91
through research, debate and, when appropriate, Virginia $ 275,122,201 $ 32.70
pilot project activities for a primary funding Michigan $ 265,995,916 $ 26.78
Wisconsin $ 110,737,500 $ 19.18
alternative. Florida $ 346,922,736 $ 16.79
Vermont $ 7,616,974 $ 12.22
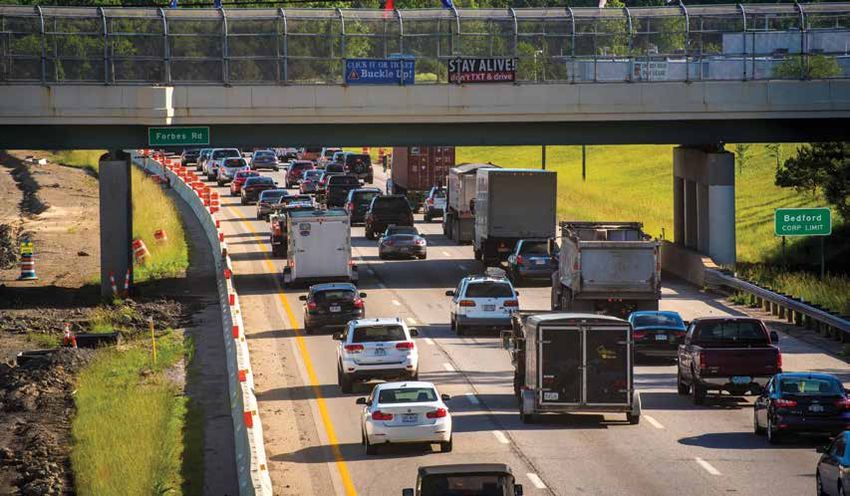
Identify a dedicated funding source for public Washington $ 85,568,222 $ 11.75
transit. Public transit is a major user of roads and Indiana $ 62,437,577 $ 9.41
bridges. Transit operates for the benefit of Ohio’s Oregon $ 37,221,670 $ 9.11
North Carolina $ 87,843,069 $ 8.65
citizens and for assisting in the efficient operations of North Dakota $ 5,182,054 $ 6.86
our highway system. Given the high concentration of Tennessee $ 45,182,784 $ 6.80
metropolitan areas and the great needs for rural mobility Wyoming $ 3,025,405 $ 5.17
among various segments of our population, Ohio can no Iowa $ 15,751,761 $ 5.03
Kansas $ 11,000,000 $ 3.78
longer remain 41st in the nation for state assistance in
Nebraska $ 6,297,705 $ 3.30
funding transit. New Mexico $ 6,643,800 $ 3.19
Colorado $ 15,000,000 $ 2.71
Option: The legislature must identify a dedicated Oklahoma $ 5,750,000 $ 1.47
funding source that, in combination with transit West Virginia $ 2,347,569 $ 1.28
user fees and existing local funding sources, South Carolina $ 6,000,000 $ 1.21
Arkansas $ 3,492,826 $ 1.17
broadens the positive impact that transit provides South Dakota $ 1,000,000 $ 1.16
in both urban and rural areas of our state. State Texas $ 30,341,068 $ 1.09
general revenue funding for transit has been Louisiana $ 4,955,000 $ 1.06
reduced drastically since its peak in FY 2000 at New Hampshire $ 1,265,548 $ 0.95
$44 million. While even more money is needed, Maine $ 1,147,845 $ 0.86
Montana $ 675,000 $ 0.65
the state should at least restore the spending Ohio $ 7,300,000 $ 0.63
power equal to the appropriation at the beginning Mississippi $ 1,628,000 $ 0.55
of this century. Kentucky $ 1,875,297 $ 0.42
Georgia $ 3,071,913 $ 0.30
Idaho $ 312,000 $ 0.22
Conclusion Missouri
Alabama
$
$
1,045,875
0
$ 0.17
$ 0
Addressing the massive funding gap facing Ohio’s Arizona $ 0 $ 0
transportation system will require strong leadership from Hawaii $ 0 $ 0
the Governor and the General Assembly to ensure Ohio’s Nevada $ 0 $ 0
economic vitality. FOR Ohio stands ready to be part of Utah $ 0 $ 0
Totals $ 18,095,478,753
the solution.
Source: AASHTO, Survey of State Funding for Public Transportation 2018
Better Transportation for Working and Living 7Fix Our Roads Ohio Coalition
Fix Our Roads Ohio (FOR Ohio) is a coalition of stakeholders that have united in an effort to educate state leaders on the
critical needs of Ohio’s transportation infrastructure, and to advocate for a dedicated funding solution that provides long-
term, smart investment in Ohio’s transportation future.
LOCAL GOVERNMENT REGIONAL COUNCILS
Ohio Municipal League Ohio Association of Regional Councils
County Commissioners Association of Ohio Akron Metropolitan Area Transportation Study (AMATS)
County Engineers Association of Ohio Belomar Regional Council and Interstate Planning
Ohio Township Association Commission
Ohio Mayors Alliance Brooke-Hancock Jefferson Metropolitan Planning
Northeast Ohio Mayors and City Managers Association Commission
Cuyahoga County Mayors and City Managers Association Buckeye Hills Regional Council
Central Ohio Mayors and Managers Association Clark County-Springfield Transportation Coordinating
Ohio Rural Economic Development Alliance Committee
Ohio Public Transit Association Eastgate Regional Council of Governments
Erie County Regional Planning Commission
BUSINESS KYOVA Interstate Planning Commission
Cincinnati USA Regional Chamber Licking County Planning Commission; Licking County Area
Columbus Chamber of Commerce Transportation Study
Greater Cleveland Partnership Lima-Allen County Regional Planning Commission
Greater Akron Chamber of Commerce Logan-Union Champaign Regional Planning Commission
Dayton Area Chamber of Commerce Maumee Valley Planning Organization
Toledo Regional Chamber of Commerce Miami Valley Regional Planning Commission (MVRPC)
Youngstown/Warren Regional Chamber of Commerce Mid-Ohio Regional Planning Commission (MORPC)
Ohio Hotel and Lodging Association Mid-Ohio Valley Regional Council
AAA Clubs of Ohio Northeast Ohio Areawide Coordinating Agency (NOACA)
Dayton Area Logistics Association Northeast Ohio Four-County Regional Planning &
Ohio Restaurant Association Development Organization
Ohio Manufacturers’ Association Ohio Mid-Eastern Governments Association
Ohio Valley Regional Development Commission
TRANSPORTATION Ohio-Kentucky-Indiana Regional Council of Governments
American Council of Engineering Companies of Ohio (OKI)
Flexible Pavements of Ohio Richland County Regional Planning Commission
Ohio Trucking Association Stark County Regional Planning Commission
Ohio Aggregates and Industrial Minerals Association Toledo Metropolitan Area Council of Governments
Ohio Contractors Association (TMACOG)
Transportation Advocacy Group of Northwest Ohio Wood-Washington-Wirt Interstate Planning Commission
Ohio Association of Movers
Ohio Prestressers Association
For more information about Ohio’s transportation
infrastructure, visit us today at FixOurRoadsOhio.com
Better Transportation for Working and Living
JANUARY 2019You can also read