A Multiscale Assessment of Three Satellite Precipitation Products (TRMM, CMORPH, and PERSIANN) in the Three Gorges Reservoir Area in China
←
→
Page content transcription
If your browser does not render page correctly, please read the page content below
Hindawi
Advances in Meteorology
Volume 2021, Article ID 9979216, 27 pages
https://doi.org/10.1155/2021/9979216

Research Article
A Multiscale Assessment of Three Satellite Precipitation Products
(TRMM, CMORPH, and PERSIANN) in the Three Gorges
Reservoir Area in China

 Tianyu Zhang,1 Yu Yang,2 Zeyu Dong,2 and Shu Gui 2

 1
 Chongqing Climate Center, Chongqing, China
 2
 Department of Atmospheric Sciences, Yunnan University, Kunming, China

 Correspondence should be addressed to Shu Gui; guishu@ynu.edu.cn

 Received 16 March 2021; Revised 5 May 2021; Accepted 25 May 2021; Published 3 June 2021

 Academic Editor: Francisco Molero

 Copyright © 2021 Tianyu Zhang et al. This is an open access article distributed under the Creative Commons Attribution License,
 which permits unrestricted use, distribution, and reproduction in any medium, provided the original work is properly cited.
 This study evaluated three satellite precipitation products, namely, TRMM, CMORPH, and PERSIANN, over the Three Gorges
 Reservoir area in China at multiple timescales. The assessment covered the following aspects: the rainfall amount, extreme
 precipitation, and the rainy-day detection ability. Results indicated that the CMORPH and TRMM estimates of rainfall amount
 were reasonably good, but the PERSIANN showed a larger bias than the other two satellite products. The data precision of
 CMORPH was slightly better than TRMM. All three satellite products could reproduce the diurnal cycle of rainfall, i.e., more
 precipitation in the morning than in the evening. The CMORPH estimates were closest to the gauge observation at 3-hourly and
 12-hourly timescales. The data accuracy of CMORPH data was better during the night than in the daytime. At daily timescale, the
 quality of TRMM data was slightly inferior to the CMORPH, whereas the PERSIANN still differed much from the ground
 observation. At monthly, seasonally, and yearly timescales, the performance of TRMM was comparable to CMORPH, and both of
 them were obviously superior to PERSIANN. The rainy-day detection ability of CMORPH and TRMM was much better than
 PERSIANN. The PERSIANN data tended to overestimate the light rainy days but underestimate the heavy and torrential rainy
 days. The CMORPH data overestimated mainly the moderate rainy days. The TRMM data overestimated the occurrence fre-
 quency of heavy rain during the winter half year (from October to the next March). Both the CMORPH and the TRMM provided
 good estimates of the regional average rainy days. The data accuracy of CMORPH was slightly better than TRMM, and both were
 far better than the PERSIANN with respect to the rainfall amount and rainy-day detection. Nevertheless, all satellite estimates
 showed large biases of extreme precipitation. The CMORPH estimate of the maximum 5-day precipitation was the best of all. Both
 the CMORPH and TRMM data overestimated the 95th percentile of precipitation, but the PERSIANN data severely under-
 estimated it. The PERSIANN estimates of extreme precipitation amount were the best of all during the daytime, nighttime, and the
 whole day. The above evaluation results could facilitate the application of satellite rainfall products and provide a reference to
 precipitation-related studies.

1. Introduction Gorges Reservoir area. The Three Gorges Reservoir area
 covers the joint region of Sichuan Basin and the middle-
Precipitation is one of the most important hydrometeoro- lower Yangtze River Plain. It has complex terrains that
logical variables that directly affect the social economy and consist of the central Hubei canyon, the eastern Sichuan
people’s lives. It exhibits strong spatial-temporal variability paralleled ridge-valley, Dabashan Mountain, and the
and often in a nonuniform distribution. Nevertheless, southern Yichuan-Hubei Plateau [2, 3]. The large orographic
rainfall obversion is scarce in rural and remote areas, making difference between these mountain and plateau areas, as well
the estimation of local rainfall a very important yet chal- as the unbalanced economic growth, makes the distribution
lenging task [1]. This situation is quite common in the Three of weather stations uneven and heterogeneous. This makes
2 Advances in Meteorology

the application of satellite precipitation measurements far was slightly better than CMORPH in capturing the rainfall
more necessary than in other areas in China. diurnal cycle at the South China coast, but CMORPH
 The recent development of remote sensing and satellite revealed more local details than TRMM. Guo et al. [22]
technology offers more choices of satellite precipitation suggested that the diurnal cycle of rainfall in Tibet was
products in a broader range of applications than ever. At largely dependent on topography and landscape. Other
present, there are more than 30 inversion methods for the studies were conducted in a similar manner to evaluate the
satellite sounding, and more than 10 satellite rainfall esti- satellite products over Tibetan Plateau [23], Yellow River
mations (SRE) are available. The representatives of SRE Valley and high-latitude and low-latitude basins in China
datasets include the Tropical Rainfall Measuring Mission [24–27], Zhouqu in Northwest China [28], Qin-
(TRMM) Multisatellite Precipitation Analysis (TMPA) [4], ling–Dabashan Mountains [29], and Shanghai [30]. In
the Climate Prediction Center morphing technique general, most of the abovementioned studies have been
(CMORPH) product [5], the Precipitation Estimation from made to evaluate the precipitation on a daily timescale and
Remotely Sensed Information Using Artificial Neural Net- above.
works (PERSIANN) [6], and the Global Satellite Mapping of At present, the applicability of satellite products in the
Precipitation (GSMaP) [7]. In comparison with other types Three Gorges Reservoir area has yet to be studied thor-
of precipitation datasets, the satellite precipitation products oughly. Li et al. [31] suggested that most satellite products,
have a large spatial coverage with a high spatial-temporal including TRMM3B42-V7, TRMM3B42-RT, PERSIANN,
resolution, which can effectively compensate for the ground- and CMORPH, still suffered from biases to a certain degree
based weather radar and the rain-gauge observation [8]. The over the Yangtze River Basin. The TRMM-based precipi-
satellite products provide an essential way to measure global tation products gained much attention in previous studies
precipitation. However, since the satellite measures in- over Sichuan and Chongqing areas [32–34], Hubei Province
stantaneous rainfall, the records tend to overestimate or [35], the Tibetan Plateau [36], and the Three Gorges Res-
underestimate the actual rainfall amount. Thus, meteorol- ervoir area [37]. Nevertheless, these studies mainly focused
ogists often evaluate the satellite products with gauge ob- on the daily timescale and above. The precision of satellite
servation. The accuracy of satellite products varies with the data varies with the climate types, orography, observation
data source and the inversion algorithm. The precision of timescales, and inversion algorithms. On the other hand, the
satellite measurement is also affected by the regional climate unique topographic distribution of the Three Gorges Res-
types, timescales, and orography [9]. ervoir area results in large differences in orographic lifting
 Many satellite products have been assessed and inter- and remarkably different rainfall patterns within the region.
compared in different areas around the globe [10–12]. For The Dabashan Mountain and its extension to the Shen-
example, Nashwan et al. [13] reported that the Global nongjia mountain in the north of Yangtze River act together
Satellite Mapping of Precipitation (GSMaP) was best with the Wushan Mountain in the south of Yangtze River to
suitable for the daily rainfall estimation in the arid region of shield the cold air from Siberia, making the Three Gorges
Egypt. Klutse et al. [14] found that the gauge-corrected Reservoir area a warm and humid place. The entire reservoir
satellite datasets show similar estimates of summer mon- area is dominated by the humid subtropical climate. The
soon rainfall intensity and extreme precipitation over West climate of the Three Gorges Reservoir area is characterized
Africa. Other studies showed that the precipitation esti- by moderate rainfall, warm winter but hot summer, rainfall
mates exhibited distinct regional-scale patterns among with hot temperatures in the same season. The average
different subregions of the Nile river basin [15] and be- temperature of the Three Gorges Reservoir area is 17~19°C,
tween coastal and inland areas in Bangladesh [16]. The and the daily range and annual range of temperature are
performance of these satellite products was also evaluated small. The annual precipitation of the reservoir area is 1000
in China. For example, Shen et al. [17] constructed the ~1300 mm, spatially characterized by a zonal tripolar
gauge observation of precipitation on 0.25° grid spacing pattern with more rainfall at both ends but less rainfall over
and assessed the accuracy of six high-resolution satellite the central area of the riverside valley. The rainfall pattern
products over China from 2005 to 2007. Cheng et al. [18] over the Three Gorges Reservoir area is relatively complex,
assessed the CMORPH and TRMM 3B42 products with but few studies have focused on this area to reveal the re-
hourly precipitation from 2447 gauges in China during gional variation characteristics of precipitation. Thus, there
2007–2010. Liao et al. [19] evaluated the accuracy of six is an urgent need to investigate the reliability of satellite
precipitation products (TRMM 3B40RT, 3B41RT, 3B42RT, products.
CMORPH, GSMaP, HYDRO) over China on the daily This study is intended to fill this gap by evaluating three
timescale. high-resolution satellite products (TRMM, CMORPH, and
 The performance of satellite products over complex PERSIANN) with gauge-observed precipitation over the
terrain regions has gained more attention recently due to its Three Gorges Reservoir area from subdaily to yearly time-
increasing importance in rainfall forecast and alleviation of scales. The consistency and difference among the satellite
weather-related disasters. For instance, Zhu et al. [20] products in detecting extreme precipitation and rainy days
studied the diurnal rainfall variation over the contiguous in complex terrains are also discussed. The remainder of this
United States and found significant discrepancies in the paper is organized as follows. In Section 2, the source of
spatial clustering features between the TRMM data and the observation, the reanalysis data, and the methodology are
gauge observations. Chen et al. [21] reported that TRMM introduced. In Section 3, the satellite rainfall measurements
Advances in Meteorology 3

from subdaily to yearly timescales are intercompared and 2.2.2. Bias. The bias metric directly reveals the systematic
evaluated with meteorological observation. In Section 4, the errors of satellite estimates and the extent of these errors in
detection capability of rainy days is evaluated for each reference to the observation:
satellite product. In Section 5, the satellite measurements of n
 Si − Gi
extreme precipitation are evaluated. Finally, a summary and bias � × 100%, (2)
discussion are given in Section 6. i�1 ni�1 Gi

 where Si , Gi , and n denotes the same quantities as in
2. Data and Methods equation (1).
2.1. Data. The precipitation observation in the Three Gorges
Reservoir area was derived from 35 national weather stations 2.2.3. Kling-Gupta Efficiency. The Kling-Gupta efficiency
with elevation from 177.9 m to 786.9 m above sea level. There (KGE) is defined as
were 12 stations in Hubei Province and 23 stations in �����������������������
Chongqing city (Figure 1). The hourly rainfall records were KGE � 1 − (r − 1)2 +(β − 1)2 +(c − 1)2 , (3)
preprocessed into the accumulated precipitation of different
timescales (i.e., 3 hours, 12 hours, daily, monthly, seasonally, where the correlation component r was Pearson’s correla-
and yearly). The high-resolution satellite data used in this tion coefficient, the bias component β � μs /μo was the ratio
study is listed in Table 1. These satellite products were the between the estimated mean (μs ) and observed mean (μo ),
TRMM 3B42 version 7 (TRMM 3B42_V7) [4], the PER- and the variability component c � (σ s /μs )/(σ o /μo ) denoted
SIANN version 1.1 (PERSIANN-CDR) [6], and the the ratio between the estimated variation coefficients (σ s /μs )
CMORPH version 1 (CMORPH CRT) [5]. The satellite data and the observed counterpart (σ o /μo ) (σ o and σ s denoted the
was preprocessed on the same grid resolution of 0.25° × 0.25° standard deviation of observation and satellite estimates)
and the same time resolution every 3 hours. Given the [38, 39]. The perfect value for the KGE score is 1.
different time spans of these products, the longest time
period available for all satellite data is used for evaluation.
 2.2.4. Theil’s U Coefficient. Theil’s U score is defined as
Thus, all data spanned from January 1, 2001, to December 31, �������������

2016 (a total of 16 years). 2
 ni�1 Mi − Oi
 U� , (4)
 ni�1 M2i
2.2. Methods. The satellite precipitation products were
evaluated for the estimated rainfall amount, the classification where Mi presents the satellite data of the ith sample, Oi is
of rainy and rainless cases, and the distribution and per- the corresponding observation, and n is the total number
sistency of extreme precipitation. Six statistical matrices of samples. The perfect value for Theil’s U coefficient is 0
were used for the rainfall amount evaluation, namely, [40].
correlation coefficient, root-mean-square error, bias, Kling-
Gupta Efficiency index, Theil’s U coefficient, and Probability
Distribution Function. Three categorical indices were used 2.2.5. Hit Bias. The hit bias is a classification index that
to appraise the rainy and rainless cases, namely, hit bias, measures the congruency between the satellite estimates and
probability of detection, and false alarm rate. Three statistical the observation. This index is calculated as the number of
indices were used to evaluate the extreme precipitation, rainy days of satellite data divided by the number of ob-
namely, the maximum 5-day precipitation, the extreme served rainy days.
precipitation amount, and the persistent rainy days. The
definition of these indices, except the commonly known NA + NB
 HB � , (5)
ones, is provided herein. NA + NC
 where HB is the hit bias, NA is the number of rainy days in
2.2.1. RMSE. The root-mean-square error (RMSE) is both the observation and the satellite estimates, NB is the
calculated as the square root of the average squared number of rainy days only in the satellite estimates, and the
difference between the satellite estimates and the observed NC is the number of rainy days only in the observation. The
value: ideal value for HB is 1.
 ��������������
 2
 ni�1 Si − Gi (1)
 RMSE � , 2.2.6. Probability of Detection. The probability of detection
 n (POD) reflects the accuracy of satellite estimates. It is cal-
where Si denotes the satellite rainfall estimates, Gi represents culated as the ratio between the number of rainy days in both
the observed precipitation, and n denotes the number of the observation and the satellite estimates and the total
time points for evaluation. number of rainy days in the observation.
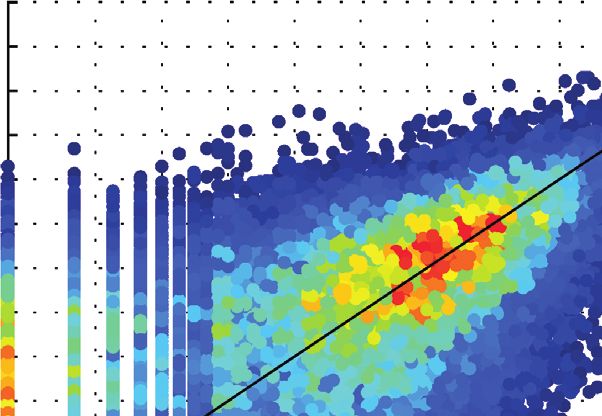
4 Advances in Meteorology

 NA the observation regarding the location and magnitude of the
 POD � , (6) rainfall maximum and minimum. The PERSIANN estimates
 NA + NC
 of rainfall amount were smaller than the observation. In
where the NA and NC have the same meaning as in equation addition, the spatial pattern of PERSIANN rainfall differed
(5). The ideal value for POD is 1. from the observation, with an obvious shift of the maximum
 center and its spatial coverage.
2.2.7. False Alarm Rate. The false alarm rate (FAR) reflects
the false rate in the satellite detection of rainfall. It is cal-
 3.1.1. 3-Hourly Timescale. The gauge-observed precipitation
culated as the ratio between the number of rainy days only in
 displayed large diurnal variabilities over the southern reser-
the satellite estimates and the total number of rainy days in
 voir area, with the maximum standard deviation over 6 mm/
the satellite estimates.
 day (Figure 2(e)). The diurnal variabilities were a bit smaller in
 NB the northern and western parts of the area. Both CMORPH
 FAR � , (7)
 NA + NB and TRMM could reproduce this spatial pattern to a large
 extent (Figures 2(f) and 2(g)). Nevertheless, the TRMM data
where NA and NB have the same meaning as in equation (5).
 overestimated the standard deviation for approximately
The ideal value for FAR is 0.
 1 mm/day. The PERSIANN underestimated the diurnal
 variability over the entire reservoir area (Figure 2(h)).
2.2.8. Metrics for Rainy Days and Extreme Precipitation The mean precipitation rate was heavier during the first
 (a) Effective rainy days: the rainfall threshold for each 12 hours of a day (0–12) than the rest (12–24) (Figure 3). This
 rainy day was set to 1 mm/day [41, 42]. implied a “more in the morning but less in the evening”
 feature of the rainfall diurnal cycle. The diurnal variation of
 (b) Classification of rainy days for different precipitation
 precipitation could be related to the mountain-plains so-
 magnitudes: according to the operation regulation of
 lenoid (MPS) circulation [20, 48]. The rainfall peak was most
 the China Meteorological Administration, the
 likely to appear around the 3rd- to 9th-hour interval. The
 rainfall intensity was classified as follows:
 mean standard deviations of observed precipitation ranged
 Light rain: 0.1∼9.9 mm/day from 3.8 mm/day to 5.6 mm/day during the research period.
 Moderate rain: 10.0∼24.9 mm/day All three satellite estimates presented a rainfall diurnal cycle
 Heavy rain: 25.0∼49.9 mm/day similar to the observation. The CMORPH best reproduced
 Rainstorm and above: ≥50 mm/day the observed variation pattern with respect to the rainfall
 amount and its standard deviation. The TRMM presented a
 (c) The 3 indices in Table 2 were adopted from the 27
 similar diurnal variation, but it tended to overestimate the
 indices of extreme weather events proposed by the
 diurnal variability for about 1 mm/day. The PERSIANN
 World Meteorological Organization (WMO)
 obviously underestimated the overall rainfall amount and its
 [43, 44].
 standard deviation (more than 2 mm/day in most years). In
 general, the CMORPH estimate of the rainfall diurnal cycle
2.2.9. Kriging Interpolation. The Kriging interpolation was the best, followed by TRMM and then PERSIANN.
method is a popular geostatistical technique in groundwater The relative bias of each satellite dataset is given in
modeling and spatial mapping. It uses a variogram to de- Figure 4. In spring, the CMORPH showed the smallest
termine the spatial variation on the surface and minimize the bias, fluctuating around 0 throughout the day
prediction error at unmeasured locations. In comparison to (Figure 4(a)). The TRMM estimate was positively biased
other interpolation methods such as the inverse distance during the first 12 hours of a day, but negatively biased for
weighted method and spline interpolation, the Kriging the rest of a day. The positive bias reached its peak during
method maximizes the utilization of the observed spatial the 3rd–6th hour period, whereas the negative bias reached
information and thus makes a more precise estimate at its peak during the 12th–18th hour period. Although the
uncharted locations [45, 46]. Given the above reason, we TRMM estimate was more biased than the CMORPH, it
adopted the Kriging method to interpolate the satellite data was still better than the PERSIANN. In comparison to the
onto the location of each meteorological station and then observation, the PERSIANN underestimated the rainfall
accumulated the precipitation amount at 3-hourly, 12- amount throughout the whole day. All satellite biases
hourly, daily, monthly, seasonally, and yearly timescales. showed a decreasing trend in the morning and an in-
 creasing trend in the evening. In summer, the CMORPH
3. Results and Discussion bias was still the smallest among all satellite datasets
 during the first 15 hours of a day (Figure 4(b)). The
3.1. Multitimescale Assessment of Precipitation. The precip- CMORPH bias reached its peak during the 12th–15th hour
itation climatology consisted of two local maxima, one over period, and it remained positive for the rest of a day. The
the south and the other over the north (Figure 2). This spatial TRMM bias consisted of two positive peaks around the
pattern was consistent with previous studies with respect to 3rd–6th hours and 12th–15th hours. The TRMM bias was
the location of maximum and minimum centers [37, 47]. larger than the CMORPH until the 18th hour, when the
Both the TRMM and the CMORPH estimates were close to two satellite estimates had a similar bias rate. Since then,
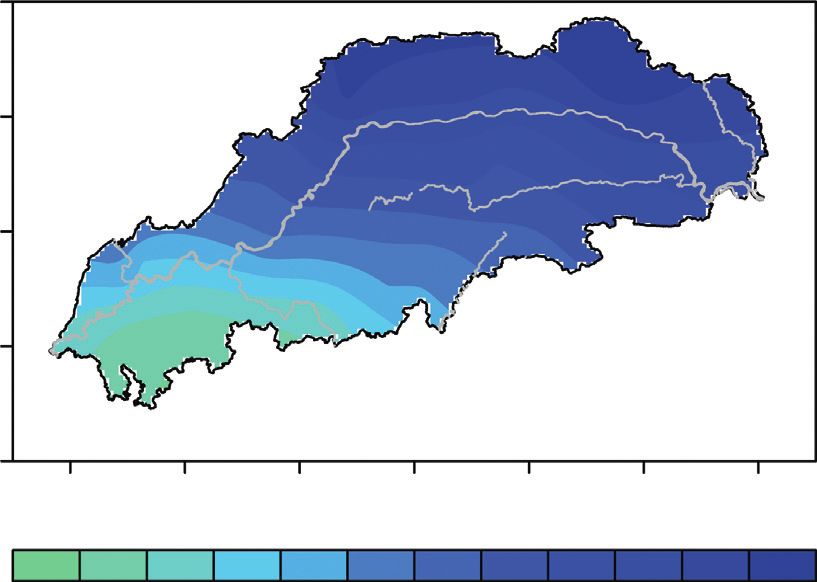
Advances in Meteorology 5

 32°45′ N

 32°30′ W E
 32°15′ S
 32°

 31°45′

 31°30′

 31°15′

 31°

 30°45′

 30°30′

 30°15′

 30°

 29°45′

 29°30′

 29°15′

 29°

 28°45′

 28°30′

 28°15′
 0 900 1,800 3,600 5,400 7,200
 28° Km

 106° 106°30′ 107° 107°30′ 108° 108°30′ 109° 109°30′ 110° 110°30′ 111° 111°30′ 112°
 Meteorological station DEM
 River 2854.18 m
 The boundary of Three Gorges Reservoir area
 34 m
 The boundary between Chongqing and Hubei Province
 Figure 1: Distribution of national meteorological stations in the Three Gorges Reservoir area.

 Table 1: Summary of the three satellite products.
Satellite products Source Inversion algorithm Time resolution (h) Spatial resolution
TRMM 3B42_V7 NASA TMPA 3 0.25° × 0.25°
PERSIANN-CDR NOAA CPC cloud moving vector morphing 3 0.25° × 0.25°
CMORPH V1.0 NOAA ANN 3 0.25° × 0.25°

 Table 2: The indices for extreme precipitation.
Index Abbreviation Definition Units
The maximum 5-day
 RX5day The maximum accumulated rainfall for consecutive 5 days in a year mm
precipitation
The extreme precipitation The precipitation amount above the 95th percentile of daily precipitation in a
 R95 mm
amount year
Persistent rainy days CWD The longest period with more than 1 mm rainfall per day day

the TRMM data had been negatively biased. The PER- within 20% (Figure 4(c)). The TRMM bias was larger than
SIANN estimate was still remarkably lower than the the CMORPH during the 15th–21st hours. The PERSIANN
observation throughout the day. In autumn, the estimate was remarkably lower than the observation for
CMORPH estimate was still the best, with the bias range about 60%. In winter, both the CMORPH and the
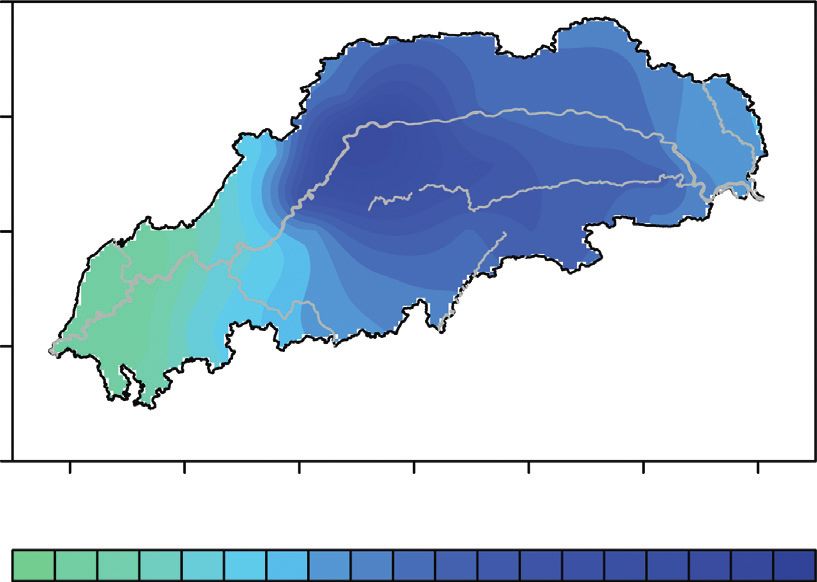
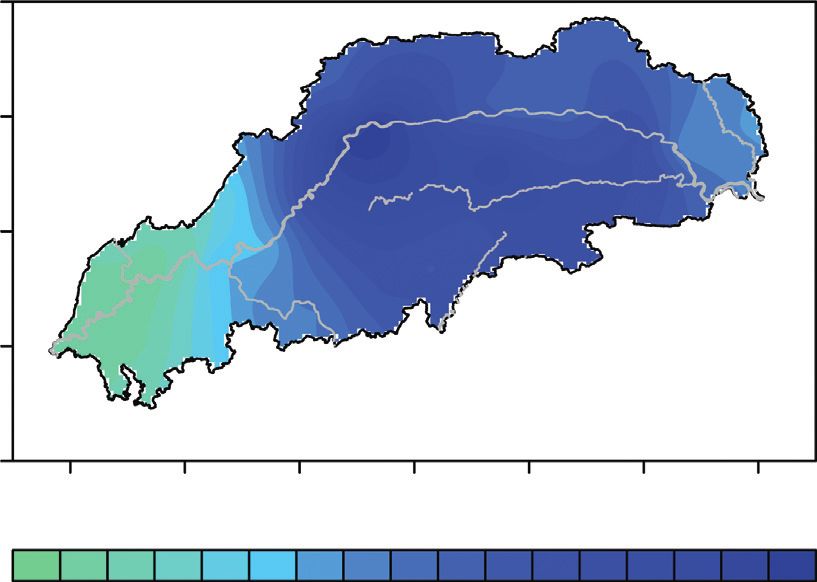
6 Advances in Meteorology

 32N 32N

 3 3.6 3
 2.7

 3.2
 3.3
 31N 31N
 3.6

 3.4
 3.9
 30N 30N 3.6

 3.3

 3.2
 3

 3

 3.4
 3
 29N 29N

 28N 28N
 106E 107E 108E 109E 110E 111E 112E 106E 107E 108E 109E 110E 111E 112E
 (a) (b)
 32N 32N

 2.8
 1.9

 1.9
 31N 31N 1.8
 3.4 3
 3.2

 1.8
 30N 3.2 30N
 3
 2.8

 2.8

 1.9 1.7
 29N 29N

 28N 28N
 106E 107E 108E 109E 110E 111E 112E 106E 107E 108E 109E 110E 111E 112E
 (c) (d)
 32N 32N
 5 6
 4.5

 31N 31N 6.5 6.5 6

 6 5
 30N 30N 7
 5.5
 5

 6

 6.5
 5

 29N 29N

 28N 28N
 106E 107E 108E 109E 110E 111E 112E 106E 107E 108E 109E 110E 111E 112E
 (e) (f )
 32N 32N
 4.5
 5.5

 31N 5.5 31N 3
 3.2

 5
 3

 5
 5
 30N 6 30N
 3.2

 5 2.8
 5 5.5
 29N 29N

 28N 28N
 106E 107E 108E 109E 110E 111E 112E 106E 107E 108E 109E 110E 111E 112E
 (g) (h)

Figure 2: The spatial distribution of annual mean precipitation (contour units: mm/day) and the mean standard deviation of 3-hourly
precipitation rate (contour units: mm/day) for (a, e) gauge observation, (b, f ) TRMM, (c, g) CMORPH, and (d, h) PERSIANN.
Advances in Meteorology 7

 s.d. = 3.8 s.d. = 3.7 s.d. = 5.3 s.d. = 5.7 s.d. = 5.4 s.d. = 5.1 s.d. = 4.9 s.d. = 5.2
 Precip. (mm/day)

 Precip. (mm/day)

 Precip. (mm/day)

 Precip. (mm/day)
 5 5 5
 3 s.d. = 4.6 s.d. = 2.8 s.d. = 7.1 s.d. = 4.2 s.d. = 6.5 s.d. = 3.0 s.d. = 6.3 s.d. = 3.1
 4 4 4
 2 3 3 3
 2 2 2
 1 1 1 1
 3 6 9 12 15 18 21 24 3 6 9 12 15 18 21 24 3 6 9 12 15 18 21 24 3 6 9 12 15 18 21 24
 Hour Hour Hour Hour
 CMORPH TRMM CMORPH TRMM CMORPH TRMM CMORPH TRMM
 PERSIANN Obs. PERSIANN Obs. PERSIANN Obs. PERSIANN Obs.
 (a) (b) (c) (d)

 s.d. = 4.7 s.d. = 5.0 s.d. = 4.1 s.d. = 4.4 s.d. = 5.3 s.d. = 5.4 5 s.d. = 4.9 s.d. = 4.9
 Precip. (mm/day)

 Precip. (mm/day)

 Precip. (mm/day)

 Precip. (mm/day)
 4 4 5
 s.d. = 6.0 s.d. = 2.4 s.d. = 5.3 s.d. = 2.8 s.d. = 6.5 s.d. = 3.9 4 s.d. = 6.5 s.d. = 2.0
 3 3 4
 3 3
 2 2 2
 2
 1 1 1 1
 3 6 9 12 15 18 21 24 3 6 9 12 15 18 21 24 3 6 9 12 15 18 21 24 3 6 9 12 15 18 21 24
 Hour Hour Hour Hour
 CMORPH TRMM CMORPH TRMM CMORPH TRMM CMORPH TRMM
 PERSIANN Obs. PERSIANN Obs. PERSIANN Obs. PERSIANN Obs.
 (e) (f) (g) (h)

 s.d. = 4.5 s.d. = 5.0
 5 s.d. = 4.6 s.d. = 5.0 s.d. = 4.5 s.d. = 4.3 5 s.d. = 4.5 s.d. = 4.9
 Precip. (mm/day)

 Precip. (mm/day)

 Precip. (mm/day)

 Precip. (mm/day)
 5
 s.d. = 5.7 s.d. = 2.3 4 s.d. = 6.3 s.d. = 2.8 4 s.d. = 5.2 s.d. = 2.1 s.d. = 5.9 s.d. = 2.1
 4 4
 3 3 3
 3
 2 2 2 2
 1 1 1 1
 3 6 9 12 15 18 21 24 3 6 9 12 15 18 21 24 3 6 9 12 15 18 21 24 3 6 9 12 15 18 21 24
 Hour Hour Hour Hour
 CMORPH TRMM CMORPH TRMM CMORPH TRMM CMORPH TRMM
 PERSIANN Obs. PERSIANN Obs. PERSIANN Obs. PERSIANN Obs.
 (i) (j) (k) (l)

 6
 s.d. = 4.7 s.d. = 4.7 6 s.d. = 5.0 s.d. = 5.0 s.d. = 5.2 s.d. = 5.0 s.d. = 5.6 s.d. = 5.7
 Precip. (mm/day)

 Precip. (mm/day)

 Precip. (mm/day)

 Precip. (mm/day)
 4 5 5
 s.d. = 5.6 s.d. = 2.7 5 s.d. = 6.4 s.d. = 2.5 s.d. = 5.9 s.d. = 2.8 s.d. = 6.6 s.d. = 3.6
 4 4
 3 4
 3 3 3
 2 2
 2 2
 1 1 1 1
 3 6 9 12 15 18 21 24 3 6 9 12 15 18 21 24 3 6 9 12 15 18 21 24 3 6 9 12 15 18 21 24
 Hour Hour Hour Hour
 CMORPH TRMM CMORPH TRMM CMORPH TRMM CMORPH TRMM
 PERSIANN Obs. PERSIANN Obs. PERSIANN Obs. PERSIANN Obs.
 (m) (n) (o) (p)

Figure 3: The annual mean 3-hourly precipitation rate over the Three Gorges Reservoir area from the observation and the satellite
estimates during the period 2001–2016 (units: mm/hour). The mean standard deviations (s.d.) of diurnal anomalies were annotated on
each subplot.

PERSIANN underestimated the rainfall amount for an TRMM bias covered a broader range than the CMORPH,
average of 25%, whereas the TRMM conspicuously suggesting a higher discreteness of the estimate errors. The
overestimated the precipitation during the 3rd–6th hours median of TRMM bias was around 80%, less than that of
(Figure 4(d)). CMORPH. It implied that the TRMM still suffered from an
 The bias distribution in each season was shown in the overestimation of spring rainfall but to a lesser degree
box plot (Figure 5). All three satellite datasets showed a compared to the CMORPH. The PERSIANN bias was even
broad range of biases and diverse distribution of the median more spread out than the TRMM, but its median was close to
in four seasons. In spring, the CMORPH bias was mainly 0. Since the rainfall amount was generally underestimated in
positive with the median value over 100% (Figure 5(a)). This the PERSIANN, this small median suggested that the un-
bias rate was higher than those of the TRMM and PER- derestimation of rainfall was offset by the overestimation of
SIANN, suggesting that the CMORPH suffered from an rainfall in some areas with small rainfall amounts. In
overall overestimation of the spring precipitation. The summer, the bias distribution and the median value of
8 Advances in Meteorology

 40 20

 20

 0
 0
 Bias (%)

 Bias (%)
 –20
 –20

 –40

 –60 –40

 –80
 3 6 9 12 15 18 21 24 3 6 9 12 15 18 21 24
 Hour Hour
 CMORPH CMORPH
 PERSIANN PERSIANN
 TRMM TRMM
 (a) (b)

 40
 0

 20

 –20
 0
 Bias (%)

 Bias (%)

 –20
 –40

 –40

 –60
 –60

 –80
 3 6 9 12 15 18 21 24 3 6 9 12 15 18 21 24
 Hour Hour
 CMORPH CMORPH
 PERSIANN PERSIANN
 TRMM TRMM
 (c) (d)

Figure 4: The average bias rate of each satellite dataset over the Three Gorges Reservoir area in (a) spring, (b) summer, (c) autumn, and
(d) winter.

CMORPH and TRMM resembled each other (Figure 5(b)). rainfall amount. In winter, all satellite biases exhibited the
Both of them overestimated the precipitation in most parts largest range throughout the year (Figure 5(d)). The bias
of the Three Gorges Reservoir area. The PERSIANN still median of TRMM and PERSIANN resembled their coun-
showed the largest percentile range with the median value terpart in autumn, but the bias median of CMORPH was
close to 0. In autumn, all three satellite estimates exhibited a much larger than in autumn (close to 100%). This indicated
more diverse bias distribution than in summer (Figure 5(c)). that the TRMM and PERSIANN were still inclined to un-
The median of TRMM bias was closest to 0, suggesting a derestimate the rainfall amount, whereas the CMORPH
balanced distribution of positive and negative biases over the suffered from an overall overestimation of rainfall amount in
research area. Likewise, the median of CMORPH bias was winter.
about 10%. The PERSIANN bias had the lowest median of all In all four seasons, the bias range was the smallest in
satellite datasets, which implied a severe underestimation of summer but the largest in winter. Nevertheless, the Three
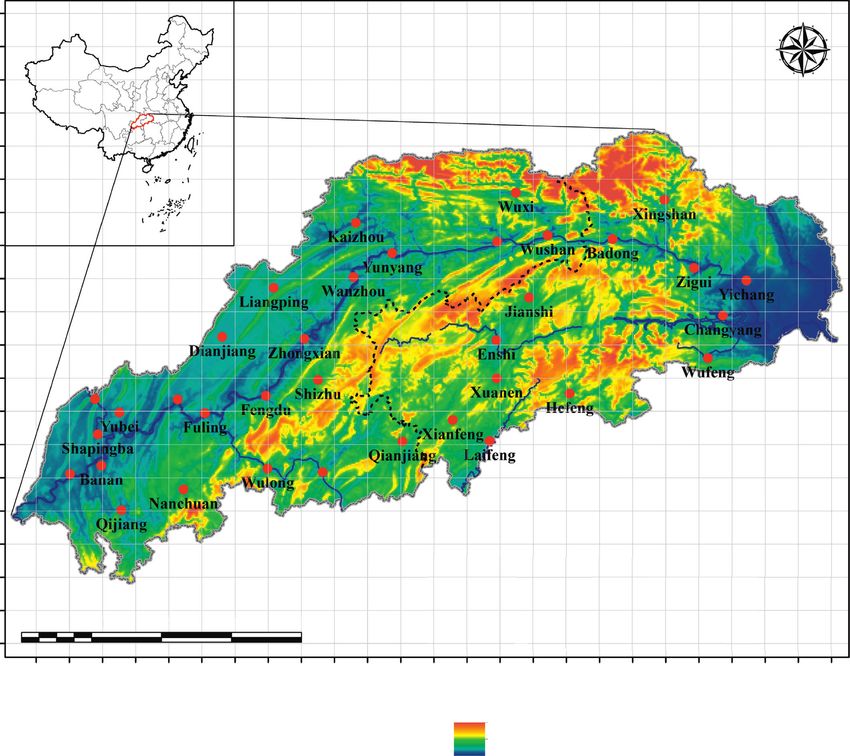
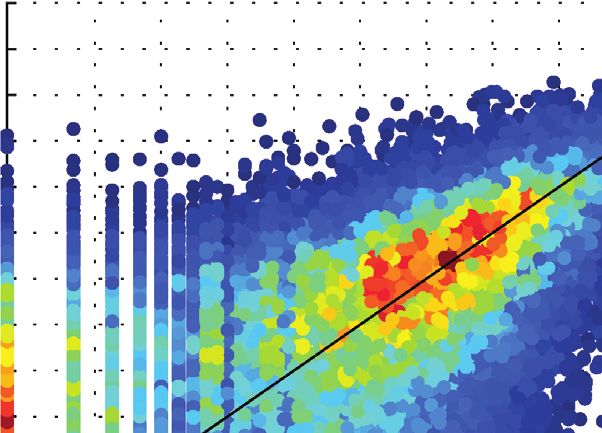
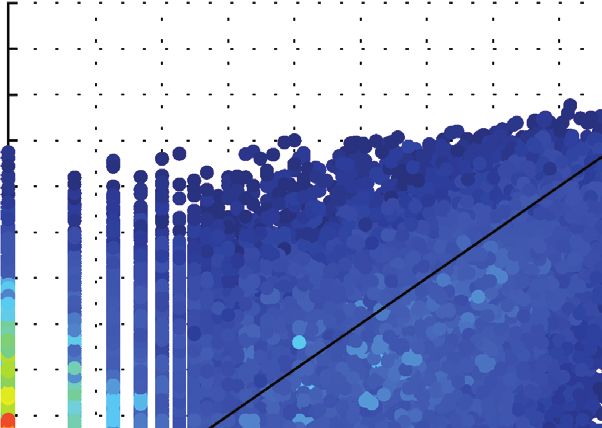
Advances in Meteorology 9

 200 200

 100 100
 Bias (%)

 Bias (%)
 0 0

 –100 –100
 CMORPH TRMM PERSIANN CMORPH TRMM PERSIANN
 (a) (b)

 200 200

 100 100
 Bias (%)

 Bias (%)

 0 0

 –100 –100
 CMORPH TRMM PERSIANN CMORPH TRMM PERSIANN
 (c) (d)

Figure 5: The bias distribution of each satellite dataset over the Three Gorges Reservoir area in (a) spring, (b) summer, (c) autumn, and (d)
winter. The upper and lower boundary of each box represented the 25th and 75th percentiles of the samples, the circle with a black dot inside
denoted the median in each bar, and the bias rate was confined within 300% for clarity.

Gorges Reservoir area experienced most of its rainfall in 2.90, and the average bias rate was 2.07% (Table 3). The
summer and the winter was its dry season. Thus, the scarcer distribution of TRMM estimates was similar to the
precipitation came with higher discreteness of estimate CMORPH, but the bias between 4 mm and 16 mm was larger
errors. Among all satellite datasets, the PERSIANN estimates than that of the CMORPH. The correlation coefficient be-
had the highest discreteness of errors. The biases of TRMM tween the TRMM estimates and the rainfall observation was
and CMORPH were distributed within a similar range. 0.81, the root-mean-square error was 3.04, and the bias rate
Given the large positive median of CMORPH, this satellite was 6.79%. In comparison to the CMORPH, the accuracy of
dataset was inclined to overestimate the rainfall. Likewise, TRMM was slightly inferior. The PERSIANN estimates
the TRMM also tended to overestimate the precipitation in missed a high-frequency appearance around the 1 : 1 line.
spring and summer. Conversely, the PERSIANN tended to The correlation coefficient between the PERSIANN esti-
underestimate the rainfall in autumn and winter even more mates and the rainfall observation was 0.54, the root-mean-
than in spring and summer. square error was 4.66, and the bias rate was -35.20%. Judging
 from these three metrics, the CMORPH estimate was the
 best of all.
3.1.2. 12-Hourly Timescale. The 12-hourly precipitation The distribution of nocturnal precipitation was similar to
could reflect the accuracy of satellite estimates during the that at daytime (Figure 7). The CMORPH still presented the
daytime and the nighttime. At daytime, the CMORPH es- highest frequency appearance around the 1 : 1 line between
timate was closest to observation among all satellite datasets 4 mm and 32 mm. The evaluation metrics of the CMORPH
(Figure 6). The precipitation amount between 4 mm and were as follows: correlation coefficient of 0.82, root-mean-
32 mm was distributed most frequently around the 1 : 1 line. square error of 3.55, and the bias rate of −0.34% (Table 4). In
The correlation coefficient between the CMORPH and the comparison to the daytime precipitation, the correlation
gauge observation was 0.81, the root-mean-square error was coefficient of nocturnal precipitation was higher and the bias
10 Advances in Meteorology

 512 95 512 95

 Precipitation rate from CMORPH (mm)
 Precipitation rate from TRMM (mm)
 256 85 256 85
 128 128
 75 75
 64 64
 32 65 32 65
 16 55 16 55
 8 8
 45 45
 4 4
 2 35 2 35
 1 25 1 25
 0.5 0.5
 15 15
 0.25 0.25
 5 5
 0.1 0.1
 0.1 0.25 0.5 1 2 4 8 16 32 64 128 256 512 0.1 0.25 0.5 1 2 4 8 16 32 64 128 256 512
 Precipitation rate from gauge (mm) Precipitation rate from gauge (mm)

 (a) (b)
 512 95
 Precipitation rate from PERSIANN (mm)

 256 85
 128
 75
 64
 32 65
 16 55
 8
 45
 4
 2 35
 1 25
 0.5 15
 0.25
 5
 0.1
 0.1 0.25 0.5 1 2 4 8 16 32 64 128 256 512
 Precipitation rate from gauge (mm)

 (c)

Figure 6: Scatter plot of the observed precipitation and (a) the TRMM, (b) the CMORPH, and (c) the PERSIANN estimates over the Three
Gorges Reservoir area in the daytime. Since the minimum scale of a rainfall gauge was 0.1 mm, the observed precipitation less than 1 mm was
displayed as discrete points on the scatter plot.

rate was lower, but the root-mean-square error increased a of PERSIANN gradually decreased to below 50%. This indi-
little bit. The TRMM estimates at nighttime appeared less cated that the congruency of TRMM and CMORPH was much
frequently around the 1 : 1 line compared to the daytime higher than that of PERSIANN. The probability of detection in
counterpart. The correlation coefficient of the TRMM de- the CMORPH and TRMM data was close to each other at
creased to 0.79, the root-mean-square error increased to daytime. Both of them showed a downward trend as the rain
3.75, and the bias rate increased to −9.39%. All these metrics rate increased. At nighttime, the probability of detection in the
suggested that the TRMM estimates were worse at nighttime CMORPH was a little bit higher than the TRMM counterpart.
than at daytime. The PERSIANN still lacked a high-fre- However, the probability of detection in the PERSIANN was
quency appearance around 1 : 1 line at nighttime. The cor- much lower than the other two satellite products. This implied
relation coefficient of the PERSIANN increased to 0.57, but that the PERSIANN not only underestimated the rainfall but
the root-mean-square error increased to 5.58 and the bias also missed many rainy days. Among all satellite datasets, the
rate increased to −36.49%. The above results suggested that false alarm rate of CMORPH was the lowest and the false alarm
the CMORPH maintained its accuracy throughout the day, rate of PERSIANN was the highest. As the rain rate increased,
but somehow the precision of TRMM and PERSIANN es- the false alarm rate in each satellite product also increased. Note
timates degraded a little during the nighttime. that the difference in the false alarm rate between the daytime
 To quantitatively assess the estimate errors, we calculated and nighttime was small.
the hit bias (HB), probability of detection (POD), and the false
alarm rate (FAR), respectively, with the precipitation at day-
time and nighttime (Figure 8). Since the precipitation amount 3.1.3. Daily Timescale. The daily precipitation showed a
mostly ranged from 1 mm/day to 60 mm/day, we only con- similar pattern on the scatter plot as the nocturnal and
sidered the rainfall events within this range. The deviation rate daytime precipitation (figure omitted). Both CMORPH and
was about 1 for both TRMM and CMORPH during the TRMM had a higher KGE score than PERSIANN
daytime and nighttime. As the rain rate increased, the hit bias (Figures 9(a)–9(c)). The highest KGE score of TRMM
Advances in Meteorology 11

 Table 3: The evaluation metrics of each satellite dataset in daytime.
 CC RMSE BIAS (%)
 CMORPH TRMM PERSIANN CMORPH TRMM PERSIANN CMORPH TRMM PERSIANN
Spring 0.81 0.78 0.48 2.57 2.90 4.56 −5.31 5.05 −49.04
Summer 0.82 0.84 0.57 3.24 3.10 5.05 7.77 4.17 −22.97
Autumn 0.77 0.75 0.43 2.98 3.39 4.98 1.31 15.56 −48.73
Winter 0.50 0.44 0.22 1.51 1.71 1.39 −18.41 −3.70 −29.25
Overall 0.81 0.81 0.54 2.90 3.04 4.66 2.07 6.79 −35.20

 512 95 512 95

 Precipitation rate from CMORPH (mm)
 Precipitation rate from TRMM (mm)

 256 85 256 85
 128 128
 75 75
 64 64
 32 65 32 65
 16 55 16 55
 8 8
 45 45
 4 4
 2 35 2 35
 1 25 1 25
 0.5 0.5
 15 15
 0.25 0.25
 5 5
 0.1 0.1
 0.1 0.25 0.5 1 2 4 8 16 32 64 128 256 512 0.1 0.25 0.5 1 2 4 8 16 32 64 128 256 512
 Precipitation rate from gauge (mm) Precipitation rate from gauge (mm)

 (a) (b)
 512 95
 Precipitation rate from PERSIANN (mm)

 256 85
 128
 75
 64
 32 65
 16 55
 8
 45
 4
 2 35
 1 25
 0.5
 15
 0.25
 5
 0.1
 0.1 0.25 0.5 1 2 4 8 16 32 64 128 256 512
 Precipitation rate from gauge (mm)

 (c)

Figure 7: Scatter plot of the observed precipitation and (a) the TRMM, (b) the CMORPH, and (c) the PERSIANN estimates over the Three
Gorges Reservoir area in the nighttime. Since the minimum scale of a rainfall gauge was 0.1 mm, the observed precipitation less than 1 mm
was displayed as discrete points on the scatter plot.

 Table 4: The evaluation metrics of each satellite dataset in nighttime.
 CC RMSE BIAS (%)
 CMORPH TRMM PERSIANN CMORPH TRMM PERSIANN CMORPH TRMM PERSIANN
Spring 0.85 0.80 0.61 3.21 3.69 5.23 5.61 −3.39 −29.66
Summer 0.80 0.79 0.51 3.97 3.94 6.35 −5.43 −13.96 −35.31
Autumn 0.83 0.78 0.65 3.73 3.97 5.92 0.10 −10.78 −50.95
Winter 0.64 0.63 0.26 2.24 2.15 2.37 2.59 −0.62 −27.69
Overall 0.82 0.79 0.57 3.55 3.75 5.58 −0.34 −9.39 −36.49

appeared around the northern mainstream region, whereas KGE score of PERSIANN was less than 0.4 in most parts of
the lowest KGE score was distributed over the western the reservoir area. The average KGE score over the Three
reservoir area. The KGE score of CMORPH was a bit higher Gorges Reservoir area was 0.67 for TRMM, 0.69 for
than TRMM over the entire reservoir area. Nevertheless, the CMORPH, and 0.33 for PERSIANN. Judging from Theil’s U
12 Advances in Meteorology

 HB (%) POD (%) FAR (%)

 100 60 80
 Nighttime

 Nighttime

 Nighttime
 60
 40
 50 40
 20
 20

 0 0 0
 1 10 20 30 40 50 60 1 10 20 30 40 50 60 1 10 20 30 40 50 60
 Rain rate (mm/day) Rain rate (mm/day) Rain rate (mm/day)
 CMORPH CMORPH CMORPH
 PERSIANN PERSIANN PERSIANN
 TRMM TRMM TRMM
 (a) (b) (c)
 HB (%) POD (%) FAR (%)
 100
 60
 100
 Daytime

 Daytime

 Daytime
 40
 50
 50
 20

 0 0 0
 1 10 20 30 40 50 60 1 10 20 30 40 50 60 1 10 20 30 40 50 60
 Rain rate (mm/day) Rain rate (mm/day) Rain rate (mm/day)
 CMORPH CMORPH CMORPH
 PERSIANN PERSIANN PERSIANN
 TRMM TRMM TRMM
 (d) (e) (f )

Figure 8: (a) The hit bias, (b) the probability of detection, and (c) the false alarm rate of each satellite product at nighttime. (d) The hit bias,
(e) the probability of detection, and (f ) the false alarm rate of each satellite product at daytime.

score, the performance of CMORPH was generally the best well, but it obviously underestimated the PDF of light rain. In
of all, followed by TRMM and then PERSIANN contrast, the PERSIANN overestimated the light rain events
(Figures 9(d)–9(f )). Given the spatial patterns of Theil’s U but underestimated the PDF of moderate rainfall and above.
and KGE scores, the CMORPH estimates best represented The CMORPH showed the best performance in the PDF of
the precipitation over the northern mainstream and central precipitation among all satellite products.
southern edge of the reservoir area. The mean Theil’s U score The performance of satellite products could be sum-
was 0.75 for TRMM, 0.72 for CMORPH, and 1.34 for marized with the Taylor diagram (Figure 11). Both TRMM
PERSIANN. The above results indicated that both TRMM and CMORPH presented a relatively good performance in
and CMORPH could capture the temporal variability and reproducing the rainfall of different intensities. These two
the average intensity of daily rainfall in the Three Gorges satellite products showed the highest correlation (over 0.6)
Reservoir area. for the light rain, the smallest root-mean-square deviation
 The PDF of observed rainless cases is about 60% over the (RMSD) (about 1.1), and the standard deviation closest to 1
research area (Figure 10). Both CMORPH and PERSIANN for the heavy rain. In contrast, the PERSIANN showed a
showed a similar PDF for no-rain cases, whereas the TRMM poor conformity with the observation. The above results
tended to overestimate the frequency of no-rain events by a few suggested that TRMM and CMORPH were better than
percent. This indicated that the TRMM estimates missed some PERSIANN over the Three Gorges Reservoir area.
rainy cases. The capability of rainfall detection differed among The hit bias, probability of detection, and the false alarm
the satellite products. For example, the TRMM could repro- rate on a daily timescale resembled the 12-hourly coun-
duce the PDF of moderate-to-heavy rainfall events reasonably terpart (Figure 12). The hit bias of CMORPH and TRMM
Advances in Meteorology 13

 32N 32N 32N

 31N 31N 31N

 30N 30N 30N

 29N 29N 29N

 28N 28N 28N
 106E 107E 108E 109E 110E 111E 112E 106E 107E 108E 109E 110E 111E 112E 106E 107E 108E 109E 110E 111E 112E

 ≤0.4 0.6~0.7 ≤0.4 0.6~0.7 ≤0.4 0.6~0.7
 0.4~0.5 0.7~0.8 0.4~0.5 0.7~0.8 0.4~0.5 0.7~0.8
 0.5~0.6 ≥0.8 0.5~0.6 ≥0.8 0.5~0.6 ≥0.8

 (a) (b) (c)
 32N 32N 32N

 31N 31N 31N

 30N 30N 30N

 29N 29N 29N

 28N 28N 28N
 106E 107E 108E 109E 110E 111E 112E 106E 107E 108E 109E 110E 111E 112E 106E 107E 108E 109E 110E 111E 112E

 ≤0.7 0.9~1.0 ≤0.7 0.9~1.0 ≤0.7 0.9~1.0
 0.7~0.8 1.0~1.1 0.7~0.8 1.0~1.1 0.7~0.8 1.0~1.1
 0.8~0.9 ≥1.1 0.8~0.9 ≥1.1 0.8~0.9 ≥1.1

 (d) (e) (f )

Figure 9: The KGE scores at each gauge station for (a) TRMM, (b) CMORPH, and (c) PERSIANN during the period 2001–2016. Theil’s U
score at each gauge station for (d) TRMM, (e) CMORPH, and (f ) PERSIANN during the period 2001–2016.

 70 14
 60 12
 50 10
 PDF (%)

 PDF (%)

 40 8
 30 6
 20 4
 10 2
 0
 Obs. TRMM CMORPH PERSIANN 0
 0 1 2 3 4 6 8 10 15 20 25 30 35 40 50 60
 Daily precipitation (mm)
 Obs. CMORPH
 TRMM PERSIANN
 (a) (b)

Figure 10: Probability density function of daily precipitation for (a) no-rain and (b) precipitation of different intensities derived from
observation and satellite estimates.

remained around 100% for the rain rates from 1 mm/day to of the time, the correlation coefficient of TRMM was the
60 mm/day. As the precipitation rate increased to 60 mm/ highest (>0.5) and the correlation coefficient of PERSIANN
day, the probability of detection decreased by around 18% was the lowest (
14 Advances in Meteorology

 0.1 0.2 0.3 0.1 0.2 0.3
 1.8 0.4 3 0.4
 0.5 0.5

 Co

 Co
 rr

 rr
 0.6 0.6

 ela

 ela
 1.5 1.4 2.5

 t

 t
 io

 io
 0.7 2.2 0.7

 n

 n
 co

 co
 1.2

 effi

 effi
 Standard deviation

 Standard deviation
 cie

 cie
 1.2 0.8 2 1.8 0.8

 nt

 nt
 1
 0.9 0.8 1.5 1.4
 0.9 0.9
 0.6 1
 0.6 0.95 1 0.95

 RM
 0.4 0.6

 RM

 SD
 0.3 0.2 0.99 0.5 0.99

 SD
 0.2
 Obs. Obs.
 0 0
 Standard deviation Standard deviation
 TRMM TRMM
 CMORPH CMORPH
 PERSIANN PERSIANN
 (a) (b)
 0.1 0.2 0.3
 1.8 0.4
 0.5
 Co
 0.6 rr
 1.5 1.4 ela
 0.7 tio
 n
 1.2 co
 e ffi
 Standard deviation

 1.2
 cie
 0.8
 1 nt
 0.9 0.8 0.9
 0.6
 0.6 0.95
 0.4
 RM

 0.3 0.2 0.99
 SD

 Obs.
 0
 Standard deviation
 TRMM
 CMORPH
 PERSIANN
 (c)

Figure 11: Taylor diagrams for the satellite estimates of (a) light rainfall, (b) moderate rainfall, and (c) heavy rainfall and above derived from
the area-average daily precipitation.

apparently overestimated the rainfall. In contrast, the bias precipitation over the central Three Gorges Reservoir area.
rate of PERSIANN was mostly around -50%, which implied The PERSIANN underestimated the seasonal rainfall
that the PERSIANN tended to underestimate the rainfall. amount throughout the year. In general, the TRMM pre-
The root-mean-square error (RMSE) of TRMM was the cipitation best coincided with the observation through the
smallest among all satellite products, no more than 2 mm/ four seasons (Figure 15). The TRMM data also had the
day most of the time. The RMSE of CMORPH had a similar smallest RMSE and the lowest bias rate except for summer,
fluctuation tendency as that of TRMM but noticeably higher when the bias rate of CMORPH was the lowest of all. In
than the TRMM in a few months. The PERSIANN had the consistency with the spatial pattern, all satellite products
largest RMSE, basically between 2 mm/day and 6 mm/day. underestimated the winter precipitation to a varying degree.
 The spatial pattern of seasonal mean precipitation rate The above results evinced that the TRMM product was the
was generally reproduced in the CMORPH and TRMM data best for the seasonal timescale.
(Figure 14). Only the winter season showed an obvious The percentage of occurrence of different precipitation
deviation from the observation, in which the precipitation rates was calculated for each season (Figure 16). The
over the western Three Gorges Reservoir area was under- PERSIANN overestimated the occurrence of light rain but
estimated. The CMORPH also overestimated the underestimated the probability of moderate and heavy rains.
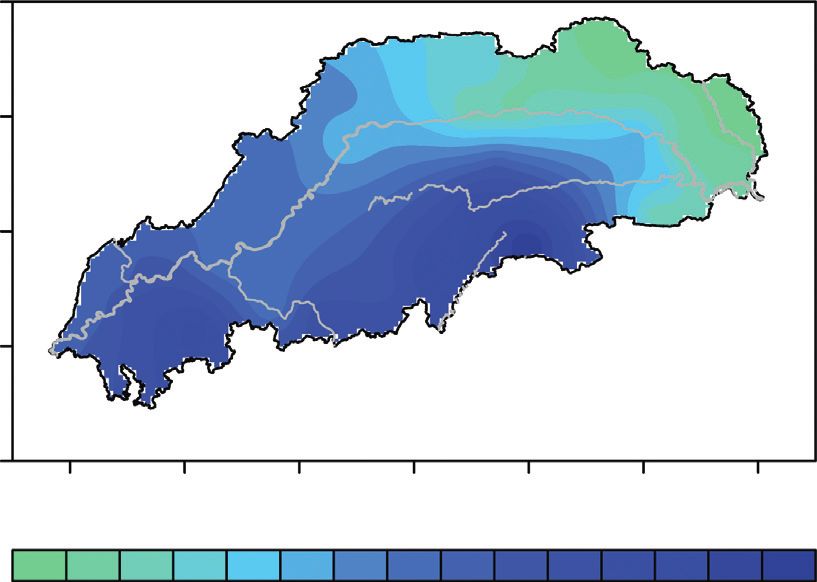
Advances in Meteorology 15

 100 60

 40
 50
 20

 0 0
 1 10 20 30 40 50 60 1 10 20 30 40 50 60
 Rain rate (mm/day) Rain rate (mm/day)
 CMORPH CMORPH
 PERSIANN PERSIANN
 TRMM TRMM
 (a) (b)

 80

 60

 40

 20

 0
 1 10 20 30 40 50 60
 Rain rate (mm/day)
 CMORPH
 PERSIANN
 TRMM
 (c)

Figure 12: (a) The hit bias, (b) the probability of detection, and (c) the false alarm rate of each satellite product on a daily timescale.

The profiles of TRMM and CMORPH resembled each other, 17(c)). The rainy-day pattern of PERSIANN was almost
but less moderate rain was detected by TRMM than opposite to the observation, with the maximum over the
CMORPH. Among all satellite products, the CMORPH northern reservoir area and the minimum over the south-
estimates of rainfall occurrence were closest to the obser- western reservoir area (Figure 17(d)). In all satellite esti-
vation in winter and spring, and the TRMM estimates were mates, the occurrence of rainy events was more frequent in
the best in summer and autumn. the east than in the west. This characteristic mainly resulted
 from the bias of rainy-day detection in spring, autumn, and
 winter. In these three seasons, both CMORPH and TRMM
3.2. Rainy-Day Detection. The rainy events most frequently showed the rainy-day maximum over the central reservoir
occur in the southern reservoir area, around the tributary area and the rainy-day minimum in the west (Figure 18). The
stations such as Hefeng, Laifeng, and Nanchuan PERSIANN obviously underestimated the rainy events in
(Figure 17(a)). The eastern reservoir area had the least rainy autumn, with rainy day less than 20 in most areas. In
days of the entire area. In comparison to the observation, contrast, the observed rainy day ranged from 24 to 32. In
both TRMM and CMORPH showed the rainy-day maxi- spring and winter, the PERSIANN rainy-day maximum was
mum over the central reservoir area (Figures 17(b) and distributed in the north, which resulted in the northward
16 Advances in Meteorology

 1
 0.5
 0
 –0.5
 Jan 2001 Jan 2003 Jan 2005 Jan 2007 Jan 2009 Jan 2011 Jan 2013 Jan 2015
 CMORPH
 PERSIANN
 TRMM
 (a)
 200

 100

 0

 –100
 Jan 2001 Jan 2003 Jan 2005 Jan 2007 Jan 2009 Jan 2011 Jan 2013 Jan 2015
 CMORPH
 PERSIANN
 TRMM
 (b)
 8
 6
 4
 2
 0
 Jan 2001 Jan 2003 Jan 2005 Jan 2007 Jan 2009 Jan 2011 Jan 2013 Jan 2015
 CMORPH
 PERSIANN
 TRMM
 (c)

Figure 13: Time series of (a) correlation coefficient, (b) bias rate, and (c) root-mean-square error of each satellite product on a monthly
timescale.

shift of rainy-day maximum in the whole year. observation, the CMORPH estimate was the most realistic
 The frequency of occurrence of each rainfall magnitude and accurate among all satellite products (Figures 20(b)–
was calculated on the monthly basis (Figure 19). In com- 20(d)). In contrast, the TRMM underestimated the maxi-
parison to the observation, the TRMM tended to overestimate mum precipitation amount especially around Beibei, Sha-
the frequency of rainy events in the winter half year (Octo- pingba, Banan, Kaizhou, Enshi, and Jianshi observation
ber–next March). The CMORPH was inclined to overestimate stations. At these stations, the maximum rainfall amount
the frequency of moderate rains during the rainy season was underestimated for about 50 mm. This bias was even
(May–October) whereas the PERSIANN overestimated the worse in the PERSIANN estimate, in which most stations
frequency of light rains but underestimated the frequency of had the RX5day less than 100 mm.
heavy rains and above. These results suggested that the sat- The observed extreme precipitation was heavier in the
ellite estimates of rainy-day frequency were close to the east than in the west of the reservoir area (Figure 21(a)). This
observation but still had nonnegligible biases. spatial pattern resembled Liu et al. [49] in relation to the
 magnitude and distribution of R95. All satellite estimates of
 extreme precipitation deviated from the observation, where
3.3. Extreme Precipitation Detection. The maximum 5-day the CMORPH bias was the smallest (Figures 21(b)–21(d)).
precipitation (RX5day) ranged between 100 and 200 over the The estimated error of CMORPH data was mainly the
reservoir area (Figure 20(a)). The RX5day values were overestimation of extreme precipitation over the western
greater in the western area than in the eastern area. These reservoir area. This bias became more obvious in the TRMM
characteristics of the RX5day spatial pattern were generally data, which overestimated the extreme rainfall almost by
consistent with Ren et al. [44]. In comparison to the 100 mm around Qijiang, Wulong, Fuling, and Fengdu
Advances in Meteorology 17

 Spring Summer Autumn Winter
 32N 32N 32N 32N

 31N 31N 31N 31N
 Obs.

 Obs.

 Obs.

 Obs.
 30N 30N 30N 30N

 29N 29N 29N 29N

 28N 28N 28N 28N
 106E 107E 108E 109E 110E 111E 112E 106E 107E 108E 109E 110E 111E 112E 106E 107E 108E 109E 110E 111E 112E 106E 107E 108E 109E 110E 111E 112E

 2 2.8 3.6 4.4 5.2 3 4.4 5.8 7.2 8.6 1.4 2.2 3 3.8 4.6 5.4 0.2 0.4 0.6 0.8 1 1.2
 (a) (b) (c) (d)

 Spring Summer Autumn Winter
 32N 32N 32N 32N

 31N 31N 31N 31N
 PERSIANN

 PERSIANN

 PERSIANN

 PERSIANN
 30N 30N 30N 30N

 29N 29N 29N 29N

 28N 28N 28N 28N
 106E 107E 108E 109E 110E 111E 112E 106E 107E 108E 109E 110E 111E 112E 106E 107E 108E 109E 110E 111E 112E 106E 107E 108E 109E 110E 111E 112E

 2 2.8 3.6 4.4 5.2 3 4.4 5.8 7.2 8.6 1.4 2.2 3 3.8 4.6 5.4 0.2 0.4 0.6 0.8 1 1.2
 (e) (f) (g) (h)

 Spring Summer Autumn Winter
 32N 32N 32N 32N

 31N 31N 31N 31N
 CMORPH

 CMORPH

 CMORPH

 CMORPH
 30N 30N 30N 30N

 29N 29N 29N 29N

 28N 28N 28N 28N
 106E 107E 108E 109E 110E 111E 112E 106E 107E 108E 109E 110E 111E 112E 106E 107E 108E 109E 110E 111E 112E 106E 107E 108E 109E 110E 111E 112E

 2 2.8 3.6 4.4 5.2 3 4.4 5.8 7.2 8.6 1.4 2.2 3 3.8 4.6 5.4 0.2 0.4 0.6 0.8 1 1.2
 (i) (j) (k) (l)

 Spring Summer Autumn Winter
 32N 32N 32N 32N

 31N 31N 31N 31N
 TRMM

 TRMM

 TRMM

 TRMM
 30N 30N 30N 30N

 29N 29N 29N 29N

 28N 28N 28N 28N
 106E 107E 108E 109E 110E 111E 112E 106E 107E 108E 109E 110E 111E 112E 106E 107E 108E 109E 110E 111E 112E 106E 107E 108E 109E 110E 111E 112E

 2 2.8 3.6 4.4 5.2 3 4.4 5.8 7.2 8.6 1.4 2.2 3 3.8 4.6 5.4 0.2 0.4 0.6 0.8 1 1.2
 (m) (n) (o) (p)

 Figure 14: The spatial distribution of seasonal mean precipitation (units: mm/day) for each season.

stations. Conversely, the PERSIANN underestimated the Laifeng stations and about 2 days around Qijiang and
extreme precipitation by about 150 mm over the entire Wulong stations (Figure 22(d)). The above results sug-
reservoir area. gested that each satellite product had its own bias in
 The persistent rainy days (CWD) over the reservoir estimating the extreme precipitation, and the CMORPH
area were longer in the south than in the north was comparatively the best of all.
(Figure 22(a)). The separatrix between the north and the The maximum precipitation during the daytime,
south was around the Yangtze River. The TRMM tended nighttime, and the whole day was given in Table 5. Among
to underestimate the CWD in the upstream area all satellite products, the CMORPH was closest to the
(Figure 22(b)). For example, the TRMM estimates were observation in the daytime (bias around 2 mm). The
one day shorter than the observation at Qijiang and Banan PERSIANN estimates were the best of all during the
stations and two days shorter than the observation at nighttime (bias around 2 mm) and the whole day (bias
Shapingba and Nanchuan stations. Likewise, the around 4 mm). Both TRMM and CMORPH overestimated
CMORPH overestimated the CWD in the upstream area the maximum rainfall for all three periods, but instead, the
by about 1 day and also in the downstream area by 1-2 PERSIANN underestimated the maximum rainfall. It
days (Figure 22(c)). The CMORPH overestimation in the could be inferred from the rainfall data (Table 1) that the
downstream area covered Zigui, Yichang, Changyang, and daily biases of TRMM and PERSIANN were mostly at-
Badong stations. In contrast, the PERSIANN under- tributed to the estimate errors in daytime whereas the
estimated the CWD over the southern reservoir area by daily bias of CMORPH was basically related to the esti-
about 1 day around Nanchuan, Pengshui, Qianjiang, and mate errors in the nighttime.
18 Advances in Meteorology

 Spring Summer Autumn Winter
 19 20 22 28 3 22
 CC = 0.43 CC = 0.36 CC = 0.53 CC = 0.16
 PERSIANN (mm/day)

 PERSIANN (mm/day)

 PERSIANN (mm/day)

 PERSIANN (mm/day)
 10 10
 RMSE = 1.79mm/day RMSE = 2.47mm/day RMSE = 1.98mm/day RMSE = 0.43mm/day
 RB = –2.21% RB = –1.19% RB = –3.78% RB = –11.05%
 13 15 19 2 15

 5 10 5
 7 8 10 1 8

 0 1 0 1 0 1 0 1
 0 5 10 0 10 20 0 5 10 0 1 2 3
 Gauge (mm/day) Gauge (mm/day) Gauge (mm/day) Gauge (mm/day)
 (a) (b) (c) (d)

 Spring Summer Autumn Winter
 16 20 22 22 34
 CC = 0.73 CC = 0.69 CC = 0.74 CC = 0.30
 CMORPH (mm/day)

 CMORPH (mm/day)

 CMORPH (mm/day)

 CMORPH (mm/day)
 10 RMSE = 0.73mm/day RMSE = 1.31mm/day 10 RMSE = 0.78mm/day RMSE = 0.51mm/day
 RB = 0.06% RB = 0.05% RB = –0.18% 4 RB = –7.31%
 11 15 15 23

 5 10
 5
 6 8 8 2 12

 0 1 0 1 0 1 0 1
 0 5 10 0 10 20 0 5 10 0 2 4
 Gauge (mm/day) Gauge (mm/day) Gauge (mm/day) Gauge (mm/day)
 (e) (f) (g) (h)

 Spring Summer Autumn Winter
 22 20 25 25 13
 CC = 0.81 CC = 0.76 10 CC = 0.79 CC = 0.57
 10 3
 TRMM (mm/day)

 TRMM (mm/day)

 TRMM (mm/day)

 TRMM (mm/day)
 RMSE = 0.58mm/day RMSE = 1.15mm/day RMSE = 0.65mm/day RMSE = 0.34mm/day
 RB = –0.03% 15 RB = –0.13% RB = –0.16% RB = –7.09%
 15 17 17 9
 2
 5 10 5
 8 9 9 5
 5 1

 0 1 0 1 0 1 0 1
 0 5 10 0 10 20 0 5 10 0 1 2 3
 Gauge (mm/day) Gauge (mm/day) Gauge (mm/day) Gauge (mm/day)
 (i) (j) (k) (l)

Figure 15: Scatter plot of average daily precipitation in spring (a, e, i), summer (b, f, j), autumn (c, g, k), and winter (d, h, l) in the Three
Gorges Reservoir area.

 15
 Percentage of occurrence (%)

 Percentage of occurrence (%)

 10
 10

 5
 5

 0 0
 1 2 4 8 16 32 64 128 256 1 2 4 8 16 32 64 128 256
 Rain rate (mm/day) Rain rate (mm/day)
 Gauge PERSIANN Gauge PERSIANN
 CMORPH TRMM CMORPH TRMM
 (a) (b)
 Figure 16: Continued.
Advances in Meteorology 19

 15
 Percentage of occurrence (%)

 Percentage of occurrence (%)
 10

 10

 5
 5

 0 0
 1 2 4 8 16 32 64 128 256 1 2 4 8 16 32 64 128 256
 Rain rate (mm/day) Rain rate (mm/day)

 Gauge PERSIANN Gauge PERSIANN
 CMORPH TRMM CMORPH TRMM
 (c) (d)

Figure 16: The percentage of rainfall occurrence in (a) spring, (b) summer, (c) autumn, and (d) winter in the Three Gorges Reservoir area.

 32N 32N

 31N 31N

 30N 30N

 29N 29N

 28N 28N
 106E 107E 108E 109E 110E 111E 112E 106E 107E 108E 109E 110E 111E 112E
 day day
 80 85 90 95 100 105 110 72 76 80 84 88 92 96 100
 (a) (b)
 32N 32N

 31N 31N

 30N 30N

 29N 29N

 28N 28N
 106E 107E 108E 109E 110E 111E 112E 106E 107E 108E 109E 110E 111E 112E
 day day
 77 87 97 107 117 70 75 80 85 90 95
 (c) (d)

Figure 17: The spatial distribution of annual mean rainy days (based on the rainfall amount greater than or equal to 1 mm) in (a) gauge
observation, (b) TRMM, (c) CMORPH, and (d) PERSIANN.
20 Advances in Meteorology

 Spring Summer Autumn Winter
 32N 32N 32N 32N

 31N 31N 31N 31N
 Obs.

 Obs.

 Obs.

 Obs.
 30N 30N 30N 30N

 29N 29N 29N 29N

 28N 28N 28N 28N
 106E 107E 108E 109E 110E 111E 112E 106E 107E 108E 109E 110E 111E 112E 106E 107E 108E 109E 110E 111E 112E 106E 107E 108E 109E 110E 111E 112E

 20 24 28 32 36 40 20 24 28 32 36 40 44 16 20 24 28 32 36 3 7 11 15 19 23
 (a) (b) (c) (d)

 Spring Summer Autumn Winter
 32N 32N 32N 32N

 31N 31N 31N 31N
 PERSIANN

 PERSIANN

 PERSIANN

 PERSIANN
 30N 30N 30N 30N

 29N 29N 29N 29N

 28N 28N 28N 28N
 106E 107E 108E 109E 110E 111E 112E 106E 107E 108E 109E 110E 111E 112E 106E 107E 108E 109E 110E 111E 112E 106E 107E 108E 109E 110E 111E 112E

 20 24 28 32 36 40 20 24 28 32 36 40 44 16 20 24 28 32 36 3 7 11 15 19 23
 (e) (f) (g) (h)

 Spring Summer Autumn Winter
 32N 32N 32N 32N

 31N 31N 31N 31N
 CMORPH

 CMORPH

 CMORPH

 CMORPH
 30N 30N 30N 30N

 29N 29N 29N 29N

 28N 28N 28N 28N
 106E 107E 108E 109E 110E 111E 112E 106E 107E 108E 109E 110E 111E 112E 106E 107E 108E 109E 110E 111E 112E 106E 107E 108E 109E 110E 111E 112E

 20 24 28 32 36 40 20 24 28 32 36 40 44 16 20 24 28 32 36 3 7 11 15 19 23
 (i) (j) (k) (l)

 Spring Summer Autumn Winter
 32N 32N 32N 32N

 31N 31N 31N 31N
 TRMM

 TRMM

 TRMM

 TRMM
 30N 30N 30N 30N

 29N 29N 29N 29N

 28N 28N 28N 28N
 106E 107E 108E 109E 110E 111E 112E 106E 107E 108E 109E 110E 111E 112E 106E 107E 108E 109E 110E 111E 112E 106E 107E 108E 109E 110E 111E 112E

 20 24 28 32 36 40 20 24 28 32 36 40 44 16 20 24 28 32 36 3 7 11 15 19 23
 (m) (n) (o) (p)

Figure 18: The spatial distribution of seasonal mean rainy day (based on the rainfall amount greater than or equal to 1 mm) in (a–d) gauge
observation, (e–h) PERSIANN, (i–l) CMORPH, and (m–p) TRMM.
You can also read