A novel approach to calibrating a photoacoustic absorption spectrometer using polydisperse absorbing aerosol - Atmos. Meas. Tech
←
→
Page content transcription
If your browser does not render page correctly, please read the page content below
Atmos. Meas. Tech., 12, 3351–3363, 2019
https://doi.org/10.5194/amt-12-3351-2019
© Author(s) 2019. This work is distributed under
the Creative Commons Attribution 4.0 License.

A novel approach to calibrating a photoacoustic absorption
spectrometer using polydisperse absorbing aerosol
Katie Foster, Rudra Pokhrel, Matthew Burkhart, and Shane Murphy
Atmospheric Science, University of Wyoming, Laramie, WY 82071, USA

Correspondence: Shane Murphy (shane.murphy@uwyo.edu)

Received: 26 November 2018 – Discussion started: 17 December 2018
Revised: 12 March 2019 – Accepted: 29 March 2019 – Published: 26 June 2019

Abstract. A new technique for calibrating photoacoustic           This calibration technique is easily deployed in the field as it
aerosol absorption spectrometers with multiple laser passes       involves no toxic or reactive gases and it does not require
in the acoustic cavity (multi-pass PAS) has been developed        generation of a monodisperse aerosol. Advantages to this
utilizing polydisperse and highly absorbing aerosol. This is      particle-based calibration technique versus techniques based
the first calibration technique for multi-pass PAS instruments    on ozone or nitrogen dioxide absorption include no reactive
that utilizes particles instead of reactive gases and does not    losses or impact from carrier gases and the broad absorption
require knowledge of the exact size or refractive index of        characteristics of the particles, which eliminate potentially
the absorbing aerosol. In this new method, highly absorb-         significant errors in calibration that come with small errors
ing materials are aerosolized into a polydisperse distribu-       in the peak wavelength of the laser light when utilizing gas-
tion and measured simultaneously with a multi-pass PAS            phase standards.
and a cavity-attenuated phase shift particulate matter single-
scattering albedo (CAPS PMSSA , Aerodyne Inc.) instrument.
The CAPS PMSSA measures the bulk absorption coefficient
through the subtraction of the scattering coefficient from the    1   Introduction
extinction coefficient. While this approach can have signifi-
cant errors in ambient aerosol, the accuracy and precision of     Absorbing aerosols represent a significant uncertainty in
the CAPS PMSSA are high when the measured aerosol has             estimates of global radiative forcing. Black carbon (BC)
a low single-scattering albedo (SSA) and particles are less       aerosols, which absorb at all visible wavelengths (Bond et
than 300 nm in size, in which case truncation errors are small.   al., 2013), are emitted into the atmosphere as a byprod-
To confirm the precision and accuracy of the new calibration      uct of incomplete combustion of biomass and fossil fuels
approach, a range of aerosol concentrations were sent to the      (Bond and Bergstrom, 2006; Jacobson, 2004, 2010). Brown
multi-pass PAS and CAPS PMSSA instruments using three             carbon refers to organic aerosol that absorbs much more
different absorbing substances: Aquadag, Regal Black, and         strongly in the high-energy (blue) portion of the visible
Nigrosin. Six repetitions with each of the three substances       spectrum than the low-energy (red) portion (Bahadur et al.,
produced stable calibrations, with the standard deviation of      2012; Barnard et al., 2008; Kirchstetter and Thatcher, 2012;
the calibration slopes being less than 2 % at 660 nm and less     McMeeking et al., 2014). Bond et al. (2013) estimated the
than 5 % at 405 nm for a given calibration substance. Cali-       global top of the atmosphere radiative forcing of BC to be 1.1
brations were also consistent across the different calibration    [0.17–2.1] W m−2 , compared to the radiative forcing from
substances (standard deviation of 2 % at 660 nm and 10 %          CO2 of +1.68 [1.5–1.86] W m−2 and CH4 at +0.97 [0.80–
at 405 nm) except for Nigrosin at 405 nm. The accuracy of         1.14] W m−2 [2013]. This estimate that BC is the second
the calibration approach is dependent on the SSA of the cal-      most radiatively significant emission does not include the ra-
ibration substance but is roughly 6 % for the calibration sub-    diative effects of brown carbon, which is potentially a sig-
stances used here, which all have an SSA near 0.4 at 405 nm.      nificant category of absorbing aerosol but which has a larger
                                                                  uncertainty in its optical properties and abundance. Model-

Published by Copernicus Publications on behalf of the European Geosciences Union.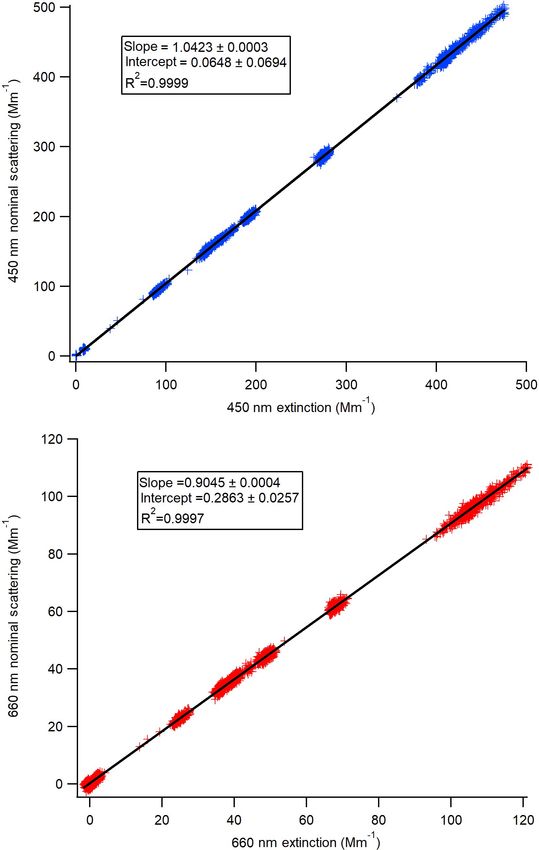
3352                               K. Foster et al.: A new approach to calibrating a photoacoustic absorption spectrometer

ing studies indicate that the direct radiative forcing of brown      can be achieved through implementation of an acoustic cell
carbon could range up to +0.12 or +0.57 W m−2 (Lin et al.,           where the laser passes through the cell many times (Lack et
2014; Saleh et al., 2015). Much of the uncertainty stems from        al., 2006). Unfortunately, implementation of a multi-pass cell
the dependence on mixing state (Brown et al., 2018; Cappa            prevents straightforward calibration of the instrument. Theo-
et al., 2012; Feng et al., 2013; Liu et al., 2015) and from a        retically, the absorption coefficient (babs ) can be determined
wide range of reported refractive indices (Chakrabarty et al.,       from a PAS as a function of absolute laser power (PLaser ),
2010; Lack et al., 2012b; Nakayama et al., 2013; Saleh et            pressure at the microphone (PMic ), resonator cross sectional
al., 2013, 2014). The actual radiative forcing of brown car-         area (ARes ), resonant frequency FR , and quality factor (Q).
bon is significantly less if it bleaches quickly, but the extent
                                                                              PMic ARes π 2 FR
and timeframe of bleaching remain uncertain (Forrister et al.,       babs =                                                       (1)
2015; Lee et al., 2014; Liu et al., 2016).                                    PLaser γ − 1 Q
    Given the significance and uncertainty of absorbing              For multi-pass instruments it is difficult (Fischer and Smith,
aerosol radiative forcing, it is critical to have accurate and       2018b) or not feasible, given the instrument setup (Lack et
unbiased measurements of aerosol absorption. There are sev-          al., 2012b), to know all of these terms accurately. This means
eral ways to measure aerosol absorption. Most commonly,              the first principles approach of Arnott et al. (1999) is not pos-
absorption is measured by filter-based techniques such as the        sible for many instruments. The issue with a fundamental
aethalometer (Hansen et al., 1984), particle soot absorption         calibration is that the overlap integral of the laser, acoustic
photometer (PSAP) (Bond et al., 1999), or continuous light           mode, and aerosol is not known accurately enough for cal-
absorption photometer (CLAP) (Ogren et al., 2017). These             ibrations. Additionally, the microphone sensitivity and laser
approaches utilize measurement of the attenuation of light in-       power are not known accurately enough for calibration pur-
tensity (typically from an LED) due to absorption by aerosols        poses in the design of Lack et al. (2012b). Therefore, another
that are captured on a filter, but these techniques are prone to     calibration approach must be utilized. Lack et al. (2012b)
a variety of biases from multiple scattering within the filter       adopted an approach where ozone-enriched air is passed in
itself, variability in backscatter based on the size distribu-       parallel through a photoacoustic cell and a cavity ring-down
tion of the particles, and issues with nonlinear responses to        cell that is operated at the same wavelength. While this ap-
loading as the filter becomes saturated (Bond et al., 1999;          proach has advantages, such as the ease of forming ozone in
Collaud Coen et al., 2010; Kondo et al., 2009; Lack et al.,          situ, there are also significant drawbacks. These drawbacks
2014; Müller et al., 2011; Weingartner et al., 2003). While          include (1) a very small absorption cross section of ozone at
filter-based measurements can be high precision, absorption          405 nm wavelength (1.47 × 10⁻²³ cm2 per molecule; Axson
measurements made by filter-based measurements are typi-             et al., 2011) necessitating very high ozone concentrations,
cally only accurate to within roughly 30 %–35 % (Bond et             (2) the need to exactly match the laser wavelengths of the
al., 2013). An alternate way to measure absorption is via            PAS and cavity ring-down spectrometer (CRDS), (3) poten-
the difference of extinction and scattering (Wei et al., 2013).      tial reactions or differential wall loss of the ozone between
The difference method is nonideal for many types of ambi-            instruments, and (4) an apparent dependence of the calibra-
ent aerosol due to small measurement errors in extinction and        tion on the bath gas, with a nitrogen bath gas yielding incor-
scattering having large impacts on measured absorption lev-          rect slopes (Fischer and Smith, 2018a). Even when account-
els when the particles are mostly scattering (single-scattering      ing for these known potential issues with ozone calibration,
albedo, SSA, is high) (Singh et al., 2014). Scattering mea-          unresolved discrepancies between calibrations performed by
surements are prone to truncation errors for aerosols larger         different research groups remain (Bluvshtein et al., 2017;
than ∼ 300 nm (when measuring scattering in the visible),            Davies et al., 2018; Fischer and Smith, 2018a). Another op-
due to the high fraction of forward-scattered light for parti-       tion is to calibrate with known concentrations of nitrogen
cles with larger size parameters (Onasch et al., 2015).              dioxide (instead of ozone) running through both the PAS and
    Photoacoustic spectrometry has emerged as an unbiased            CRDS. The primary problem with using NO2 to calibrate is
and sensitive method for measuring absorption of dry aerosol         that NO2 photolyzes at 405 nm and the magnitude of pho-
(Arnott et al., 1999; Lack et al., 2006, 2014; Petzold and           tolysis depends on the laser power in the instrument (Jones
Niessner, 1996). A photoacoustic aerosol absorption spec-            and Bayes, 1973; Lack et al., 2012a), so while it would be
trometer (PAS) with a single laser pass can be calibrated            a good calibration standard at 532 nm, it is a poor standard
based on first principles if the resonant cell area, resonant fre-   near or below 405 nm. Even for 532 nm cells, calibration with
quency, quality factor of resonator, and the laser beam power        NO2 requires exact matching of laser wavelengths between
at the resonant frequency are known (Rosencwaig, 1980).              the PAS and CRDS, has the potential for reactive loss, and re-
This approach was implemented by Arnott et al. (1999, 2000)          quires the use of a toxic substance. While the NO2 concentra-
and was validated by passing a known concentration of nitro-         tions are often small enough not to pose a significant health
gen dioxide through the instrument. However, the sensitiv-           hazard, NO2 use on airborne platforms still requires signifi-
ity of the photoacoustic technique is strongly related to the        cant additional safety precautions. Given the issues with gas-
laser power inside the acoustic cell and increased sensitivity       phase calibration, it would be desirable to have a particle-

Atmos. Meas. Tech., 12, 3351–3363, 2019                                                www.atmos-meas-tech.net/12/3351/2019/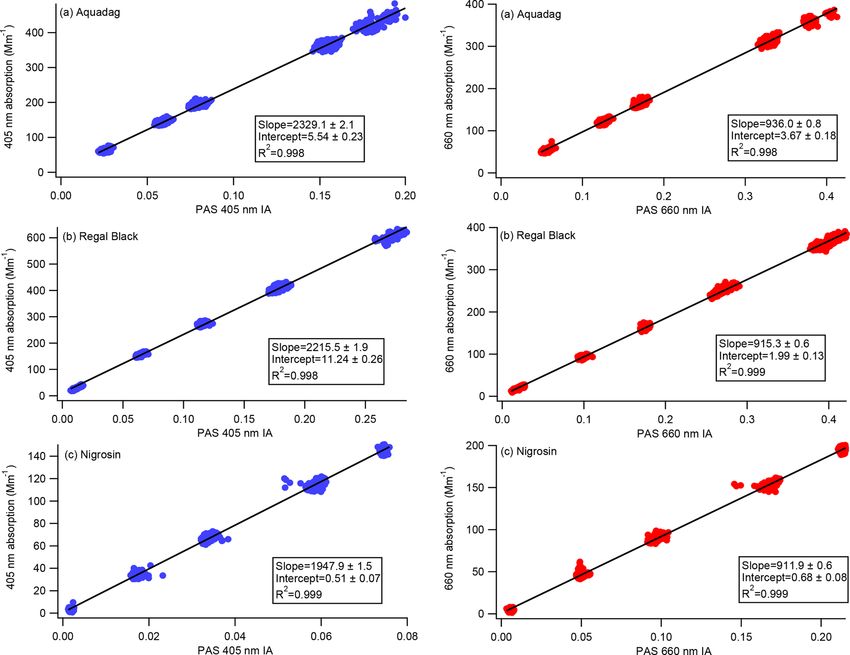
K. Foster et al.: A new approach to calibrating a photoacoustic absorption spectrometer                                      3353

based calibration method. In addition to avoiding the issues        several different substances across many laboratory calibra-
with reactive gases, a particle-based calibration would en-         tions, and has been used successfully in the field.
able detection of particle losses in the system. Calibration
using particles has been attempted by several groups to as-
sess the validity of their PAS calibration (Lack et al., 2006,      2     Materials and methods
2014; Bluvshtein et al., 2017; Fischer and Smith, 2018). All
of these groups generated absorbing particles from nigrosin         2.1    University of Wyoming photoacoustic absorption
dye and then size-selected monodisperse aerosols with a dif-               spectrometer
ferential mobility analyzer (DMA). The aim of this approach
is to determine the absorption through Mie theory based on          The photoacoustic absorption spectrometer utilized in this
knowledge of the refractive index and size of a monodisperse        study (referred to from here on as the University of Wyoming
distribution of spherical particles being sent to the instru-       PAS or UW PAS) is based on the design of Lack et
ment. However, size selection via DMA causes two major              al. (2012b), with identical cell construction, lasers, mir-
issues. First, the concentration of particles is dramatically re-   rors, microphones, speakers, and analog signal conditioning.
duced because only a small fraction of the size distribution        Some important differences are that the Lack et al. (2012b)
passes through the instrument and because uncharged parti-          PAS has five cells, while the UW PAS has four: two cells op-
cles are lost. Second, large particles with multiple charges        erating at a wavelength of 660 nm and two at 405 nm. One
will be passed through the DMA, along with the monodis-             cell at each wavelength is configured to sample dry air, while
perse particles of interest, which causes significant errors in     the other two are typically plumbed to the outlet of a ther-
the calibration because these particles have roughly 8 (dou-        modenuder. For the calibrations presented in this study, the
bly charged) or more (triply charged) times the mass of the         thermodenuded cells are run in a bypass mode and represent
target particles, and absorption is roughly proportional to         a duplicate measurement at each wavelength. The UW PAS
mass. The only way to accurately account for these multiply         has custom data-acquisition software and significantly dif-
charged particles is to be confident that there are very few        ferent vibration isolation and cooling systems than the Lack
particles in the larger size ranges or to add a second DMA          et al. (2012b) PAS. While these modifications provide utility
to measure the size distribution generated. Adding a second         and noise suppression, they do not fundamentally alter the
DMA is expensive, adds complexity, and may not accurately           operation of the instrument. A brief instrument description
detect a very small number of multiply charged particles that       follows. Ambient air is pulled through two half-wavelength
would result in significant error. In addition to the issues        resonant cells which consist of two cylinders (11 cm in length
of generating a monodisperse distribution, this approach to         and 1.9 cm diameter) with quarter-wavelength caps. The pri-
particle-based calibration requires exact knowledge of the          mary eigenmode of this instrument consists of one full wave-
real and imaginary refractive index of the calibration parti-       length across the two cells, such that the antinodes are at the
cles. The refractive index of nigrosin dye has been tested by       center of each cell and 180◦ out of phase. One cell is illu-
several groups as an aerosol calibration standard, and three        minated with laser light while the other is not. The signal
different groups have published estimates of the complex re-        from the two cells is subtracted in an attempt to remove back-
fractive index (RI) of nigrosin at 405 nm (Bluvshtein et al.,       ground noise. Cells are sealed with antireflective coated win-
2017; Ugelow et al., 2017; Washenfelder et al., 2013). The          dows to pass laser light, and outside of this enclosed cell are
three studies differ in the retrieved imaginary RI at a given       two cylindrical mirrors rotated 90◦ out of phase. The front
wavelength by 15 %, indicating that nigrosin does not have          mirror has a 2 mm hole to pass a collimated laser beam and
consistent optical properties between different batches and is      radius of curvature of 430 mm, while the back mirror cylin-
probably not an ideal candidate for an absorption calibration       drical radius is 470 mm. The mirrors are treated with a di-
standard. In fact, there has been a desire for a substance that     electric coating to be 99.5 % reflective. When appropriately
can be atomized that absorbs in the visible and that has had a      aligned, the end result is an astigmatic pattern that produces
known constant refractive index for several years. Zangmeis-        many (theoretically 182) passes of the laser light, with energy
ter and Radney (2018) have found a substance that can be at-        lost from scattering off the mirrors and windows at each pass
omized from aqueous solution that has a relatively constant         and several potential versions of the astigmatic pattern, each
refractive index and could eventually be an aerosol absorp-         with different numbers of passes. The light loss depends on
tion standard, but this approach still requires selection of a      how clean the system is and the system alignment, and, for
monodisperse aerosol distribution, which has the limitations        this reason, quantification of laser power in the cell is not
discussed above.                                                    possible without a significant amount of additional equip-
   This paper presents a novel calibration technique that uti-      ment. The laser power is modulated at the resonant frequency
lizes polydisperse absorbing aerosol and does not require a         of the cell and interacts with absorbing aerosol in the cell,
substance with a known refractive index. The technique al-          which heat and expand the air around them at the frequency
lows measurement of concentrations spanning from a few              of modulation. The resulting acoustic wave is measured by
Mm−1 to several hundred Mm−1 , gives consistent results for         two microphones (Knowles Corp. EK-23132-000) placed at

www.atmos-meas-tech.net/12/3351/2019/                                                Atmos. Meas. Tech., 12, 3351–3363, 2019
3354                              K. Foster et al.: A new approach to calibrating a photoacoustic absorption spectrometer

each antinode (one in the cell with laser light passing through
it and one in the dark cell). The subtraction and amplification
of the two microphone signals is done on a signal-processing
board identical to that described in Lack et al. (2012b). The
analog signal is then digitized and converted via a Fourier
transform into frequency space. The power at the peak reso-
nant frequency is summed with the power 1 Hz to either side
of the peak so that the total signal is an integrated area across
three points that each are 1 Hz apart. Thus, the signal from
each PAS cell is referred to as integrated area (IA).
    To obtain the maximum and consistent signal the lasers
must be modulated at each cell’s resonant frequency, which          Figure 1. Schematic of the calibration setup. Flow begins in the bot-
is dependent on temperature and pressure in the cell. Ac-           tom left at the constant output atomizer, and the aerosols are diluted
cordingly, a resonant frequency calibration is performed at         and dried before being distributed to each instrument. The DMA is
                                                                    a TSI differential mobility analyzer, and the CPC is a TSI 3010 con-
regular intervals (typically at least every 5 min) to account
                                                                    densation particle counter. When combined, these two instruments
for any drifts in temperature or pressure. There is a speaker
                                                                    are referred to as a scanning mobility particle sizer.
(Knowles Corp. EP-24075-000) in each cell for this purpose.
This resonant frequency calibration is performed in a differ-
ent way than Lack et al. (2012b). The speaker output is swept       function of polystyrene latex (PSL) sphere diameter for 660
over range of frequencies at constant output power and the          and 450 nm wavelength instruments and demonstrated that
frequency that gives the maximum integrated area is found.          the truncation only becomes significant for particles larger
The first calibration is done over a wide range of frequencies      than 300 nm in diameter.
(1640–1370 Hz), then subsequent calibrations are done over
∼ 5 Hz ranges given that the resonant frequency has never           2.3   Generation of absorbing aerosol for PAS
been observed to vary by more than this between frequency                 calibration
calibrations.
                                                                    Three different absorbing substances were used in this study:
2.2    CAPS PMSSA                                                   Aquadag, Nigrosin, and Regal Black. All three are com-
                                                                    monly used to generate absorbing aerosol for optical mea-
The Aerodyne CAPS PMSSA instrument combines a cavity-               surements by photoacoustic absorption spectrometers, and
attenuated phase shift (CAPS) measurement of extinction             Aquadag is commonly used for calibration of the single par-
with an integrating nephelometer measurement of scattering.         ticle soot photometer (SP2) (Baumgardner et al., 2012; Gy-
The instrument uses a form of cavity-enhanced spectroscopy          sel et al., 2011; Jordan et al., 2015; McMeeking et al., 2014;
by which a square wave modulated light emission from an             Saleh et al., 2013). Aquadag (lot no. ON03616890) is a high-
LED is detected as a phase-shifted signal from which extinc-        viscosity slurry while Nigrosin (lot no. BCBR0628V) and
tion can be calculated (Kebabian et al., 2007). At the same         Regal Black (batch no. 400R GP-3901) are solid crystals.
time, scattered light from particles in the CAPS cavity is          For all three substances, the method of generating a solu-
integrated across all angles minus the extreme forward and          tion was the same. The exact concentration of the solution
backward directions. The details of the CAPS PMSSA design,          is not critical because atomized particles are diluted with
principles of operation, calibration, sensitivity, and measure-     particle-free air, but the size distribution is important due
ment uncertainty are presented in Onasch et al. (2015). The         to the need to have particles smaller than 300 nm to limit
advantage of a single instrument that can measure the single-       truncation in the scattering channel of the CAPS PMSSA .
scattering albedo of bulk aerosols in real time is that it min-     A few crystals (solids) or a quarter spatula (slurry) of the
imizes potential sampling issues that can cause error be-           given substance is mixed with Milli-Q water (Millipore sys-
tween the scattering and extinction measurement. The ex-            tem SimPak2) and progressively diluted (starting with a cou-
tinction measurement is absolute (similar to cavity ring-down       ple hundred milliliters of water) until the size distribution of
spectroscopy) and therefore does not require routine calibra-       the atomized aerosols is such that 99 % of the mass is be-
tion. The scattering channel is calibrated by linking it to the     low 300 nm. More diluted solutions tend to yield aerosol with
extinction measurement through measurements of a purely             smaller sizes. After generating a reasonable solution that has
scattering aerosol, as discussed in Sect. 3.1. The main diffi-      a peak in its number size distribution from 40 to 70 nm, the
culty with using a CAPS PMSSA to measure the scattering             solutions are sonicated for 15 min to ensure they are com-
coefficient of ambient aerosols is the truncation of light scat-    pletely dissolved or well-mixed with the water.
tered from larger particles that tend to have a phase function,        Figure 1 shows a schematic of the experimental setup. Ab-
where a large fraction of light is scattered in the forward di-     sorbing aerosols are generated from solution using a constant
rection. Onasch et al. (2015) calculated the truncation as a        output atomizer (TSI) fed with particle-free (pulled through

Atmos. Meas. Tech., 12, 3351–3363, 2019                                                 www.atmos-meas-tech.net/12/3351/2019/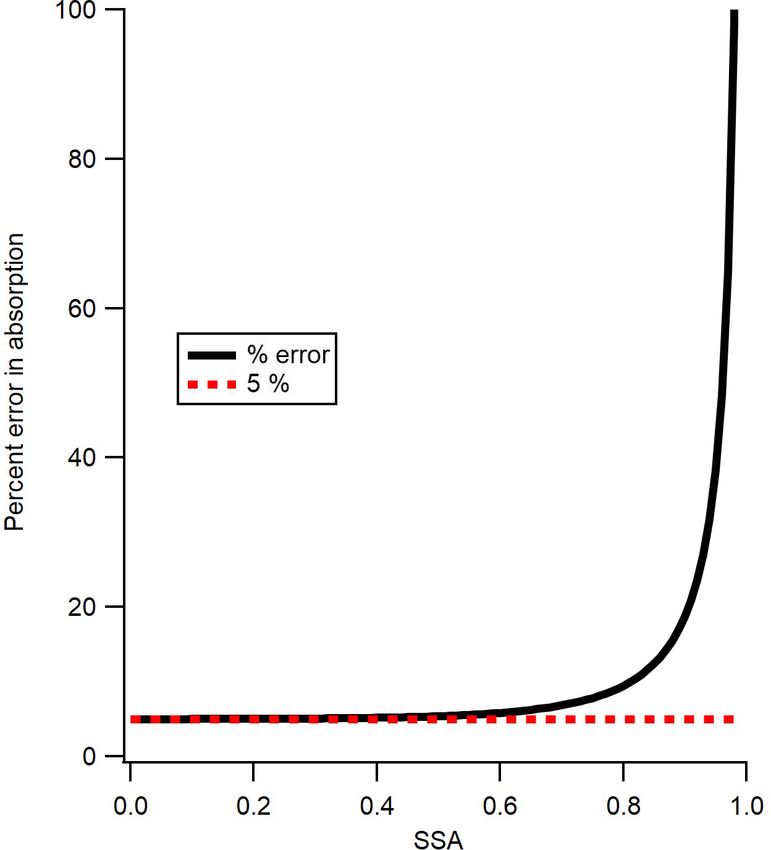
K. Foster et al.: A new approach to calibrating a photoacoustic absorption spectrometer                                               3355

a HEPA filter) air at 140 kPa. The aerosol is then passed
through a silica gel diffusion drier (TSI) and further diluted
with particle-free air to achieve the desired concentration.
The dilution is varied so that a range of concentrations can be
measured. The aerosols are dried a second time with a Nafion
tube drier (Purma Pure PD-100T) that is a permanent part of
the UW PAS inlet before the flow is split to four different in-
struments – the four-cell PAS, two different wavelength (450,
660 nm) CAPS PMSSA instruments, and a TSI scanning mo-
bility particle analyzer (SMPS), which is a combination of a
differential mobility analyzer (DMA) and condensation par-
ticle counter (CPC). The SMPS is set up with a 10 : 1 ratio of
sheath to sample flow, using flow rates of 3 L min−1 for the
sheath and 0.3 L min−1 for the sample. The output from the
DMA is diluted with 0.7 L min−1 of filtered air to achieve a
1 L min−1 flow rate for the CPC.

3     Results and discussion

The concept of the calibration method is to calibrate a multi-
pass PAS based on the absorption of small, highly absorbing
(SSA < 0.5) particles for which the absorption can be accu-
rately measured by the CAPS PMSSA . To ensure accurate re-
sults, the performance, accuracy, and precision of the CAPS
PMSSA measurement of absorption, through the difference
between extinction and scattering, must first be verified.

3.1    Calibration of the CAPS PMSSA scattering channel

The scattering channel for the CAPS PMSSA is calibrated rel-
ative to the extinction channel because the extinction does
not require calibration (Onasch et al., 2015). To calibrate the
scattering channel, polydisperse ammonium sulfate was at-           Figure 2. Scattering calibration curves for each of the Aerodyne
omized, dried, and diluted following the methods described          CAPS PMSSA instruments. The scattering channel is calibrated
                                                                    based on the relationship to the extinction channel across a range
in Sect. 2.3. The mean geometric diameter of the atomized
                                                                    of concentrations. The slope of the resulting linear fit gives the ratio
solution was tuned (through dilution of the atomized liquid)        that scattering must be corrected by.
to be close to 55 nm, with less than 1 % of the mass at diam-
eters greater than 300 nm, as verified by the SMPS. The con-
centration of the purely scattering ammonium sulfate aerosol
is varied to achieve extinction coefficient values ranging from
∼ 5 to 600 Mm−1 . A linear fit to the resulting data gives the      averaged over six calibrations is 0.890 ± 0.018 (2 % standard
relationship between the scattering coefficient and extinction      deviation from the mean). The errors in this calibration are
coefficient derived by a particular instrument. Figure 2 shows      included in the error estimate for the accuracy of this calibra-
an example of one calibration. The intercept in all cases is        tion technique.
very close to zero and is not used because baseline correc-            Tests were also performed to verify the accuracy of the
tions with a filter are made at regular intervals automatically     extinction measurement in the CAPS PMSSA . In these tests,
by both instruments. In Fig. 2a the 660 nm instrument has a         PSLs of various sizes were size-selected by an SMPS, then
ratio of scattering to extinction of 0.9045, so the true scatter-   the flow from the SMPS was split between a TSI 3010 CPC
ing coefficient is the reported scattering coefficient divided      and the CAPS PMSSA . It was found that the extinction mea-
by this slope. Similarly, in Fig. 2b, the scattering signal must    sured by the CAPS PMSSA was within 5 % of the extinction
be divided by 1.0423. Across six calibrations performed in          calculated based on Mie theory using the PSL size and the
this manner, the 450 nm CAPS PMSSA calibration slope was            number of particles measured by the CPC. The error between
1.0439 ± 0.0073 (0.7 % standard deviation of the mean). For         the Mie calculations and the CAPS PMSSA is within what
the 660 nm instrument, the ratio of scattering to extinction        is expected based on the size range stated for the PSLs, the

www.atmos-meas-tech.net/12/3351/2019/                                                   Atmos. Meas. Tech., 12, 3351–3363, 2019
3356 K. Foster et al.: A new approach to calibrating a photoacoustic absorption spectrometer
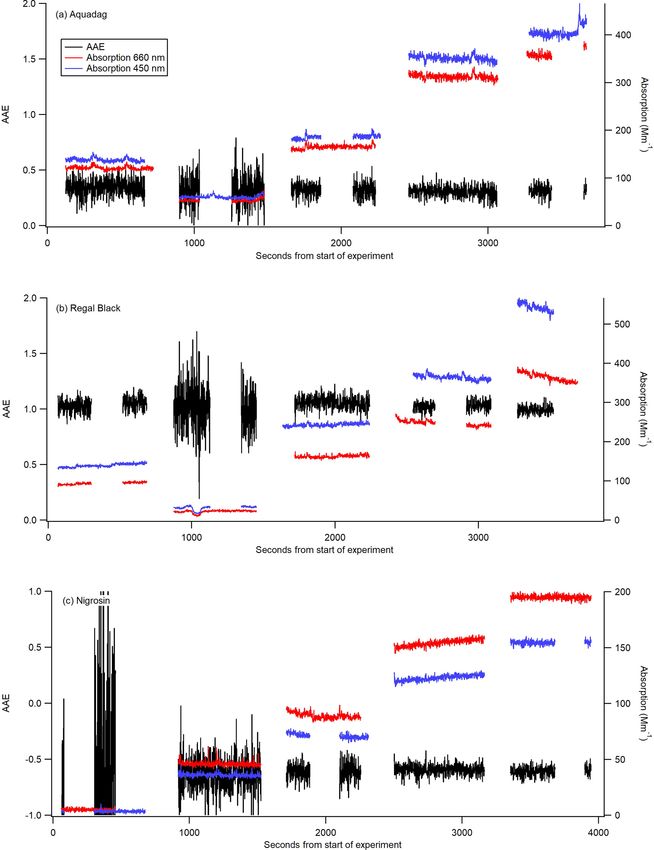
Figure 3. AAE (black) calculated from 1 Hz data from the CAPS PMSSA data for three different substances: Aquadag (a), Regal Black (b),
and Nigrosin (c). The 450 nm (blue) and 660 nm absorption (red) coefficients are taken from the CAPS PMSSA instrument. The absorption
coefficients are shown for context, as the AAE becomes significantly more noisy at low concentrations. Gaps in data occur when the CAPS
is conducting a baseline period, and the instruments are switched to filter for several minutes between each concentration.
counting accuracy of the CPC, and the stated accuracy of the While the red LED CAPS PMSSA instrument also operates
CAPS PMSSA . at 660 nm, the blue LED CAPS PMSSA operates at 450 nm, a
mismatch with the PAS wavelength. Initially a 405 nm CAPS
3.2 Calculation of absorption Ångström exponent for PMSSA instrument was built, but the 405 nm mirrors rapidly
each substance degraded, requiring a return to the 450 nm wavelength. We
demonstrate here that accurate calibration with the proposed
The UW PAS has two cells that operate at a wavelength method is feasible even when the instruments are ∼ 50 nm
of 405 nm and two that operate at a wavelength of 660 nm. separated in wavelength. This suggests that one could cali-
Atmos. Meas. Tech., 12, 3351–3363, 2019 www.atmos-meas-tech.net/12/3351/2019/K. Foster et al.: A new approach to calibrating a photoacoustic absorption spectrometer 3357
carbon (Bergstrom et al., 2002; Lack et al., 2012b; Moos-
müller et al., 2009, 2011). Aquadag is also a good choice
because, while it has slightly more variability in its AAE, the
AAE itself is smaller than that of Regal Black meaning the
accuracy of its value is mathematically less critical. Nigrosin
had a higher standard deviation than either Regal Black or
Aquadag, perhaps suggesting that even within a single batch
the substance does not have consistent optical properties. Ad-
ditionally, the Nigrosin tested here yielded a negative AAE,
which is inconsistent with Fig. 4 of Bluvshtein et al. (2017)
in the wavelength range of 400–450 nm that shows a positive
AAE. Nigrosin has been shown to have an index of refraction
that varies across the visible wavelengths (Bluvshtein et al.,
2017) and does not have a relationship between absorption
and wavelength that is perfectly modeled by AAE. However,
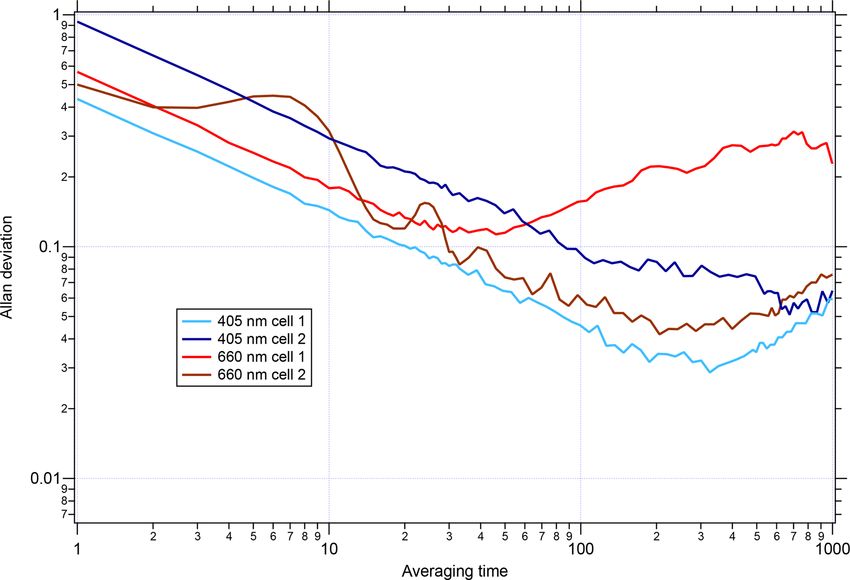
Figure 4. Allan deviation versus averaging time for the UW PAS given that the adjustment is only over a small wavelength
measuring filtered air. The PAS has four cells: two at 660 nm and range, the error introduced by adjusting absorption measure-
two and 405 nm.
ments from 450 to 405 nm with the AAE technique is still
assessed here. Nigrosin has the largest variation in calculated
brate PAS instruments at different wavelengths without hav- AAE from the different calibrations, but the difference in ab-
ing to have a CAPS PMSSA instrument to exactly match ev- sorption at 405 nm calculated from the highest AAE (−0.3)
ery PAS wavelength. Currently, CAPS DPMSSA are available to the lowest (−0.6), a factor of 2 in AAE, is only 3 %. This
at 630, 660, 530, and 450 nm. demonstrates that even with significant variation in AAE the
To account for the wavelength difference between the calibration method is still robust and this adjustment in wave-
CAPS PMSSA (450 nm) and the UW PAS (405 nm), the ab- length causes minimal error. The errors introduced by AAE
sorption Ångström exponent (AAE) was calculated based on for Regal Black and Aquadag are significantly smaller than
the 660 and 450 nm CAPS PMSSA measurements of absorp- that for Nigrosin. Figure 3 shows 1 Hz data from one of the
tion for each calibration and substance. This calculated AAE six calibrations with each substance. The AAE for a given
can then be used to convert the 450 nm absorption coeffi- substance is fairly stable but does grow noisy when absorp-
cient measured by the CAPS PMSSA into an estimate of the tion values are < 10 Mm−1 . This noise is particularly pro-
405 nm absorption coefficient needed to calibrate the multi- nounced in Fig. 3c, when small (∼ 5 Mm−1 absorption) con-
pass PAS. Equation (2) shows how AAE is calculated from centrations of Nigrosin do not produce a stable enough signal
the two different wavelength CAPS PMSSA measurements of in the two CAPS PMSSA instruments to accurately calculate
absorption coefficient, and the same relationship is used to AAE.
convert absorption at 450 nm to absorption at 405 nm.
3.3 UW PAS stability
b
log babs_660
abs_450
AAE = − (2) Before applying the CAPS PMSSA calibration to the UW
log 660450 PAS, the noise level of the UW PAS was assessed by plot-
ting the Allan deviation as a function of time. A similar
The experimentally derived AAE is different for each of the analysis for the CAPS PMSSA can be found in Onasch et
three substances used in this study, allowing for an assess- al. (2015). The Allan deviation, as a function of averaging
ment of the accuracy of utilizing AAE derived from mea- time, is displayed for each cell in the instrument in Fig. 4.
surements at 660 and 450 nm to convert from absorption at While the behavior of each cell is slightly different, on av-
450 nm to absorption at 405 nm. Six different calibrations erage, across the four cells of the instrument, the 1 s Allan
were conducted with each substance to assess the stability variance is 0.6 Mm−1 and is 0.5 Mm−1 for the best perform-
of the estimated AAE. For Aquadag the average AAE (±1σ ) ing cell. After 60 s of averaging, the noise drops nearly an or-
was 0.3423 ± 0.0357, for Regal Black it was 1.053 ± 0.022, der of magnitude to 0.09 Mm−1 on average and 0.06 Mm−1
and for Nigrosin it was −0.4687 ± 0.1127. The standard de- in the lowest noise cell. As an alternative noise assessment
viation expressed as a percentage for each of the substances to the Allan deviation, the standard deviation of 1, 30, and
is as follows: 2 % for Regal Black, 10 % for Aquadag, and 60 s average data are listed for all cells in Table S1 in the
24 % for Nigrosin. These results suggest that, of these sub- Supplement. The 1 s data standard deviation varies between
stances, Regal Black may be the best choice for this calibra- channels, from 0.01 to 0.12 Mm−1 , while at 30 s the range
tion technique because it has a very stable AAE and the AAE is 0.004 to 0.02 Mm−1 , and 60 s averaging has little change
is close to 1, which is often the assumption made for black from 30 s.
www.atmos-meas-tech.net/12/3351/2019/ Atmos. Meas. Tech., 12, 3351–3363, 20193358 K. Foster et al.: A new approach to calibrating a photoacoustic absorption spectrometer
Figure 5. Calibration curves representing CAPS PMSSA absorption versus PAS integrated area (IA). The PAS 405 nm cell is on the left,
and the 660 nm cell is on the right. A line is fit to the data, the slope of which gives the relationship between absorption and IA. Intercepts
are allowed to vary in order to achieve the most accurate slopes based on higher absorption levels where the accuracy of the CAPS PMSSA
is highest. During operation in the field, both instruments are frequently zeroed based on filter measurements, meaning the intercept of the
calibration slope is not needed.
3.4 Precision of calibration results largest standard deviation between the calibrations of 4 %. In
practice, the calibration slopes are applied to the PAS micro-
As described in Sect. 2.3, Nigrosin, Aquadag, and Regal phone signal to convert from integrated area to absorption
Black were aerosolized and passed to the four PAS cells (two (as outlined in Sect. 2.1). Filter periods are frequently con-
405 nm cells, two 660 nm cells), two CAPS PMSSA cells (660 ducted to determine the background absorption, and the PAS
and 450 nm), and an SMPS. The purpose of measuring with data are zeroed to this background. Large (on the order of
an SMPS was to confirm that only a negligible fraction of several hundred Mm−1 ) concentrations are used to generate
the polydisperse aerosol mass was at diameters > 300 nm. a slope that can be applied over significant concentrations in
Aerosol size distributions for each substance are displayed field measurements of smoke particles. Therefore, intercepts
in Fig. S1 in the Supplement. Absorption was determined at can be on the order of 10 Mm−1 . The intercepts from the cal-
450 and 660 nm by subtracting the CAPS PMSSA measure- ibrations are not used.
ment of scattering from CAPS PMSSA measurements of ex- Variations over the six calibrations using a single sub-
tinction. The absorption at 405 nm, where the PAS operates, stance are quite small and for the 660 nm data variation be-
was determined via measurements of the AAE as outlined tween the substances is also small (4 %). However, there is
in Sect. 3.3. The resulting calibration slopes for each chan- more variation between the three different substances in the
nel across six calibrations are shown in Fig. 5 and Table 1. blue wavelength and up to a 17 % difference between Ni-
The standard deviation of the six different calibration slopes grosin and Aquadag, though the results for Aquadag and Re-
at 660 nm have a maximum standard deviation of 1.2 % of gal Black are within 5 % of one another. We hypothesize that
the mean (Regal Black has this largest standard deviation). the optical properties of Nigrosin may vary in such a way that
At 405 nm, the variation is larger, with Nigrosin having the
Atmos. Meas. Tech., 12, 3351–3363, 2019 www.atmos-meas-tech.net/12/3351/2019/K. Foster et al.: A new approach to calibrating a photoacoustic absorption spectrometer 3359
Table 1. Summary of AAE and calibration slopes for each substance, reported as average and standard deviation from six calibrations.
Substance Average AAE Average slope at 660 nm Average slope at 405 nm
(Mm−1 /arb. unit) (Mm−1 /arb. unit)
Regal Black 1.053 ± 0.021 944 ± 12 2270 ± 65
Aquadag 0.342 ± 0.036 961 ± 11 2390 ± 33
Nigrosin −0.469 ± 0.112 921 ± 10 1980 ± 75
We utilize this equation because it allows the error to be
couched in terms of SSA. Given this, the fractional error in
the absorption coefficient, defined here to be σabs , is found by
adding the fractional errors in extinction and the fractional
error in the term (1–SSA) in quadrature. This can only be
done if the errors are independent. In this case independence
is a reasonable assumption because the error in extinction is
caused by the accuracy of interpreting the phase-shifted sig-
nal in the CAPS, while the error in SSA is caused by the abil-
ity to match the scattering signal to the extinction signal, as
discussed in Sect. 3.1. Given this, the error in the extinction
does not depend on the error in the SSA and vice versa. The
error in the term (1–SSA) is simply two percent of the SSA
because the integer 1 has no error. This yields an equation for
the fractional error in the absorption coefficient of
s
0.02 · SSA 2
2
σabs = σext + , (4)
1 − SSA
where σabs is the fractional error in absorption and σext is the
Figure 6. Percent error in absorption versus single-scattering albedo fractional error in extinction. The fractional error in absorp-
(SSA), following Eq. (4). As SSA approaches zero, absorption error tion (σabs ) is displayed (as a percent) as a function of SSA in
approaches 5 %; as SSA approaches 1, the error reaches infinity. Fig. 6. As SSA reaches 0, the error in absorption approaches
the 5 % limit which is the error in extinction alone, but as
SSA approaches 1 the error reaches infinity. The SSA of the
assuming an AAE between 450 and 405 nm may be inappro- three calibration substances in the current study are all close
priate. to 0.4, which yields an error of approximately ±5.2 %. The
high error above an SSA of ∼ 0.85 is a good indicator of the
3.5 Accuracy of calibration limits of using the CAPS PMSSA for measuring absorption
in ambient conditions, and one of the main motivations for
The previous section demonstrated that the precision of the making absorption measurements with the PAS instrument.
calibration method is ∼ 5 %, based on the variation in the Figure 6 also gives guidance into the highest SSA substances
average of six calibration runs or between the results from that one might consider using to calibrate a multi-pass PAS
different substances (other than Nigrosin at 405 nm, which with the CAPS PMSSA , based on the level of accuracy de-
appears to be an outlier). Next, the accuracy of the method sired. Finally, at very low levels of extinction, the errors are
is assessed. The fractional accuracy of the extinction coeffi- not defined by Eq. (4) but are dominated by the detection lim-
cient measured by the CAPS PMSSA is found by Onasch et its of the CAPS PMSSA . Despite this, Eq. (4) is a good repre-
al. (2015) to be ±0.05 or 5 %. The fractional error in SSA is sentation of the calibration error for the technique presented
reported by Onasch et al. (2015) to be 0.01 or 1 %, but we here because the slope of the calibration line is controlled by
find that it is slightly larger for our instrumental setup at 0.02 measurements with sufficient extinction (see Fig. 5).
or 2 %. We derive this slightly larger error in SSA from the
variability in our six repetitions of the scattering to extinc- 3.6 Mie theory applied to the Nigrosin calibration
tion calibration for the CAPS PMSSA . One way to find the
absorption coefficient from CAPS PMSSA data is via Eq. (3). The refractive index of Nigrosin dye was derived by Blu-
vshtein et al. (2017) through ellipsometry at both 405 nm
Absorption = Extinction · (1 − SSA) (3) (m = 1.624+0.154i) and 660 nm (m = 1.812+0.246i). The
www.atmos-meas-tech.net/12/3351/2019/ Atmos. Meas. Tech., 12, 3351–3363, 20193360 K. Foster et al.: A new approach to calibrating a photoacoustic absorption spectrometer Figure 7. Absorption from CAPS PMSSA data versus calculated absorption from SMPS size distributions, using Mie theory and the refractive indices as shown in figure. Panel (a) is for the 660 nm instrument while panel (b) is from the 450 nm. theoretical absorption of the polydisperse Nigrosin particles 450 nm CAPS PMSSA measured absorption and Mie the- used during the calibrations done in this paper was calculated ory, shown in Fig. 7b, is m = 1.600 + 0.105i. This refrac- from Mie theory assuming these refractive indices and com- tive index is similar to the result given in Liu et al. (2013) pared to the absorption measured by the CAPS PMSSA . Size of m = 1.61 + 0.12i. The discrepancy between the current distributions were measured by the SMPS, and absorption result and that from Bluvshtein et al. (2017) and different re- estimates were made for every SMPS scan yielding three in- fractive indices found in the literature at 405 nm for Nigrosin dependent calculations of absorption for every concentration (Washenfelder et al., 2015; m = 1.66 + 0.18i; Ugelow et al., level. We also performed this calculation for other indices of 2017; m = 1.57 + 0.133i) suggest that different batches of refraction that have been previously published in the litera- Nigrosin have different absorptivity and that Nigrosin may ture. Figure 7a shows measured CAPS absorption versus cal- not be a good calibration substance at shorter visible wave- culated absorption from Mie theory at 660 nm using the RI lengths. derived by Bluvshtein et al. (2017) (m = 1.812+0.246i) and demonstrates good agreement. The same calculations were done at 405 and 450 nm using the Bluvshtein et al. (2017) 4 Conclusions values (m = 1.624 + 0.154i at 405 nm, m = 1.605 + 0.190i at 450 nm), but in this case the ratio of measured CAPS ab- A new calibration method for multi-pass photoacoustic sorption to calculated absorption from Mie theory is ∼ 0.58 absorption spectrometers that uses polydisperse absorbing for both the 405 nm comparison and the 450 nm compar- aerosol and an accompanying measurement of absorption ison. The RI that gives the best agreement between the from the CAPS PMSSA instrument has been presented. This Atmos. Meas. Tech., 12, 3351–3363, 2019 www.atmos-meas-tech.net/12/3351/2019/
K. Foster et al.: A new approach to calibrating a photoacoustic absorption spectrometer                                                3361

method is demonstrated to be consistent over repeated trials           References
and across three different aerosol types, namely Aquadag,
Regal Black, and Nigrosin. The calibration curve repre-                Arnott, W. P., Moosmüller, H., Rogers, C. F., Jin, T., and Bruch,
sents the relationship between absorption as measured by the             R.: Photoacoustic spectrometer for measuring light absorption
                                                                         by aerosol: Instrument description, Atmos. Environ., 33, 2845–
CAPS PMSSA to integrated area as measured by the PAS and
                                                                         2852, https://doi.org/10.1016/S1352-2310(98)00361-6, 1999.
is demonstrated to be linear over 3 orders of magnitude in ab-         Arnott, W. P., Moosmüller, H., and Walker, J. W.: Nitrogen dioxide
sorption, up to ∼ 600 Mm−1 . The method is found to have an              and kerosene-flame soot calibration of photoacoustic instruments
absolute accuracy of less than ±6 % for the substances tested.           for measurement of light absorption by aerosols, Rev. Sci. In-
This aerosol-based method of calibration is simple and easy              strum., 71, 4545–4552, https://doi.org/10.1063/1.1322585, 2000.
to utilize in both the laboratory and the field and does not           Axson, J. L., Washenfelder, R. A., Kahan, T. F., Young, C. J., Vaida,
require size selection. By using absorbing particles, we elim-           V., and Brown, S. S.: Absolute ozone absorption cross section in
inate several potential concerns from gas-phase calibrations             the Huggins Chappuis minimum (350–470 nm) at 296 K, Atmos.
using nitrogen dioxide or ozone. Namely, there is no poten-              Chem. Phys., 11, 11581–11590, https://doi.org/10.5194/acp-11-
tial for reactive losses and concentrations on the order of hun-         11581-2011, 2011.
dreds of Mm−1 of absorption are easily and safely attained.            Bahadur, R., Praveen, P. S., Xu, Y., and Ramanathan, V.: Solar ab-
                                                                         sorption by elemental and brown carbon determined from spec-
Additionally, small differences in wavelength between in-
                                                                         tral observations, P. Natl. Acad. Sci. USA, 109, 17366–17371,
struments are of negligible consequence. To accommodate                  https://doi.org/10.1073/pnas.1205910109, 2012.
for a wavelength difference between 405 nm PAS cells and               Barnard, J. C., Volkamer, R., and Kassianov, E. I.: Estimation of
the 450 nm CAPS PMSSA , we calculate the AAE of each                     the mass absorption cross section of the organic carbon compo-
species based on the relationship between 660 and 450 nm                 nent of aerosols in the Mexico City Metropolitan Area, Atmos.
measured absorption coefficients from the CAPS PMSSA and                 Chem. Phys., 8, 6665–6679, https://doi.org/10.5194/acp-8-6665-
apply this to convert the 450 nm absorption coefficient to               2008, 2008.
the absorption coefficient at 405 nm. This is also shown to            Baumgardner, D., Popovicheva, O., Allan, J., Bernardoni, V., Cao,
have small uncertainties, < 3 %. Finally, we derive the refrac-          J., Cavalli, F., Cozic, J., Diapouli, E., Eleftheriadis, K., Gen-
tive index of a particular batch of Nigrosin at 450 nm to be             berg, P. J., Gonzalez, C., Gysel, M., John, A., Kirchstetter, T. W.,
m = 1.600 + 0.105i and confirm a previous result at 660 nm               Kuhlbusch, T. A. J., Laborde, M., Lack, D., Müller, T., Niess-
                                                                         ner, R., Petzold, A., Piazzalunga, A., Putaud, J. P., Schwarz,
of m = 1.812 + 0.246i.
                                                                         J., Sheridan, P., Subramanian, R., Swietlicki, E., Valli, G., Vec-
                                                                         chi, R., and Viana, M.: Soot reference materials for instru-
                                                                         ment calibration and intercomparisons: a workshop summary
Data availability. All data are available from the corresponding au-     with recommendations, Atmos. Meas. Tech., 5, 1869–1887,
thors upon request.                                                      https://doi.org/10.5194/amt-5-1869-2012, 2012.
                                                                       Bergstrom, R. W., Russell, P. B., and Hignett, P.: Wave-
                                                                         length Dependence of the Absorption of Black Carbon Parti-
Supplement. The supplement related to this article is available          cles: Predictions and Results from the TARFOX Experiment
online at: https://doi.org/10.5194/amt-12-3351-2019-supplement.          and Implications for the Aerosol Single Scattering Albedo,
                                                                         J. Atmos. Sci., 59, 567–577, https://doi.org/10.1175/1520-
                                                                         0469(2002)0592.0.CO;2, 2002.
Author contributions. MB, KF, RP, and SM all aided in the con-         Bluvshtein, N., Flores, J. M., He, Q., Segre, E., Segev, L.,
struction of the PAS. SM designed the experiments. KF and RP per-        Hong, N., Donohue, A., Hilfiker, J. N., and Rudich, Y.: Cal-
formed the experiments and data analysis. KF synthesized the data        ibration of a multi-pass photoacoustic spectrometer cell using
and wrote the manuscript with input from all authors.                    light-absorbing aerosols, Atmos. Meas. Tech., 10, 1203–1213,
                                                                         https://doi.org/10.5194/amt-10-1203-2017, 2017.
                                                                       Bond, T. C. and Bergstrom, R. W.: Light Absorption by Carbona-
Competing interests. The authors declare that they have no conflict      ceous Particles: An Investigative Review, Aerosol Sci. Technol.,
of interest.                                                             40, 27–67, https://doi.org/10.1080/02786820500421521, 2006.
                                                                       Bond, T. C., Anderson, T. L., and Campbell, D.: Calibration and
                                                                         Intercomparison of Filter-Based Measurements of Visible Light
Acknowledgements. The authors thank Ernie Lewis for providing            Absorption by Aerosols, Aerosol Sci. Technol., 30, 582–600,
his Mie theory code. This material is based upon work supported          https://doi.org/10.1080/027868299304435, 1999.
by the United States Environmental Protection Agency (US EPA)          Bond, T. C., Doherty, S. J., Fahey, D. W., Forster, P. M., Berntsen,
under grant no. R835883.                                                 T., Deangelo, B. J., Flanner, M. G., Ghan, S., Karcher, B., Koch,
                                                                         D., Kinne, S., Kondo, Y., Quinn, P. K., Sarofim, M. C., Schultz,
                                                                         M. G., Schulz, M., Venkataraman, C., Zhang, H., Zhang, S.,
                                                                         Bellouin, N., Guttikunda, S. K., Hopke, P. K., Jacobson, M.
Review statement. This paper was edited by Troy Thornberry and
                                                                         Z., Kaiser, J. W., Klimont, Z., Lohmann, U., Schwarz, J. P.,
reviewed by two anonymous referees.
                                                                         Shindell, D., Storelvmo, T., Warren, S. G., and Zender, C. S.:
                                                                         Bounding the role of black carbon in the climate system: A sci-

www.atmos-meas-tech.net/12/3351/2019/                                                     Atmos. Meas. Tech., 12, 3351–3363, 2019
3362 K. Foster et al.: A new approach to calibrating a photoacoustic absorption spectrometer entific assessment, J. Geophys. Res.-Atmos., 118, 5380–5552, mate, 17, 2909–2926, https://doi.org/10.1175/1520- https://doi.org/10.1002/jgrd.50171, 2013. 0442(2004)0172.0.CO;2, 2004. Brown, H., Liu, X., Feng, Y., Jiang, Y., Wu, M., Lu, Z., Wu, Jacobson, M. Z.: Short-term effects of controlling fossil-fuel soot, C., Murphy, S., and Pokhrel, R.: Radiative effect and cli- biofuel soot and gases, and methane on climate, Arctic ice, mate impacts of brown carbon with the Community Atmo- and air pollution health, J. Geophys. Res.-Atmos., 115, 14, sphere Model (CAM5), Atmos. Chem. Phys., 18, 17745–17768, https://doi.org/10.1029/2009JD013795, 2010. https://doi.org/10.5194/acp-18-17745-2018, 2018. Jones, I. T. N. and Bayes, K.: Photolysis of nitrogen dioxide, J. Cappa, C. D., Onasch, T. B., Massoli, P., Worsnop, D. R., Bates, Chem. Phys., 59, 4836, https://doi.org/10.1063/1.1680696, 1973. T. S., Cross, E. S., Davidovits, P., Hakala, J., Hayden, K. L., Jordan, C. E., Anderson, B. E., Beyersdorf, A. J., Corr, C. A., Dibb, Jobson, B. T., Kolesar, K. R., Lack, D. A., Lerner, B. M., Li, J. E., Greenslade, M. E., Martin, R. F., Moore, R. H., Scheuer, S.-M., Mellon, D., Nuaaman, I., Olfert, J. S., Petaja, T., Quinn, E., Shook, M. A., Thornhill, K. L., Troop, D., Winstead, E. L., P. K., Song, C., Subramanian, R., Williams, E. J., and Zaveri, and Ziemba, L. D.: Spectral aerosol extinction (SpEx): a new R. A.: Radiative Absorption Enhancements Due to the Mixing instrument for in situ ambient aerosol extinction measurements State of Atmospheric Black Carbon, Science, 337, 1078–1081, across the UV/visible wavelength range, Atmos. Meas. Tech., 8, https://doi.org/10.1126/science.1223447, 2012. 4755–4771, https://doi.org/10.5194/amt-8-4755-2015, 2015. Chakrabarty, R. K., Moosmüller, H., Chen, L.-W. A., Lewis, K., Kebabian, P. L., Robinson, W. A., and Freedman, A.: Optical ex- Arnott, W. P., Mazzoleni, C., Dubey, M. K., Wold, C. E., Hao, tinction monitor using cw cavity enhanced detection, Rev. Sci. W. M., and Kreidenweis, S. M.: Brown carbon in tar balls from Instrum., 78, 063102, https://doi.org/10.1063/1.2744223, 2007. smoldering biomass combustion, Atmos. Chem. Phys., 10, 6363– Kirchstetter, T. W. and Thatcher, T. L.: Contribution of or- 6370, https://doi.org/10.5194/acp-10-6363-2010, 2010. ganic carbon to wood smoke particulate matter absorption Collaud Coen, M., Weingartner, E., Apituley, A., Ceburnis, D., of solar radiation, Atmos. Chem. Phys., 12, 6067–6072, Fierz-Schmidhauser, R., Flentje, H., Henzing, J. S., Jennings, S. https://doi.org/10.5194/acp-12-6067-2012, 2012. G., Moerman, M., Petzold, A., Schmid, O., and Baltensperger, Kondo, Y., Sahu, L., Kuwata, M., Miyazaki, Y., Takegawa, N., U.: Minimizing light absorption measurement artifacts of the Moteki, N., Imaru, J., Han, S., Nakayama, T., Oanh, N. T. K., Hu, Aethalometer: evaluation of five correction algorithms, Atmos. M., Kim, Y. J., and Kita, K.: Stabilization of the mass absorption Meas. Tech., 3, 457–474, https://doi.org/10.5194/amt-3-457- cross section of black carbon for filter-based absorption photom- 2010, 2010. etry by the use of a heated inlet, Aerosol Sci. Technol., 43, 741– Davies, N. W., Cotterell, M. I., Fox, C., Szpek, K., Haywood, J. 756, https://doi.org/10.1080/02786820902889879, 2009. M., and Langridge, J. M.: On the accuracy of aerosol photoa- Lack, D. A., Lovejoy, E. R., Baynard, T., Pettersson, A., and coustic spectrometer calibrations using absorption by ozone, At- Ravishankara, A. R.: Aerosol Absorption Measurement using mos. Meas. Tech., 11, 2313–2324, https://doi.org/10.5194/amt- Photoacoustic Spectroscopy: Sensitivity, Calibration, and Un- 11-2313-2018, 2018. certainty Developments, Aerosol Sci. Technol., 40, 697–708, Feng, Y., Ramanathan, V., and Kotamarthi, V. R.: Brown car- https://doi.org/10.1080/02786820600803917, 2006. bon: a significant atmospheric absorber of solar radiation?, At- Lack, D. A., Richardson, M. S., Law, D., Langridge, J. M., mos. Chem. Phys., 13, 8607–8621, https://doi.org/10.5194/acp- Cappa, C. D., McLaughlin, R. J., and Murphy, D. M.: Air- 13-8607-2013, 2013. craft Instrument for Comprehensive Characterization of Aerosol Fischer, D. A. and Smith, G. D.: Can ozone be used to calibrate Optical Properties, Part 2: Black and Brown Carbon Ab- aerosol photoacoustic spectrometers?, Atmos. Meas. Tech., 11, sorption and Absorption Enhancement Measured with Photo 6419–6427, https://doi.org/10.5194/amt-11-6419-2018, 2018a. Acoustic Spectroscopy, Aerosol Sci. Technol., 46, 555–568, Fischer, D. A. and Smith, G. D.: A portable, four-wavelength, https://doi.org/10.1080/02786826.2011.645955, 2012a. single-cell photoacoustic spectrometer for ambient Lack, D. A., Langridge, J. M., Bahreini, R., Cappa, C. D., Middle- aerosol absorption, Aerosol Sci. Technol., 52, 393–406, brook, A. M., and Schwarz, J. P.: Brown carbon and internal mix- https://doi.org/10.1080/02786826.2017.1413231, 2018b. ing in biomass burning particles, P. Natl. Acad. Sci. USA, 109, Forrister, H., Liu, J., Scheuer, E., Dibb, J., Ziemba, L., Thorn- 14802–14807, https://doi.org/10.1073/pnas.1206575109, 2012b. hill, K. L., Anderson, B., Diskin, G., Perring, A. E., Schwarz, Lack, D. A., Moosmüller, H., McMeeking, G. R., Chakrabarty, R. J. P., Campuzano-Jost, P., Day, D. A., Palm, B. B., Jimenez, K., and Baumgardner, D.: Characterizing elemental, equivalent J. L., Nenes, A., and Weber, R. J.: Evolution of brown car- black, and refractory black carbon aerosol particles: A review bon in wildfire plumes, Geophys. Res. Lett., 42, 4623–4630, of techniques, their limitations and uncertainties, Anal. Bioanal. https://doi.org/10.1002/2015GL063897, 2015. Chem., 406, 99–122, https://doi.org/10.1007/s00216-013-7402- Gysel, M., Laborde, M., Olfert, J. S., Subramanian, R., and Gröhn, 3, 2014. A. J.: Effective density of Aquadag and fullerene soot black car- Lee, H. J., Aiona, P. K., Laskin, A., Laskin, J., and Nizko- bon reference materials used for SP2 calibration, Atmos. Meas. rodov, S. A.: Effect of Solar Radiation on the Optical Proper- Tech., 4, 2851–2858, https://doi.org/10.5194/amt-4-2851-2011, ties and Molecular Composition of Laboratory Proxies of At- 2011. mospheric Brown Carbon, Environ. Sci. Technol., 48, 10217– Hansen, A. D. A., Rosen, H., and Novakov, T.: The aethalometer – 10226, https://doi.org/10.1021/es502515r, 2014. an instrument for the real-time measurement of optical absorp- Lin, G., Penner, J. E., Flanner, M. G., Sillman, S., Xu, tion by aerosol particles, Sci. Total Environ., 36, 191–196, 1984. L., and Zhou, C.: Radiative forcing of organic aerosol Jacobson, M. Z.: The short-term cooling but long- in the atmosphere and on snow: Effects of SOA and term global warming due to biomass burning, J. Cli- Atmos. Meas. Tech., 12, 3351–3363, 2019 www.atmos-meas-tech.net/12/3351/2019/
K. Foster et al.: A new approach to calibrating a photoacoustic absorption spectrometer                                                3363

  brown carbon, J. Geophys. Res.-Atmos., 119, 7453–7476,                Petzold, A. and Niessner, R.: Photoacoustic soot sensor for
  https://doi.org/10.1002/2013JD021186, 2014.                              in-situ black carbon monitoring, Appl. Phys., 63, 191–197,
Liu, J., Lin, P., Laskin, A., Laskin, J., Kathmann, S. M.,                 https://doi.org/10.1007/BF01095272, 1996.
  Wise, M., Caylor, R., Imholt, F., Selimovic, V., and Shilling,        Rosencwaig, A.: Photoacoustic Spectroscopy, Ann. Rev. Bio-
  J. E.: Optical properties and aging of light-absorbing sec-              phys. Bioeng., 46, 207–311, https://doi.org/10.1016/S0065-
  ondary organic aerosol, Atmos. Chem. Phys., 16, 12815–12827,             2539(08)60413-8, 1980.
  https://doi.org/10.5194/acp-16-12815-2016, 2016.                      Saleh, R., Hennigan, C. J., McMeeking, G. R., Chuang, W. K.,
Liu, S., Aiken, A. C., Gorkowski, K., Dubey, M. K., Cappa,                 Robinson, E. S., Coe, H., Donahue, N. M., and Robinson, A. L.:
  C. D., Williams, L. R., Herndon, S. C., Massoli, P., Fortner,            Absorptivity of brown carbon in fresh and photo-chemically aged
  E. C., Chhabra, P. S., Brooks, W. A., Onasch, T. B., Jayne,              biomass-burning emissions, Atmos. Chem. Phys., 13, 7683–
  J. T., Worsnop, D. R., China, S., Sharma, N., Mazzoleni, C.,             7693, https://doi.org/10.5194/acp-13-7683-2013, 2013.
  Xu, L., Ng, N. L., Liu, D., Allan, J. D., Lee, J. D., Flem-           Saleh, R., Robinson, E. S., Tkacik, D. S., Ahern, A. T., Liu,
  ing, Z. L., Mohr, C., Zotter, P., Szidat, S., and Prévôt, A.             S., Aiken, A. C., Sullivan, R. C., Presto, A. a., Dubey, M.
  S. H.: Enhanced light absorption by mixed source black and               K., Yokelson, R. J., Donahue, N. M., and Robinson, A.
  brown carbon particles in UK winter, Nat. Commun., 6, 1–11,              L.: Brownness of organics in aerosols from biomass burning
  https://doi.org/10.1038/ncomms9435, 2015.                                linked to their black carbon content, Nat. Geosci., 7, 1–4,
McMeeking, G. R., Fortner, E., Onasch, T. B., Taylor, J. W.,               https://doi.org/10.1038/ngeo2220, 2014.
  Flynn, M., Coe, H., and Kreidenweis, S. M.: Impacts of non-           Saleh, R., Marks, M., Heo, J., Adams, P. J., Donahue, N. M., and
  refractory material on light absorption by aerosols emitted from         Robinson, A. L.: Contribution of brown carbon and lensing to
  biomass burning, J. Geophys. Res.-Atmos., 119, 12272–12286,              the direct radiative effect of carbonaceous aerosols from biomass
  https://doi.org/10.1002/2014JD021750, 2014.                              and biofuel burning emissions, J. Geophys. Res.-Atmos., 120,
Moosmüller, H., Chakrabarty, R. K., and Arnott, W. P.: Aerosol light       10285–10296, https://doi.org/10.1002/2015JD023697, 2015.
  absorption and its measurement: A review, J. Quant. Spectrosc.        Singh, S., Fiddler, M. N., Smith, D., and Bililign, S.:
  Ra., 110, 844–878, https://doi.org/10.1016/j.jqsrt.2009.02.035,          Error analysis and uncertainty in the determination of
  2009.                                                                    aerosol optical properties using cavity ring-down spec-
Moosmüller, H., Chakrabarty, R. K., Ehlers, K. M., and Arnott,             troscopy, integrating nephelometry, and the extinction-minus-
  W. P.: Absorption Ångström coefficient, brown carbon, and                scattering method, Aerosol Sci. Technol., 48, 1345–1359,
  aerosols: basic concepts, bulk matter, and spherical particles, At-      https://doi.org/10.1080/02786826.2014.984062, 2014.
  mos. Chem. Phys., 11, 1217–1225, https://doi.org/10.5194/acp-         Ugelow, M. S., Zarzana, K. J., Day, D. A., Jimenez, J. L., and Tol-
  11-1217-2011, 2011.                                                      bert, M. A.: The optical and chemical properties of discharge
Müller, T., Henzing, J. S., de Leeuw, G., Wiedensohler, A.,                generated organic haze using in-situ real-time techniques, Icarus,
  Alastuey, A., Angelov, H., Bizjak, M., Collaud Coen, M., En-             294, 1–13, https://doi.org/10.1016/j.icarus.2017.04.028, 2017.
  gström, J. E., Gruening, C., Hillamo, R., Hoffer, A., Imre, K.,       Washenfelder, R. A., Flores, J. M., Brock, C. A., Brown, S. S., and
  Ivanow, P., Jennings, G., Sun, J. Y., Kalivitis, N., Karlsson, H.,       Rudich, Y.: Broadband measurements of aerosol extinction in
  Komppula, M., Laj, P., Li, S.-M., Lunder, C., Marinoni, A., Mar-         the ultraviolet spectral region, Atmos. Meas. Tech., 6, 861–877,
  tins dos Santos, S., Moerman, M., Nowak, A., Ogren, J. A., Pet-          https://doi.org/10.5194/amt-6-861-2013, 2013.
  zold, A., Pichon, J. M., Rodriquez, S., Sharma, S., Sheridan,         Wei, Y., Ma, L., Cao, T., Zhang, Q., Wu, J., Buseck, P.
  P. J., Teinilä, K., Tuch, T., Viana, M., Virkkula, A., Weingart-         R., and Thompson, J. E.: Light Scattering and Extinc-
  ner, E., Wilhelm, R., and Wang, Y. Q.: Characterization and in-          tion Measurements Combined with Laser-Induced Incan-
  tercomparison of aerosol absorption photometers: result of two           descence for the Real-Time Determination of Soot Mass
  intercomparison workshops, Atmos. Meas. Tech., 4, 245–268,               Absorption Cross Section, Anal. Chem., 85, 9181–9188,
  https://doi.org/10.5194/amt-4-245-2011, 2011.                            https://doi.org/10.1021/ac401901b, 2013.
Nakayama, T., Sato, K., Matsumi, Y., Imamura, T., Yamazaki,             Weingartner, E., Saathoff, H., Schnaiter, M., Streit, N., Bit-
  A., and Uchiyama, A.: Wavelength and NOx dependent com-                  nar, B., and Baltensperger, U.: Absorption of light by
  plex refractive index of SOAs generated from the pho-                    soot particles: Determination of the absorption coefficient
  tooxidation of toluene, Atmos. Chem. Phys., 13, 531–545,                 by means of aethalometers, J. Aerosol Sci., 34, 1445–1463,
  https://doi.org/10.5194/acp-13-531-2013, 2013.                           https://doi.org/10.1016/S0021-8502(03)00359-8, 2003.
Ogren, J. A., Wendell, J., Andrews, E., and Sheridan, P. J.: Con-       Zangmeister, C. D. and Radney, J. G.: NIST interlabo-
  tinuous light absorption photometer for long-term studies, At-           ratory study of aerosol absorption measurements us-
  mos. Meas. Tech., 10, 4805–4818, https://doi.org/10.5194/amt-            ing photoacoustic spectroscopy, Tech. Note 1989,
  10-4805-2017, 2017.                                                      https://doi.org/10.6028/NIST.TN.1989, 2018.
Onasch, T. B., Massoli, P., Kebabian, P. L., Hills, F. B., Bacon,
  F. W., and Freedman, A.: Single Scattering Albedo Monitor
  for Airborne Particulates, Aerosol Sci. Technol., 49, 267–279,
  https://doi.org/10.1080/02786826.2015.1022248, 2015.

www.atmos-meas-tech.net/12/3351/2019/                                                      Atmos. Meas. Tech., 12, 3351–3363, 2019
You can also read


