A Novel Nine-lncRNA Risk Signature Correlates With Immunotherapy in Hepatocellular Carcinoma
←
→
Page content transcription
If your browser does not render page correctly, please read the page content below
ORIGINAL RESEARCH
                                                                                                                                               published: 15 September 2021
                                                                                                                                              doi: 10.3389/fonc.2021.706915

                                              A Novel Nine-lncRNA Risk Signature
                                              Correlates With Immunotherapy in
                                              Hepatocellular Carcinoma
                                              Ye Nie 1,2†, Jianhui Li 1,2†, Wenlong Wu 2†, Dongnan Guo 3, Xinjun Lei 1,2, Tianchen Zhang 1,2,
                                              Yanfang Wang 1,2, Zhenzhen Mao 1,2, Xuan Zhang 2 and Wenjie Song 2*
                                              1 Xi’an Medical University, Xi’an, China, 2 Department of Hepatobiliary Surgery, Xijing Hospital, The Fourth Military Medical

                                              University, Xi’an, China, 3 School of Pharmacy, Health Science Center, Xi’an Jiaotong University, Xi’an, China

                           Edited by:         Background: Hepatocellular carcinoma is one of the most common malignant tumors
                       Rifat Hamoudi,         with a very high mortality rate. The emergence of immunotherapy has brought hope for the
                 University of Sharjah,
                 United Arab Emirates
                                              cure of hepatocellular carcinoma. Only a small number of patients respond to immune
                        Reviewed by:
                                              checkpoint inhibitors, and ferroptosis and tertiary lymphoid structure contribute to the
                        Bernd Heinrich,       increased response rate of immune checkpoint inhibitors; thus, we first need to identify
    National Institutes of Health (NIH),
                                              those who are sensitive to immunotherapy and then develop different methods to improve
                          United States
                         Leifeng Chen,        sensitivity for different groups.
         Second Affiliated Hospital of
          Nanchang University, China
                                              Methods: The sequencing data of hepatocellular carcinoma from The Cancer Genome
                  *Correspondence:
                                              Atlas and Gene Expression Omnibus was downloaded to identify the immune-related long
                        Wenjie Song           non-coding RNAs (lncRNAs). LncRNAs related to survival data were screened out, and a
              surgeon2002@163.com
                                              risk signature was established using Cox proportional hazard regression model. R
     †
      These authors have contributed
                                              software was used to calculate the riskScore of each patient, and the patients were
       equally to this work and share
                       first authorship        divided into high- and low-risk groups. The prognostic value of riskScore and its
                                              application in clinical chemotherapeutic drugs were confirmed. The relationship
                   Specialty section:         between riskScore and immune checkpoint genes, ferroptosis genes, and genes
         This article was submitted to
                      Cancer Immunity
                                              related to tertiary lymphoid structure formation was analyzed by Spearman method.
                  and Immunotherapy,          TIMER, CIBERSORT, ssGSEA, and ImmuCellAI were used to evaluate the relative number
               a section of the journal
                                              of lymphocytes in tumor. The Wilcoxon signed-rank test confirmed differences in
                 Frontiers in Oncology
                                              immunophenoscore between the high- and low-risk groups.
            Received: 13 May 2021
        Accepted: 24 August 2021              Results: Data analysis revealed that our signature could well predict the 1-, 2-, 3-, and 5-
     Published: 15 September 2021
                                              year survival rates of hepatocellular carcinoma and to predict susceptible populations with
                            Citation:
    Nie Y, Li J, Wu W, Guo D, Lei X,
                                              Sorafenib. The risk signature were significantly correlated with immune checkpoint genes,
  Zhang T, Wang Y, Mao Z, Zhang X             ferroptosis genes, and tertiary lymphoid structure-forming genes, and predicted tumor-
         and Song W (2021) A Novel
                                              infiltrating lymphocyte status. There was a significant difference in IPS scores between the
         Nine-lncRNA Risk Signature
     Correlates With Immunotherapy            low-risk group and the high-risk group, while the low-risk group had higher scores.
        in Hepatocellular Carcinoma.
            Front. Oncol. 11:706915.
                                              Conclusion: The riskScore obtained from an immune-related lncRNA signature could
    doi: 10.3389/fonc.2021.706915             successfully predict the survival time and reflect the efficacy of immune checkpoint

Frontiers in Oncology | www.frontiersin.org                                            1                                     September 2021 | Volume 11 | Article 706915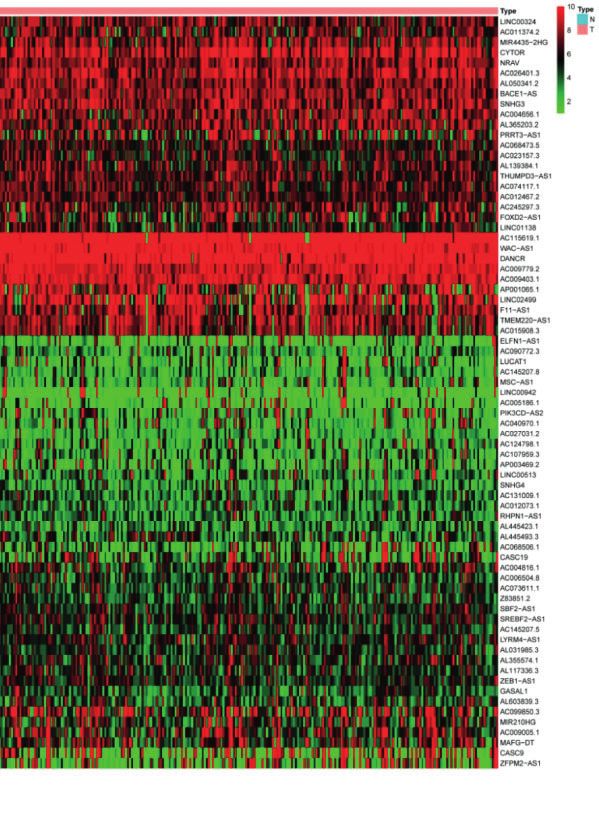
Nie et al.                                                                                                     Screening Sensitive Population for Immunotherapy

                                              inhibitors. More importantly, it is possible to select different treatments for different
                                              hepatocellular carcinoma patients that increase the response rate of immune checkpoint
                                              inhibitors and will help improve the individualized treatment of hepatocellular carcinoma.
                                              Keywords: hepatocellular carcinoma, prognosis, tumor-infiltrating lymphocytes, immunotherapy response, tertiary
                                              lymphoid structure, ferroptosis

INTRODUCTION                                                                         lncRNA CYTOR upregulates the expression of oncogene
                                                                                     KIAA1522, which in turn affects the proliferation, apoptosis,
Hepatocellular carcinoma (HCC) ranks the fourth in mortality                         and cell cycle of HCC cells (21).
among malignant tumors (1). Viral infection, aflatoxin exposure,                         The current problem of immunotherapy is that the response
smoking, and heavy alcohol consumption are common                                    rate is low. In the face of this problem, we first need to find out
pathogenic factors leading to HCC (2). Areas including North                         the population with high sensitivity and then develop different
and West part of Africa and East Southeast part of Asia have a                       methods to improve sensitivity for different groups, so as to
high incidence of HCCs (3, 4). In China, the 5-year survival rate                    achieve the effect of long-term survival or tumor cure. Therefore,
is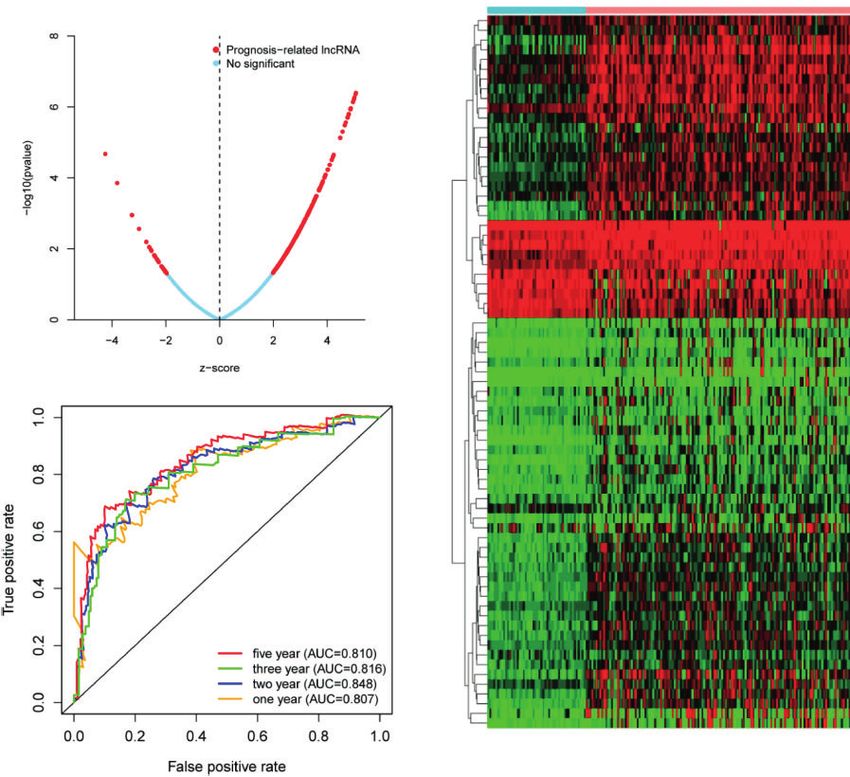
Nie et al.                                                                                          Screening Sensitive Population for Immunotherapy

status distribution maps, and heatmaps of the risk gene                    Analysis of Genes Related to
expression profiles were generated to further examine the                   TLS Formation
reliability of the signature.                                              The TLS helps to improve the immunotherapy response rate, so
                                                                           we explored whether genes related to TLS formation (CCL2,
Analysis of Clinicopathological Parameters                                 CCL3, CCL4, CCL5, CCL8, CCL18, CCL19, CCL21, CXCL9,
The pathological parameters were analyzed by Cox regression                CXCL10, CXCL11, CXCL13, and IL7) were associated with
analysis. At the same time, the Wilcoxon signed-rank test was              the signature.
used to evaluate whether the riskScore was different among the
groups of pathological parameters, and the chi-square test was             Analysis of Ferroptosis-Related Genes
used to analyze the relationship between clinicopathological               Ferroptosis-related genes were collected from the GSEA database
parameters and the signature.                                              (M39768), and genes associated with survival (p < 0.05) were
                                                                           selected for further analysis.
Enrichment Analysis                                                        Statistical Analysis
Messenger RNAs (mRNAs) associated with risk genes were                     All statistical analysis and plots were performed with R (R x64
screened according to the principle of coexpression, and then              4.0.3 version; https://www.r-project.org/). A p-value
test was used to compare the differences between the two groups.           0.4, p < 0.001) were obtained by Spearman correlation analysis,
Visualization of the results was performed using pRRophetic                of which 250 had significant effects on survival time (p <
and ggplot2.                                                               0.05) (Figure 1A).

Analysis of TILs                                                           Signature Identification
To determine whether the signature is associated with                      We selected 73 irlncRNAs (Figure 1B) associated with survival (p <
lymphocyte infiltration, we used the currently recognized                   0.0002) for Cox proportional hazard regression model screening.
online analysis websites TIMER (https://cistrome.shinyapps.io/             Finally, nine differentially expressed genes (LINC00324, MSC-AS1,
timer/), CIBERSORT (http://cibersort.stanford.edu/), ssGSEA,               AC023157.3, AC009005.1 PRRT3-AS1, AC015908.3, AC145207.5,
and ImmuCellAI (http://bioinfo.life.hust.edu.cn) to calculate              AL031985.3, and TMEM220-AS1) were selected to construct the
the degree of tumor lymphocyte infiltration in each sample.                 signature. All patients were randomly divided into high-risk group
The correlation between the riskScore and TILs was tested by the           (172 cases) and low-risk group (171 cases) according to the median
Spearman test. The CIBERSORT results were used to evaluate                 value of riskScore calculated by R software.
the associations among TILs using Spearman analysis.
                                                                           Verification of the Prediction Ability of
Analysis of the Clinical Relevance of                                      the Signature
Immunotherapy                                                              First of all, 343 patients were randomly put into a training set (83
The immunophenoscore is calculated based on the expression of              high-risk cases and 89 low-risk cases) and a testing set (89 high-
various important immune molecules in the TME, including                   risk cases, 82 low-risk cases). Second, the training set
major histocompatibility complex (MHC) molecules, immune                   (Figures 2A–E), the testing set (Figures 3A–E) and the
regulatory factors, effector cells, and suppressor cells, which can        external validation set (29 high-risk cases, 30 low-risk cases)
well reflect the response rate of ICI. In addition, immune                  (Figures 4A–E) were used to generate Kaplan–Meier survival
checkpoint gene expression is associated with the response to              curves, multi-index ROC curves, risk curves, survival status
ICI; therefore, we analyzed the correlation among immune                   distribution maps, and the heatmaps of risk genes expression
checkpoint genes and the IPS and the signature.                            profiles. The results of the survival curves showed that patients in

Frontiers in Oncology | www.frontiersin.org                            3                               September 2021 | Volume 11 | Article 706915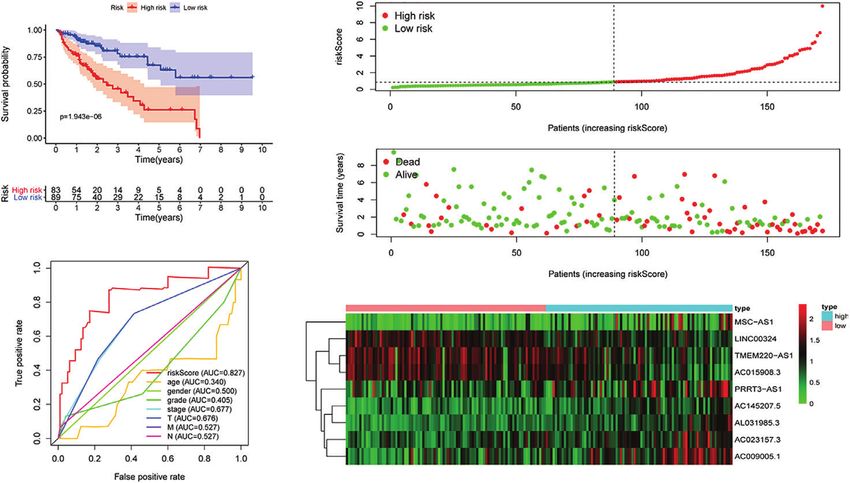
Nie et al.                                                                                                             Screening Sensitive Population for Immunotherapy

                          A                                   B

                         C

  FIGURE 1 | (A) The lncRNAs used to build the signature and the ability of the signature to predict the survival time. (B) LncRNAs associated with survival time.
  (C) The predictive ability of the signature for 1, 2, 3, and 5 years.

                         A                                           C

                                                                     D

                         B

                                                                     E

  FIGURE 2 | The signature of hepatocellular carcinoma (HCC) from the training set. (A) Kaplan–Meier survival curves, (B) multi-index ROC curves, (C) risk curves,
  (D) survival status distribution map, and (E) heatmap of the risk gene expression profiles.

the low-risk group had significantly longer overalls survival time.                      at 1 year (AUC = 0.807), 2 years (AUC = 0.848), 3 years (AUC =
The comparison of the area under the multi-index ROC curve                              0.816), and 5 years (AUC = 0.810) (Figure 1C) demonstrated the
revealed that the riskScore was better able to predict survival time                    strong ability of the signature in predicting survival time. All of
than the traditional stage-by-stage method. Finally, to verify                          the above results showed that our signature has a high
whether the signature was applicable to both the early and late                         application value and reliability.
stages of HCC, we drew the corresponding survival curves for
both stages (Figures 5A, B). The results show that the high-risk                        Pathological Parameter Analysis
group has significant difference with the low-risk group in                              Cox regression analysis was used to analyze clinicopathological
survival time. In addition, areas under the ROC curve (AUCs)                            parameters (age, gender, survival status, grade, stage, T, N, M).

Frontiers in Oncology | www.frontiersin.org                                         4                                    September 2021 | Volume 11 | Article 706915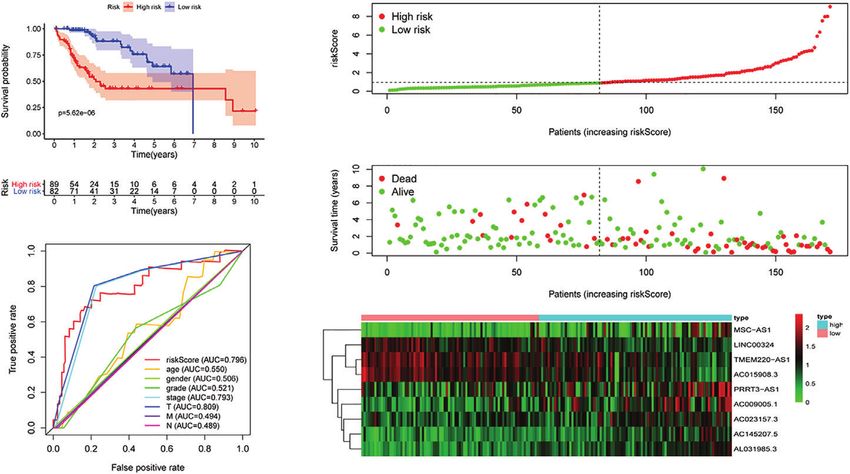
Nie et al.                                                                                                             Screening Sensitive Population for Immunotherapy

                            A                                        C

                                                                     D

                            B

                                                                     E

  FIGURE 3 | The signature of HCC from the testing set. (A) Kaplan–Meier survival curves, (B) multi-index ROC curves, (C) risk curves, (D) survival status distribution
  map, and (E) heatmap of the risk genes expression profiles.

                        A                                            C

                                                                     D

                        B

                                                                     E

  FIGURE 4 | The signature of HCC from the external validation set. (A) Kaplan–Meier survival curves, (B) multi-index ROC curves, (C) risk curves, (D) survival status
  distribution map, and (E) heatmap of the risk genes expression profiles.

The results are shown in Table 1. In addition, we used the chi-                         Enrichment Analysis
square test to verify the correlation between clinicopathological                       Exploring the biological functions of risk genes is helpful to
parameters and the riskScore (Figure 6A, ***p < 0.001,                                  understand their potential molecular mechanisms in
**p < 0.01, and *p < 0.05). Survival status, grade, stage,                              tumorigenesis and development and can provide new targets for
gender, and T stage were highly correlated to the riskScore,                            the treatment of HCC. According to the principle of coexpression, a
which was an independent prognostic factor. Then, to explore                            total of 606 genes associated with risk genes (R > 0.4, p < 0.05) were
the difference in riskScores between different groups, we used                          identified, of which 604 were significantly differentially expressed.
the Wilcoxon signed-rank test. Results are presented in                                 First, the significantly differentially expressed genes with a
Figures 6B–F.                                                                           correlation coefficient >0.99 were selected for visualization

Frontiers in Oncology | www.frontiersin.org                                         5                                    September 2021 | Volume 11 | Article 706915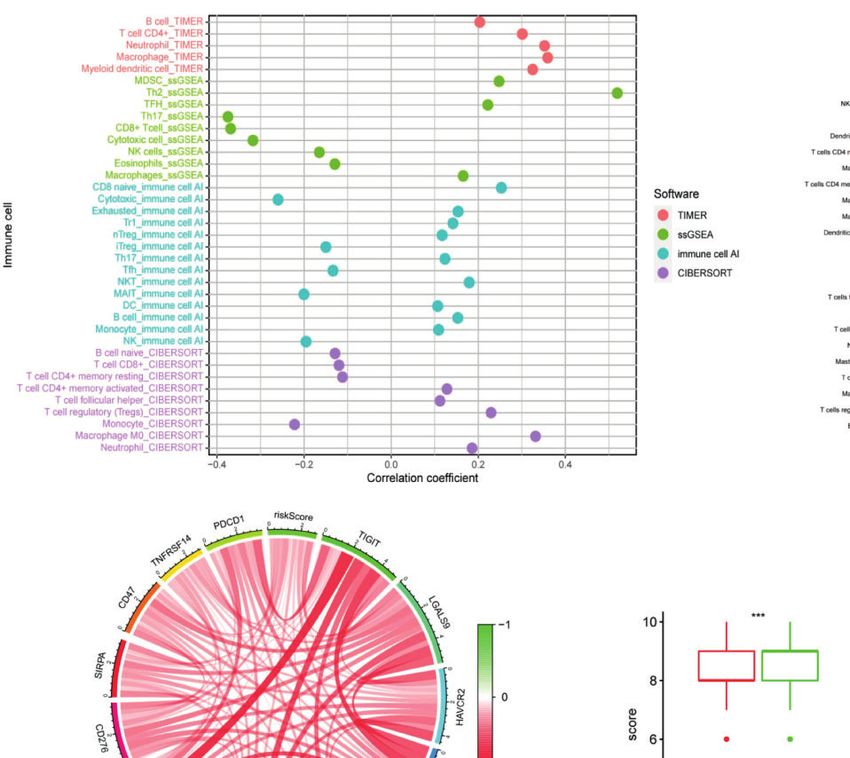
Nie et al. Screening Sensitive Population for Immunotherapy
A B
FIGURE 5 | (A) Survival curve of early patients and (B) survival curve of advanced patients.
TABLE 1 | Univariate and multivariate Cox regression analyses in each patient set.
Variables Univariate analysis Multivariate analysis
HR (95% CI) p-value HR (95% CI) p-value
Training set
Age 0.98 (0.95,1.01) 0.14
Gender 1.01 (0.48,2.14) 0.98
Grade 0.81 (0.50,1.32) 0.40
Stage 1.55 (1.06,6.26) 0.02
T 1.49 (1.04,2.14) 0.03
M 6.66 (1.55,28.58) 0.01
N 2.42 (0.33,17.90) 0.390
riskScore 1.52 (1.30,1.78) 9.84E−08 1.61 (1.33,1.95) 1.16E−06
Testing set
Age 1.01 (0.99,1.04) 0.35
Gender 0.59 (0.31,1.14) 0.12
Grade 1.20 (0.78,1.86) 0.40
Stage 2.66 (1.83,3.88) 3.46E−07
T 2.50 (1.79,3.50) 9.42E−08
M 2.25 (0.31,16.59) 0.43
N 1.37 (0.19,10.04) 0.76
riskScore 1.36 (1.22,1.51) 4.51E−08 1.28 (1.14,1.45) 6.06E−05
External validation set
Age 0.75 (0.29,1.93) 0.55
Gender 1.07 (0.86,4.92) 0.07
Stage 1.67 (1.15,4.25) 0.03 3.02 (1.02,8.90) 0.04
riskScore 4.51 (2.13,6.37) 0 5.53 (4.13,6.37) 0
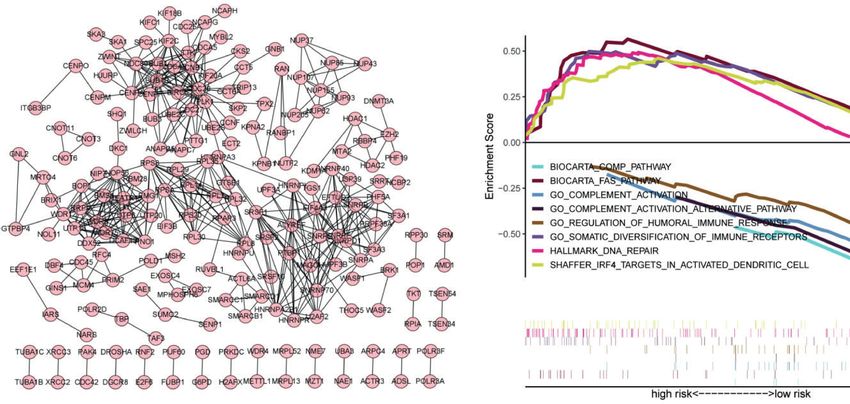
(Figure 7A). The molecules CDC20, NOP56, SNRPG, SNRPF, to sorafenib, but there was no significant difference in the
BUB1B, and BMS1 were at the core of the protein interaction response to vincristine or cisplatin.
network. Second, to understand the carcinogenic mechanism of risk
genes, coexpressed proteins were subjected to enrichment analysis. Analysis of TILs
The results of Gene Ontology (GO) database enrichment analysis LncRNAs regulate immune-related genes that affect the TILs, which
are shown in Figures 8A, B. The outcomes of the Kyoto are terminal targets of ICI. Therefore, we explored whether there
Encyclopedia of Genes and Genomes (KEGG) database was a correlation between TILs and the riskScore. Results of
enrichment analysis are shown in Figures 8C, D. The results CIBERSORT, TIMER, ImmuCellAI, and ssGSEA are shown in
(Figure 7B) of GSEA suggested the importance of the risk genes Figure 10A. Exhausted cells, macrophages, myeloid-derived
for immune pathway regulation and showed that the high-risk suppressor cells (MDSCs), Treg cells, neutrophils, and eosinophils
group was in a state of immunosuppression. were positively correlated with the riskScore. Negative correlations
were observed among Th17 cells, CD8+ T cells, cytotoxic T cells,
Application of the Signature in NK cells, and mucosal-associated invariant T (MAIT) cells with the
Clinical Treatment riskScore. In addition, the CIBERSORT analysis results showed a
The results of the IC50 analysis of chemotherapeutic drugs are correlation among lymphocytes (Figure 10B). There was a weak to
shown in Figure 9. The low-risk group showed a better response moderate correlation among various lymphocytes in the TME.
Frontiers in Oncology | www.frontiersin.org 6 September 2021 | Volume 11 | Article 706915
Nie et al.                                                                                                             Screening Sensitive Population for Immunotherapy

                              A

                              B                                                         E

                              C                                                          F

                              D

  FIGURE 6 | Clinical Evaluation by the Signature. A strip chart (A) along with the scatter diagram showed that survival status (B), gender (C), tumor grade (D),
  clinical stage (E), and T stage (F) were significantly associated with the riskScore (P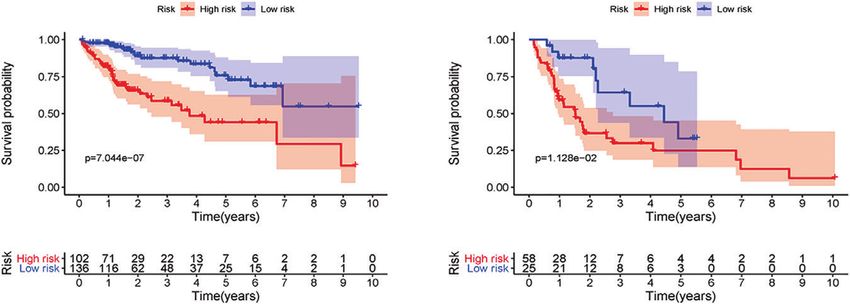
Nie et al.                                                                                                         Screening Sensitive Population for Immunotherapy

                         A                                                           B

  FIGURE 7 | Protein–protein interaction networks and GSEA indicates the enrichment of significant pathways. (A) Protein–protein interaction networks. Each dot
  represents a protein molecule, and the connection between the dots means that the two molecules interact with each other. (B) Significant immune-related
  pathways enriched by GSEA.

                             A                                                       B

                             C                                                       D

  FIGURE 8 | Enrichment analysis. (A, B) The significantly enriched GO terms and (C, D) KEGG pathways. The abscissa indicates the number and ratio of genes
  enriched in the pathway.

Exploring Tertiary Lymphoid                                                              riskScore. The data showed that the high risk group was
Structure-Related Genes                                                                  genetically predisposed to form TLS, so the patients in the
The TLS, an important part of the TME, has the ability to                                high-risk group were more likely to achieve a high response
enhance the immune response to treatment. The genes related to                           rate of immunotherapy through TLS in the future.
TLS formation of CCL2, CCL3, CCL4, CCL5, CCL8, CCL19,
CCL21, CXCL10, CXCL13, and IL7 were positively correlated                                Analysis of Ferroptosis-Related Genes
with the riskScore (Figure 11A). Negative correlations were                              Previous studies have shown that ferroptosis increases the
observed among CCL18, CXCL9, and CXCL11 with the                                         response to immunotherapy to enhance efficacy and inhibit

Frontiers in Oncology | www.frontiersin.org                                      8                                   September 2021 | Volume 11 | Article 706915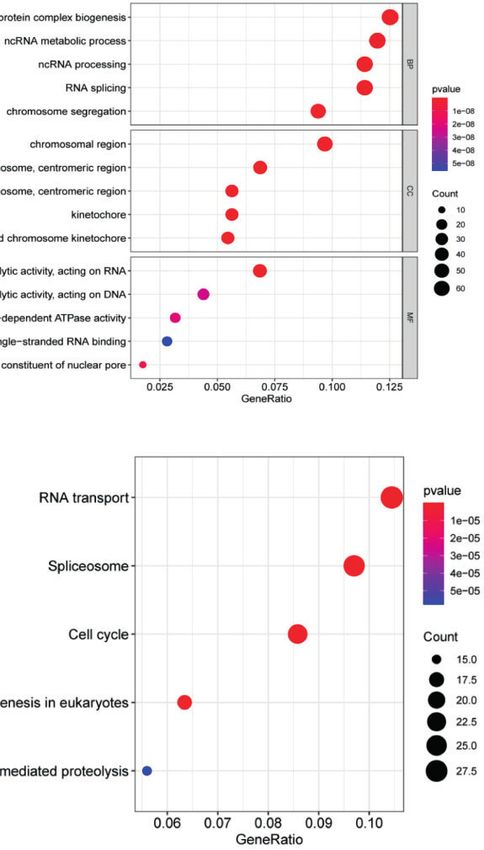
Nie et al.                                                                                                             Screening Sensitive Population for Immunotherapy

                               A                                                          B

                               C

  FIGURE 9 | The signature can be used as a potential indicator to predict the sensitivity to sorafenib, and the sorafenib IC50 was higher in the high-risk group.

                        A                                                                      B

                        C                                                        D

  FIGURE 10 | The signature was used to evaluate tumor-infiltrating lymphocytes, immunophenoscore (IPS), and immune checkpoint genes. (A) Spearman correlation
  analysis was used to calculate the correlation between the riskScore and the number of tumor-infiltrating lymphocytes. (B) Correlation heatmap of 22 tumor-
  infiltrating lymphocytes. (C) Analysis of the correlation between the riskScore and immune checkpoint genes. (D) The IPS, IPS-PD1 blocker, IPS–CTLA4 blocker, and
  IPS–PD1–CTLA4 blocker values are higher in the low risk group. (P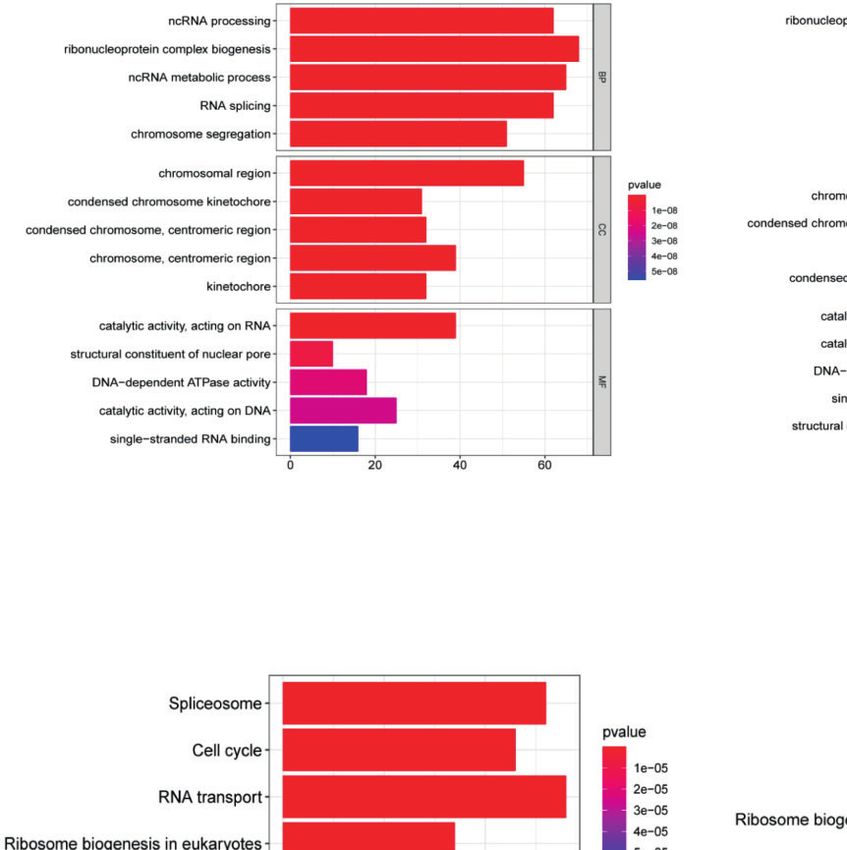
Nie et al.                                                                                                        Screening Sensitive Population for Immunotherapy

                        A                                                      B

                        C

  FIGURE 11 | (A) Correlation between signature and genes related to tertiary lymphoid structure formation was calculated by Spearman. (B) Correlation between
  riskScore and ferroptosis-related genes was calculated by Spearman. (C) Ferroptosis-related gene univariate Cox regression analysis.

tumor progression. Therefore, we analyzed the correlation                            signature cannot only identify people who are sensitive to ICI but
between the signature and ferroptosis-related genes, which                           also select different methods to improve the response rate of ICI
presented a positive correlation between the riskScore and the                       for different populations.
expression of ACSL3, ATG5, ATG7, CYBB, FTH1, FTL, GCLM,                                 LINC00324 regulates FasL and PU.1 to promote the
GSS, HMOX1, PCBP2, PRNP, SLC3A2, SLC7A11, TFRC, and                                  biological behavior proliferation, invasion, metastasis, and
VDAC2, respectively (Figure 11B). However, the expression of                         apoptosis of HCC stem cells (28). PRRT3-AS1 controls the
ACSL6 and SAT1 were negatively correlated with the riskScore,                        mTOR signaling pathway to promote the invasion and
respectively. The above analysis revealed that the greater the                       metastasis and inhibits the autophagy and apoptosis of
riskScore, the weaker the degree of ferroptosis. The results of the                  prostate cancer cells (29). MSC-AS1 induces PGK1 expression
COX univariate analysis of ferroptosis-related genes are shown                       and accelerates the progression of HCC (30). In addition, MSC-
in Figure 11C.                                                                       AS1 has a similar role in gliomas (31), gastric cancer (32), renal
                                                                                     clear cell carcinoma (33), and pancreatic cancer (34).
                                                                                     TMEM220-AS1, AC015908.3, AC009005.1, and AL031985.3
DISCUSSION                                                                           have been reported in a signature predictive of overall survival.
                                                                                     AC145207.5 and AC023157.3 are reported here for the first time.
Increasing evidence demonstrated that lncRNAs seriously affect                       The survival curve was generated by the riskScore, and the results
the occurrence, development, and metastasis of HCC and play an                       showed that the high-risk group has a significantly lower overall
indispensable part in TME’s regulation process (22–24). The                          survival rate than the low-risk group. To validate the predictive
TME is not only related to the occurrence and development of                         ability of the signature, the areas under the ROC curve were
cancers but also highly related to the response to ICI (25). At                      calculated as AUC(1 year) = 0.807, AUC(2 year) = 0.848, AUC(3
present, among the many treatment schemes for HCC,                                   year) = 0.816, and AUC(5 year) = 0.810, suggesting that the
immunotherapy is the most popular choice and the most likely                         ability of our signature to predict overall survival was accurate
new therapy to make a considerable difference in patient                             and fines. Cox univariate and multivariate analyses revealed that
outcomes. The future of HCC treatment is likely to involve                           the riskScore was an independent prognostic factor.
immunotherapy combined with targeted therapy (26, 27). The                              Better understanding of the TME will help develop new
postoperative recurrence and mortality rates of patients with                        methods to modify the TME or treat HCC resulting in
HCC are high; the effective rate of ICI therapy is low. Our                          improving the response rate and efficacy of immunotherapy (35).

Frontiers in Oncology | www.frontiersin.org                                     10                                   September 2021 | Volume 11 | Article 706915
Nie et al. Screening Sensitive Population for Immunotherapy
At the same time, it will lay a solid foundation for the future in the low-risk group, indicating that the riskScore is the
implementation of immunotherapy combined targeted therapy. representative immunogenicity of TME in HCC. Higher gene
ICI rely on TILs against tumor cells. Therefore, we used expression level of immune checkpoint is one of the causes of an
CIBERSORT (36), ImmuCellAI (37), TIMER (38), and ssGSEA immunosuppressive state. According to a previous investigation,
(39) to evaluate the relative number of TILs in each patient. As the anti-CTLA4 and anti-PD-1 treatment reactivated the antitumor
we expected, some of the lymphocytes showed differences immune response in the TME of HCC (48), and the expression of
between the two groups. Exhausted cells, macrophages, Treg immune checkpoint genes was associated with the response to ICI
cells, neutrophils, MDSCs, and eosinophils were more common (8). Our results demonstrated that the expression levels of CD276,
in the high-risk group, while CD8+ T cells, cytotoxic T cells, SIRPA, CD47, TNFRSF14, PDCD1, CTLA4, TIGIT, LGALS9,
natural killer (NK) cells, Th17 cells, and MAIT cells were more HAVCR2, CD86, CD274, CD80, and PVR increased in the high
common in the low-risk group. Studies have found that the risk group. The above results showed that the low-risk group of
exhausted cells have a positive impact on the poor prognosis, and patients is more sensitive to treatment with ICI.
the completely exhausted CD8+ T cells do not respond to ICI Only about 40% of patients with HCC have TLS within the
(40, 41). Macrophages could increase the proliferation of HCC tumor. Recent studies have reported that TLS, which have a similar
stem cells through the IL-6/STAT3 signaling pathway and then function to the lymph node, enhance the sensitivity to ICI therapy
promote tumor growth (42). Treg cells regulate the expression of (6). Therefore, the relationship between the molecules related to the
CTLA-4, PD-1, and TGF-b to directly bind with the formation of TLS and the signature was analyzed. Genes related to
corresponding receptors on target cells and inhibit the the formation of TLS, including CCL2, CCL3, CCL4, CCL5, CCL8,
expression of the important cytokines interferon-gamma (IFN- CCL19, CCL21, CXCL10, CXCL13, and IL7, were positively
g), tumor necrosis factor-a (TNF-a), and IL-2 that affect T cells. correlated with the riskScore, which indicated that patients in the
In addition, tumor cells regulate chemokine receptor 28 high-risk group had a genetic advantage informing TLS. In the
(CCL28), thus recruiting Treg cells, enhancing the immune future, combining ICI with tertiary lymphoid structure-targeting
tolerance, and promoting the angiogenesis (43). The migration therapy may improve the prognosis of patients; this gives patients
of neutrophils to tumors is mainly mediated by CXC chemokine who are not sensitive to ICI the opportunity to cure their tumors.
binding to CXCR1 and CXCR2, which can promote tumor Ferroptosis enhances the effectiveness of ICI and inhibits the
growth, invasion, angiogenesis, and metastasis (44). CD8+ T tumor progression (17). The expression of IFN-g regulatory system
cells are positively correlated not only with good prognosis but X-c secreted by cytotoxic T cells enhances the sensitivity to ferroptosis
also with the ICI response. Cytotoxic T cells specifically (16). This suggests that ICI combined with ferroptosis inducers may
recognize the endogenous peptide MHC I complexes and kill become a new strategy for the treatment of cancer in the future. We
tumor cells by expressing FasL or secreting TNF-a (43). The analyzed 17 ferroptosis genes associated with the prognosis of HCC,
number of tumor-infiltrating NK cells positively correlated with of which 15 were positively correlated with the riskScore and 2 were
the prognosis of HCC patients (45). Our results support the negatively correlated. This suggests that the signature is fully capable
above conclusions. Considerable evidence shows that the TME is of predicting tumor sensitivity to ferroptosis. In addition, in our study,
a whole, and all kinds of lymphocytes in the TME interact with the proportion of cytotoxic T cells in the low-risk group was
each other (46). Our research results are consistent with this significantly higher than that in the high-risk group. All this
view. Therefore, the accuracy of analysis of the prognostic value evidence suggests that patients in the low-risk group were not only
of a certain type of cells alone is far lower than that of a combined more sensitive to ICI but also likely to be cured of their tumors by
multicell analysis. Studies that focus only on a specific kind of targeting ferroptosis in combination with immunotherapy.
lymphocyte provide only a one-sided understanding of the TME It is important to recognize the shortcomings of the signature
and which cannot achieve a comprehensive, let alone a real, developed in this study: in clinical practice, screening out
understanding of the TME. There were relatively few CD8+ T different treatments based on riskScore does not simply divide
cells in the high-risk group, which may be one of reasons why into high- and low-expression groups but requires more detailed
more dendritic cells and shorter overall survival times were subdivision. In future work, we need to collect more data to
associated with the high-risk group. Moreover, our research further verify the reliability of the findings.
found that there were more immunosuppressive cells and
evading immune surveillance signals in the high-risk group,
while more immune-enhancing cells and complement DATA AVAILABILITY STATEMENT
activation signals were found in the low-risk group. These
The data presented in the study are deposited in the FigShare
observations revealed that the low-risk group is characterized
repository, accession link: https://figshare.com/s/93afe076e2ed13d32f4d.
by the immune activity and the inhibition of tumor progression.
It also partially explained why the high-risk group is in a state
of immunosuppression. AUTHOR CONTRIBUTIONS
It has been reported that the IPS is a good predictor for the
response of ICI (47), so we investigated the correlation between WJS and YN conceived of and designed the study. YN, JHL,
the IPS and the riskScore. IPS, IPS−PD1 blocker, IPS−CTLA4 WLW, DNG and WJS performed the literature search, generated
blocker, and IPS–PD1–CTLA4 blocker were significantly higher the figures and tables, and wrote the manuscript. JHL, WLW,
Frontiers in Oncology | www.frontiersin.org 11 September 2021 | Volume 11 | Article 706915Nie et al. Screening Sensitive Population for Immunotherapy
XJL, TCZ, ZZM and YFW collected and analyzed the data, and FUNDING
critically reviewed the manuscript. WJS, YN, and DNG
supervised the study and reviewed the manuscript. All authors This study was supported by the National Natural Science
contributed to the article and approved the submitted version. Foundation of China (81672716, 81900571).
17. Wang W, Green M, Choi JE, Gijó n M, Kennedy PD, Johnson JK, et al. CD8+ T
REFERENCES Cells Regulate Tumour Ferroptosis During Cancer Immunotherapy. Nature
1. Allemani C, Matsuda T, Di Carlo V, Harewood R, Matz M, Nikšić M, et al. (2019) 569:270–4. doi: 10.1038/s41586-019-1170-y
Global Surveillance of Trends in Cancer Survival 2000-14 (CONCORD-3): 18. Wu Y, Yu C, Luo M, Cen C, Qiu J, Zhang S, et al. Ferroptosis in Cancer
Analysis of Individual Records for 37 513 025 Patients Diagnosed With Treatment: Another Way to Rome. Front Oncol (2020) 10:571127.
One of 18 Cancers From 322 Population-Based Registries in 71 Countries. doi: 10.3389/fonc.2020.571127
Lancet (2018) 391:1023–75. doi: 10.1016/S0140-6736(17)33326-3 19. Zhang L, Xu X, Su X. Noncoding RNAs in Cancer Immunity: Functions,
2. Cui Y, Liang S, Zhang S, Zhang C, Zhao Y, Wu D, et al. ABCA8 Is Regulated Regulatory Mechanisms, and Clinical Application. Mol Cancer (2020) 19:48.
by miR-374b-5p and Inhibits Proliferation and Metastasis of Hepatocellular doi: 10.1186/s12943-020-01154-0
Carcinoma Through the ERK/ZEB1 Pathway. J Exp Clin Cancer Res (2020) 20. Chen YG, Satpathy AT, Chang HY. Gene Regulation in the Immune System
39:90. doi: 10.1186/s13046-020-01591-1 by Long Noncoding RNAs. Nat Immunol (2017) 18:962–72. doi: 10.1038/
3. El-Serag HB, Rudolph KL. Hepatocellular Carcinoma: Epidemiology and ni.3771
Molecular Carcinogenesis. Gastroenterol (2007) 132:2557–76. doi: 10.1053/ 21. Hu B, Yang XB, Yang X, Sang XT. LncRNA CYTOR Affects the Proliferation,
j.gastro.2007.04.061 Cell Cycle and Apoptosis of Hepatocellular Carcinoma Cells by Regulating the
4. Stockdale AJ, Chaponda M, Beloukas A, Phillips RO, Matthews PC, miR-125b-5p/KIAA1522 Axis. Aging (Albany NY) (2020) 13:2626–39.
Papadimitropoulos A, et al. Prevalence of Hepatitis D Virus Infection in doi: 10.18632/aging.202306
Sub-Saharan Africa: A Systematic Review and Meta-Analysis. Lancet Glob 22. Hu Y, Zhang X, Zai HY, Jiang W, Xiao L, Zhu Q. lncRNA DUXAP8 Facilitates
Health (2017) 5:e992–1003. doi: 10.1016/S2214-109X(17)30298-X Multiple Malignant Phenotypes and Resistance to PARP Inhibitor in HCC via
5. Sung H, Ferlay J, Siegel RL, Laversanne M, Soerjomataram I, Jemal A, et al. Upregulating Foxm1. Mol Ther Oncolytics (2020) 19:308–22. doi: 10.1016/
Global Cancer Statistics 2020: GLOBOCAN Estimates of Incidence and j.omto.2020.10.010
Mortality Worldwide for 36 Cancers in 185 Countries. CA Cancer J Clin 23. Hu ZQ, Li HC, Teng F, Chang QM, Wu XB, Feng JF, et al. Long Noncoding
(2021) 71:209–49. doi: 10.3322/caac.21660 RNA MAFG-AS1 Facilitates the Progression of Hepatocellular Carcinoma via
6. Calderaro J, Petitprez F, Becht E, Laurent A, Hirsch TZ, Rousseau B, et al. Targeting miR-3196/OTX1 Axis. Eur Rev Med Pharmacol Sci (2020)
Intra-Tumoral Tertiary Lymphoid Structures Are Associated With a Low Risk 24:12131–43. doi: 10.26355/eurrev_202012_24002
of Early Recurrence of Hepatocellular Carcinoma. J Hepatol (2019) 70:58–65. 24. Atianand MK, Caffrey DR, Fitzgerald KA. Immunobiology of Long
doi: 10.1016/j.jhep.2018.09.003 Noncoding RNAs. Annu Rev Immunol (2017) 35:177–98. doi: 10.1146/
7. Zhou J, Yu L, Gao X, Hu J, Wang J, Dai Z, et al. Plasma microRNA Panel to annurev-immunol-041015-055459
Diagnose Hepatitis B Virus-Related Hepatocellular Carcinoma. J Clin Oncol 25. Peng X, He Y, Huang J, Tao Y, Liu S. Metabolism of Dendritic Cells in Tumor
(2011) 29:4781–8. doi: 10.1200/JCO.2011.38.2697 Microenvironment: For Immunotherapy. Front Immunol (2021) 12:613492.
8. Motzer RJ, Escudier B, McDermott DF, George S, Hammers HJ, Srinivas S, doi: 10.3389/fimmu.2021.613492
et al. Nivolumab Versus Everolimus in Advanced Renal-Cell Carcinoma. 26. Shigeta K, Datta M, Hato T, Kitahara S, Chen IX, Matsui A, et al. Dual
N Engl J Med (2015) 373:1803–13. doi: 10.1056/NEJMoa1510665 Programmed Death Receptor-1 and Vascular Endothelial Growth Factor
9. Postow MA, Chesney J, Pavlick AC, Robert C, Grossmann K, McDermott D, Receptor-2 Blockade Promotes Vascular Normalization and Enhances
et al. Nivolumab and Ipilimumab Versus Ipilimumab in Untreated Antitumor Immune Responses in Hepatocellular Carcinoma. Hepatology
Melanoma. N Engl J Med (2015) 372:2006–17. doi: 10.1056/NEJMoa1414428 (2020) 71:1247–61. doi: 10.1002/hep.30889
10. Slater RL, Lai Y, Zhong Y, Li H, Meng Y, Moreno BH, et al. The Cost 27. Yang Y, Wang C, Sun H, Jiang Z, Zhang Y, Pan Z. Apatinib Prevents Natural
Effectiveness of Pembrolizumab Versus Chemotherapy or Atezolizumab as Killer Cell Dysfunction to Enhance the Efficacy of Anti-PD-1 Immunotherapy
Second-Line Therapy for Advanced Urothelial Carcinoma in the United in Hepatocellular Carcinoma. Cancer Gene Ther (2021) 28:89–97.
States. J Med Econ (2020) 23:967–77. doi: 10.1080/13696998.2020.1770261 doi: 10.1038/s41417-020-0186-7
11. Longo V, Brunetti O, Gnoni A, Licchetta A, Delcuratolo S, Memeo R, et al. 28. Gao J, Dai C, Yu X, Yin XB, Zhou F. Long Noncoding RNA LINC00324 Exerts
Emerging Role of Immune Checkpoint Inhibitors in Hepatocellular Protumorigenic Effects on Liver Cancer Stem Cells by Upregulating Fas
Carcinoma. Med (Kaunas) (2019) 55:698. doi: 10.3390/medicina55100698 Ligand via PU Box Binding Protein. FASEB J (2020) 34:5800–17.
12. Zhang B, Wu Q, Li B, Wang D, Wang L, Zhou YL. M6a Regulator-Mediated doi: 10.1096/fj.201902705RR
Methylation Modification Patterns and Tumor Microenvironment Infiltration 29. Fan L, Li H, Wang W. Long Non-Coding RNA PRRT3-AS1 Silencing Inhibits
Characterization in Gastric Cancer. Mol Cancer (2020) 19:53. doi: 10.1186/ Prostate Cancer Cell Proliferation and Promotes Apoptosis and Autophagy.
s12943-020-01170-0 Exp Physiol (2020) 105:793–808. doi: 10.1113/EP088011
13. Petitprez F, de Reyniès A, Keung EZ, Chen TW, Sun CM, Calderaro J, et al. B 30. Cao C, Zhong Q, Lu L, Huang B, Li J, Meng L, et al. Long Noncoding RNA
Cells Are Associated With Survival and Immunotherapy Response in MSC-AS1 Promotes Hepatocellular Carcinoma Oncogenesis via Inducing the
Sarcoma. Nature (2020) 577:556–60. doi: 10.1038/s41586-019-1906-8 Expression of Phosphoglycerate Kinase 1. Cancer Med (2020) 9:5174–84.
14. Salem D, Chelvanambi M, Storkus WJ, Fecek RJ. Cutaneous Melanoma: doi: 10.1002/cam4.3080
Mutational Status and Potential Links to Tertiary Lymphoid Structure 31. Li C, Feng S, Chen L. MSC-AS1 Knockdown Inhibits Cell Growth and
Formation. Front Immunol (2021) 12:629519. doi: 10.3389/fimmu. Temozolomide Resistance by Regulating miR-373-3p/CPEB4 Axis in
2021.629519 Glioma Through PI3K/Akt Pathway. Mol Cell Biochem (2021) 476:699–713.
15. Li H, Wang J, Liu H, Lan T, Xu L, Wang G, et al. Existence of Intratumoral doi: 10.1007/s11010-020-03937-x
Tertiary Lymphoid Structures Is Associated With Immune Cells Infiltration 32. Jin X, Qiao L, Fan H, Liao C, Zheng J, Wang W, et al. Long Non-Coding RNA
and Predicts Better Prognosis in Early-Stage Hepatocellular Carcinoma. Aging MSC-AS1 Facilitates the Proliferation and Glycolysis of Gastric Cancer Cells
(Albany NY) (2020) 12:3451–72. doi: 10.18632/aging.102821 by Regulating PFKFB3 Expression. Int J Med Sci (2021) 18:546–54.
16. Zhou B, Liu J, Kang R, Klionsky DJ, Kroemer G, Tang D. Ferroptosis Is a Type doi: 10.7150/ijms.51947
of Autophagy-Dependent Cell Death. Semin Cancer Biol (2020) 66:89–100. 33. Hu Z, Li L, Cheng P, Liu Q, Zheng X, Peng F, et al. lncRNA MSC-AS1
doi: 10.1016/j.semcancer.2019.03.002 Activates Wnt/b-Catenin Signaling Pathway to Modulate Cell Proliferation
Frontiers in Oncology | www.frontiersin.org 12 September 2021 | Volume 11 | Article 706915Nie et al. Screening Sensitive Population for Immunotherapy
and Migration in Kidney Renal Clear Cell Carcinoma via miR-3924/WNT5A. 44. Wen ZF, Liu H, Gao R, Zhou M, Ma J, Zhang Y, et al. Tumor Cell-Released
J Cell Biochem (2020) 121:4085–93. doi: 10.1002/jcb.29594 Autophagosomes (TRAPs) Promote Immunosuppression Through Induction
34. Sun Y, Wang P, Yang W, Shan Y, Zhang Q, Wu H. The Role of lncRNA MSC- of M2-Like Macrophages With Increased Expression of PD-L1. J Immunother
AS1/miR-29b-3p Axis-Mediated CDK14 Modulation in Pancreatic Cancer Cancer (2018) 6:151. doi: 10.1186/s40425-018-0452-5
Proliferation and Gemcitabine-Induced Apoptosis. Cancer Biol Ther (2019) 45. Sun C, Sun HY, Xiao WH, Zhang C, Tian ZG. Natural Killer Cell Dysfunction
20:729–39. doi: 10.1080/15384047.2018.1529121 in Hepatocellular Carcinoma and NK Cell-Based Immunotherapy. Acta
35. Dai Y, Qiang W, Lin K, Gui Y, Lan X, Wang D. An Immune-Related Gene Pharmacol Sin (2015) 36:1191–9. doi: 10.1038/aps.2015.41
Signature for Predicting Survival and Immunotherapy Efficacy in 46. Shen H, Wang Z, Ren S, Wang W, Duan L, Zhu D, et al. Prognostic Biomarker
Hepatocellular Carcinoma. Cancer Immunol Immunother (2021) 70:967–79. MITD1 and Its Correlation With Immune Infiltrates in Hepatocellular
doi: 10.1007/s00262-020-02743-0 Carcinoma (HCC). Int Immunopharmacol (2020) 81:106222. doi: 10.1016/
36. Wang L, Yang Z, Cao Y. Regulatory T Cell and Activated Natural Killer j.intimp.2020.106222
Cell Infiltration in Hepatocellular Carcinoma: Immune Cell Profiling 47. Charoentong P, Finotello F, Angelova M, Mayer C, Efremova M, Rieder D,
Using the CIBERSORT. Ann Transl Med (2020) 8:1483. doi: 10.21037/ et al. Pan-Cancer Immunogenomic Analyses Reveal Genotype-
atm-20-5830 Immunophenotype Relationships and Predictors of Response to Checkpoint
37. Miao YR, Zhang Q, Lei Q, Luo M, Xie GY, Wang H, et al. ImmuCellAI: A Blockade. Cell Rep (2017) 18:248–62. doi: 10.1016/j.celrep.2016.12.019
Unique Method for Comprehensive T-Cell Subsets Abundance Prediction 48. Giannini EG, Aglitti A, Borzio M, Gambato M, Guarino M, Iavarone M, et al.
and Its Application in Cancer Immunotherapy. Adv Sci (Weinh) (2020) Overview of Immune Checkpoint Inhibitors Therapy for Hepatocellular
7:1902880. doi: 10.1002/advs.201902880 Carcinoma, and The ITA.LI.CA Cohort Derived Estimate of Amenability
38. Li T, Fu J, Zeng Z, Cohen D, Li J, Chen Q, et al. TIMER2.0 for Analysis of Rate to Immune Checkpoint Inhibitors in Clinical Practice. Cancers (Basel)
Tumor-Infiltrating Immune Cells. Nucleic Acids Res (2020) 48:W509– (2019) 11(11):1689. doi: 10.3390/cancers11111689
509W514. doi: 10.1093/nar/gkaa407
39. Chen Y, Li ZY, Zhou GQ, Sun Y. An Immune-Related Gene Prognostic Index Conflict of Interest: The authors declare that the research was conducted in the
for Head and Neck Squamous Cell Carcinoma. Clin Cancer Res (2021) absence of any commercial or financial relationships that could be construed as a
27:330–41. doi: 10.1158/1078-0432.CCR-20-2166 potential conflict of interest.
40. Reading JL, Gá lvez-Cancino F, Swanton C, Lladser A, Peggs KS, Quezada SA.
The Function and Dysfunction of Memory CD8+ T Cells in Tumor Publisher’s Note: All claims expressed in this article are solely those of the authors
Immunity. Immunol Rev (2018) 283:194–212. doi: 10.1111/imr.12657 and do not necessarily represent those of their affiliated organizations, or those of
41. Kaseb AO, Vence L, Blando J, Yadav SS, Ikoma N, Pestana RC, et al. the publisher, the editors and the reviewers. Any product that may be evaluated in
Immunologic Correlates of Pathologic Complete Response to Preoperative this article, or claim that may be made by its manufacturer, is not guaranteed or
Immunotherapy in Hepatocellular Carcinoma. Cancer Immunol Res (2019) endorsed by the publisher.
7:1390–5. doi: 10.1158/2326-6066.CIR-18-0605
42. Wan S, Zhao E, Kryczek I, Vatan L, Sadovskaya A, Ludema G, et al. Tumor- Copyright © 2021 Nie, Li, Wu, Guo, Lei, Zhang, Wang, Mao, Zhang and Song. This is
Associated Macrophages Produce Interleukin 6 and Signal via STAT3 to an open-access article distributed under the terms of the Creative Commons
Promote Expansion of Human Hepatocellular Carcinoma Stem Cells. Attribution License (CC BY). The use, distribution or reproduction in other forums
Gastroenterology (2014) 147:1393–404. doi: 10.1053/j.gastro.2014.08.039 is permitted, provided the original author(s) and the copyright owner(s) are credited
43. Facciabene A, Peng X, Hagemann IS, Balint K, Barchetti A, Wang LP, et al. and that the original publication in this journal is cited, in accordance with accepted
Tumour Hypoxia Promotes Tolerance and Angiogenesis via CCL28 and T academic practice. No use, distribution or reproduction is permitted which does not
(reg) Cells. Nature (2011) 475:226–30. doi: 10.1038/nature10169 comply with these terms.
Frontiers in Oncology | www.frontiersin.org 13 September 2021 | Volume 11 | Article 706915You can also read