A paradigm of extreme rainfall pluvial floods in complex urban areas: the flood event of 15 July 2020 in Palermo (Italy) - NHESS
←
→
Page content transcription
If your browser does not render page correctly, please read the page content below
Nat. Hazards Earth Syst. Sci., 21, 2563–2580, 2021
https://doi.org/10.5194/nhess-21-2563-2021
© Author(s) 2021. This work is distributed under
the Creative Commons Attribution 4.0 License.

A paradigm of extreme rainfall pluvial floods in complex urban
areas: the flood event of 15 July 2020 in Palermo (Italy)
Antonio Francipane, Dario Pumo, Marco Sinagra, Goffredo La Loggia, and Leonardo Valerio Noto
Department of Engineering, University of Palermo, Palermo 90128, Italy

Correspondence: Antonio Francipane (antonio.francipane@unipa.it)

Received: 25 February 2021 – Discussion started: 4 March 2021
Revised: 15 July 2021 – Accepted: 29 July 2021 – Published: 26 August 2021

Abstract. In the last few years, some regions of the Mediter-      (Andersson-Sköld and Nyberg, 2016; Gariano and Guzzetti,
ranean area have witnessed a progressive increase in extreme       2016; Hoeppe, 2016; IPCC, 2019; Jia et al., 2019; Messeri
events, such as urban and flash floods, as a response to the in-   et al., 2015), including the Mediterranean region, where
creasingly frequent and severe extreme rainfall events, which      Sicily (Italy) has been one of the most affected areas in be-
are often exacerbated by the ever-growing urbanization. In         tween 2008 and 2018 (Trigila and Iadanza, 2018).
such a context, the urban drainage systems may not be suffi-          Sicily is the largest island of the Mediterranean Sea and is
cient to convey the rainwater, thus increasing the risk deriv-     characterized by a very complex morphology. The combina-
ing from the occurrence of such events.                            tion of its geographic position, morphology, and climate can
   This study focuses on a particularly intense urban flood        lead to the generation of severe rainfall events, especially in
that occurred in Palermo (Italy) on 15 July 2020; it represents    between the end of summer and the fall. In that period, in-
a typical pluvial flood due to extreme rainfall on a complex       deed, the warmer air masses that move over the hot water of
urban area that many cities have experienced in recent years,      the Mediterranean Sea increase their atmospheric moisture-
especially in the Mediterranean region. A conceptual hydro-        holding capacity (Drobinski et al., 2018; Pumo et al., 2019;
logical model and a 2D hydraulic model, particularly suitable      Pumo and Noto, 2021) and, interacting with the steep orog-
for simulations in a very complex urban context, have been         raphy on the coasts, can generate local convection processes
used to simulate the event. Results have been qualitatively        that cause very heavy rainfall (Dayan et al., 2015; Sheffield
validated by means of crowdsourced information and satel-          and Wood, 2008; Tramblay and Somot, 2018). In the last
lite images.                                                       few years, these rainfall events have become increasingly fre-
   The experience of Palermo, which has highlighted the ur-        quent and severe over the Mediterranean area (Arnone et al.,
gent need for a shift in the way stormwater in urban settle-       2013; Cipolla et al., 2020; IPCC, 2019), especially at the sub-
ments is managed, can be assumed to be a paradigm for mod-         hourly scale (Treppiedi et al., 2021), with a rainfall–runoff
eling pluvial floods in complex urban areas under extreme          response often exacerbated by the ever-growing urbanization
rainfall conditions. Although the approaches and the related       (Arnone et al., 2018; Easterling et al., 2000; Pumo et al.,
policies cannot be identical for all cities, the modeling frame-   2017).
work used here to assess the impacts of the event under study         Consequentially, in recent times, some intense rainfall
and some conclusive remarks could be easily transferred to         events have caused urban floods and flash floods in many
other, different urban contexts.                                   cities of the island, with consequent economic damages and,
                                                                   sometimes, loss of human life. For instance, on 1 Octo-
                                                                   ber 2015, about 75 mm of rainfall, with an intensity peak of
                                                                   about 65 mm h−1 , flooded the city of Catania, prompting the
1   Introduction                                                   intervention of the Civil Protection Department to drain the
                                                                   streets with sump pumps. In November 2016, a 160 mm rain
During the last few decades, floods and flash floods have          event with a duration of 3 h occurred in the city of Licata,
reached unprecedented levels in several parts of the globe

Published by Copernicus Publications on behalf of the European Geosciences Union.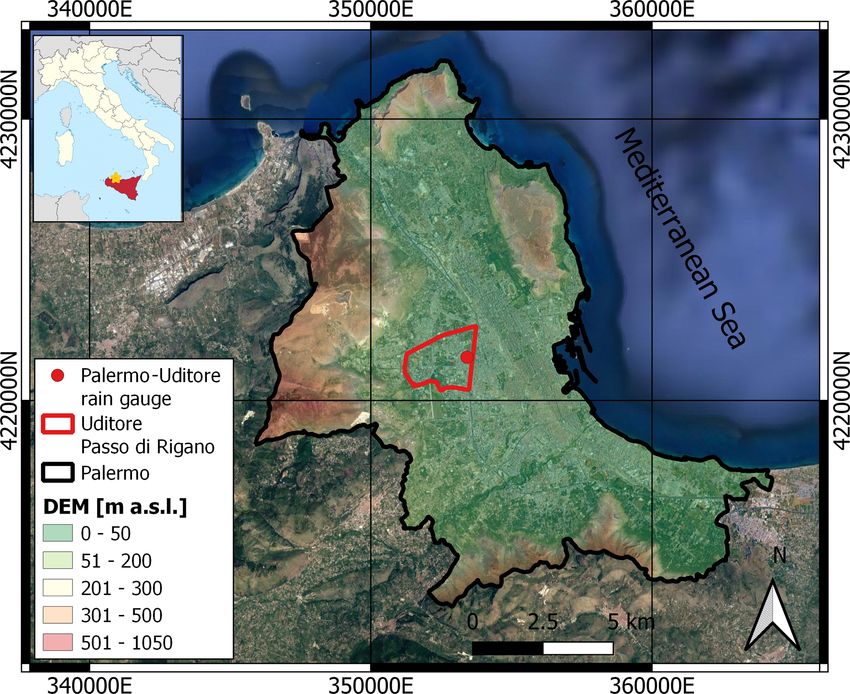
2564                            A. Francipane et al.: A paradigm of extreme rainfall pluvial floods in complex urban areas

causing damage and forcing the mayor of the city to adopt             discharge, etc.) available in different points of the domain,
extreme measures for civil protection (e.g., people confined          in urban areas there are no gauged sites that provide wa-
to their homes, closure of schools and all economic activi-           ter level observations. Nowadays, one of the possibilities for
ties, etc.). On 8 August 2018, in only 20 min, precipitation of       overcoming such a problem is represented by remote sensing
about 75 mm h−1 intensity endangered the city of Palermo,             data, which can provide the opportunity to quickly and pre-
transforming the urban streets into rivers and flooding most          cisely have an overview of the flooded areas (Di Baldassarre
of the old city and several other districts of the city. Between      et al., 2009; Bates, 2012; Grimaldi et al., 2016). However,
1 and 3 November 2018, some heavy rainfall events in the              remote sensing data may not be always adequate to describe
eastern and southern parts of the region, between the cities          the evolution and the effects of a pluvial flood either because
of Trapani, Palermo, and Agrigento, caused 13 fatalities, and         they are often not timeously available due to the satellite or-
more than 230 people were displaced. In the town of Castel-           bit revisit time (Annis and Nardi, 2019), which is especially
daccia, 18 km away from the city of Palermo, a flash flood            true when floods have a rapid temporal evolution and lim-
trapped and killed nine people in their homes. The rainfall           ited flood area extent (Notti et al., 2018), or because the sub-
peak over 3 d reached an intensity of about 190 mm h−1 in             stantial areas of the urban ground surface may not be visi-
5 min, with a total rainfall depth of 180 mm in 3 d, which is         ble due to the shadow caused by buildings (Lu et al., 2010;
approximatively equal to about one-third of the mean annual           Mason et al., 2014, 2021; Notti et al., 2018). In addition to
precipitation of some of the affected areas. Figure S1 in the         remote sensing data, data gathered by citizens (i.e., crowd-
Supplement shows some of the impacts that these floods had            sourced data) are becoming increasingly important thanks to
on the territory that they affected.                                  the widespread use of smartphones and social media (Hilbert,
   All these flooding events occurred between the end of              2016). The growing availability of crowdsourced data, espe-
summer and the fall and can be related to a combined ef-              cially in urban areas, such as pictures and videos acquired
fect of convective precipitation, which saturates the urban           with mobile devices (e.g., smartphones, tablets, digital cam-
drainage system very quickly, and the runoff due to the rain          eras, etc.) and content sharing on social media platforms
falling on elevated terrain (e.g., hillsides) that is scarcely able   (e.g., YouTube, Facebook, Instagram, etc.), offers the possi-
to infiltrate the water. Most of these floods can be classified       bility for scientists to gather precious information about the
as pluvial floods. Although this type of flood usually occurs         temporal and spatial evolution of flooding events to be used
gradually, with levels of water that rarely exceed 1 m (Palla         for the calibration of hydraulic models. Many studies have
et al., 2018; Stone et al., 2013; Sušnik et al., 2015) and does       used crowdsourced data to investigate flood events in the last
not cause an immediate threat to life, it may cause significant       few years (Annis and Nardi, 2019; Mazzoleni et al., 2015,
economic damage in some cases.                                        2018; Smith et al., 2017; Yu et al., 2016).
   Modeling such a type of flood is never easy, especially               Despite the highlighted difficulties, a correct pluvial flood
when these affect very complex urban areas. Bulti and                 model in a complex urban area is extremely important for
Abebe (2020) provided a review of the main flood model-               correct residual risk management by means of opportune
ing methods adopted for the study of pluvial floods, high-            civil protection plans and the continuous updating of the
lighting the benefits and drawbacks of each approach. Some            flood emergency plans. Moreover, pluvial flood modeling
approaches, such as rapid flood spreading (Lhomme et al.,             can be useful for demonstrating how, in some cases, a
2009; Wallingford, 2006), are easy to apply but return only           drainage system may not be efficient and, thus, increase the
the final state of inundation. Other approaches, such as              hydraulic risk deriving from the occurrence of such events.
the 1D approach, are recommended for studies that do not re-          Many of these systems, indeed, have been designed without
quire high precision in describing the surface runoff routing,        considering the impacts of urbanization and climate change
while still others, such as the 2D approach, seem to be more          on natural systems and, for this reason, are no longer suit-
suitable for applications in urban areas where there is no            able for draining the rain coming from some extreme events
stormwater drainage or the influence of stormwater drainage           that are likely to become more frequent and heavier. All of
is considered insignificant for the flood phenomenon under            these aspects make it necessary for new paradigms in urban
study. Coupled models (i.e., 1D–2D) can provide accurate in-          drainage design to develop new strategies for flood risk man-
formation but are computationally expensive both in terms of          agement based on the acceptance of a new concept in which
runtime and data requirements. In all cases, however, reliable        flooding can be tolerated and viewed as a driver for societal
modeling of the phenomenon always requires many different             development (La Loggia et al., 2020).
kinds of information and levels of accuracy, which are not               From this perspective, this study addresses questions re-
always available or easy to obtain.                                   garding the way of dealing with the flood risk in urban set-
   From this perspective, one of the main issues to deal with         tlements where the economic, social, and cultural conditions
is the lack of observed data to be used as a reference for the        do not allow either for the building of new drainage systems
calibration and validation of models (See, 2019). Indeed, dif-        or the upgrading of the existing ones. To do this, the study
ferent to the case of fluvial floods in gauged systems, where         focuses on a particularly intense urban flood that occurred
the monitoring of the rivers makes measures (i.e., water level,       within the Uditore–Passo di Rigano district in Palermo on

Nat. Hazards Earth Syst. Sci., 21, 2563–2580, 2021                                   https://doi.org/10.5194/nhess-21-2563-2021
A. Francipane et al.: A paradigm of extreme rainfall pluvial floods in complex urban areas 2565
15 July 2020, which represents a typical extreme rainfall plu-
vial flood over a complex urban area that many cities, espe-
cially in the Mediterranean region, have experienced in re-
cent years. On that occasion, the precipitation lasted about
2 h, with a cumulative rainfall of 134 mm and an intensity
peak of 168 mm h−1 in 5 min, caused the flooding of the ring
road of Palermo and its underpasses with damage to several
cars and inconveniences to people. In that case, in addition
to the precipitation, a significant impact on the flooding dy-
namic is surely attributable to the substantial alterations in
the land use and land cover that have occurred over the last
few decades, especially in the areas most affected by the
event.
We capitalize on this event to create a modeling frame-
work that can be assumed as a “paradigm” for those cases
in which (i) complex hydrologic domains are linked to com-
plex systems of natural channels integrated within an urban
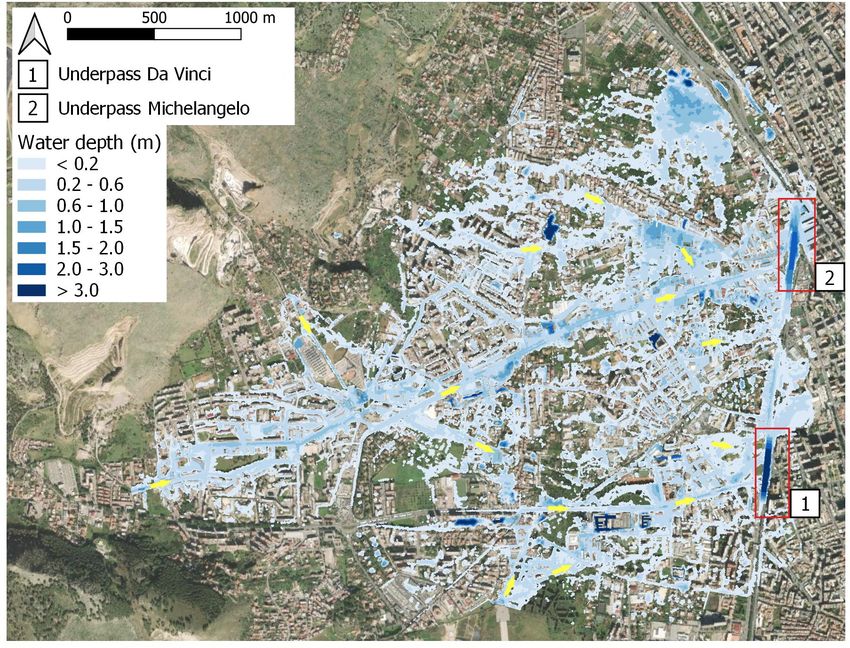
settlement, (ii) the domain is forced with extreme precipita- Figure 1. Aerial view of the city of Palermo (Sicily, Italy) over-
tion, and (iii) there is a lack of observed data but a plenty of laid on a digital elevation model (DEM). The red line and red point
crowdsourced data that can be used qualitatively to verify the indicate the Uditore–Passo di Rigano district and the Uditore rain
reliability of results returned by the modeling chain. gauge station of the SIAS (Servizio Informativo Agrometeorologico
The paper is organized as follows. Section 2 introduces Siciliano – Agrometeorological Information Service of Sicily) rain
gauge network, respectively. The yellow star in the inset indicates
the case study (i.e., the flooding event) and the analysis of the
the location of Palermo. Source: © Google Maps Satellite basemap
rainfall event that caused it. Section 3 describes the hydrolog-
available within the QuickMapServices plugin of Quantum GIS.
ical and hydraulic models used to model the forcing coming
from the contributing basins around the study area and the
propagation of the hydrographs within it, respectively, and
the data used to validate the hydraulic model. The results and annual temperature is about 22 ◦ C, with peaks higher than
some insights about future management strategies are shown 35 ◦ C during the summer.
and discussed in Sect. 4. Section 5, finally, provides the main The study area (i.e., the Uditore–Passo di Rigano district;
conclusions of the study. red line in Fig. 1) is located at the foot of Mount Cuccio
(1050 m a.s.l.) and Mount Gibilforni (about 520 m a.s.l.) and
is traversed by two of the most important streets of the city,
2 Case study: the Uditore–Passo di Rigano district in i.e., via Leonardo Da Vinci and viale Michelangelo, the ring
Palermo road of Palermo, also known as viale Regione Siciliana, and
its underpasses below the two streets mentioned above (here-
Palermo is the capital of Sicily (Italy), which is the largest after named Da Vinci underpass and Michelangelo under-
island of the Mediterranean Sea (Fig. 1). The city lies on pass, respectively). The district includes a rather articulated
a valley of about 100 km2 , called Conca d’Oro, in between water drainage system for the conveyance and regulation of
the Mediterranean Sea and the mountains that reach a max- rainwater (Fig. 2). It is made of the artificial channel, Passo
imum elevation of about 1000 m a.s.l. (Fig. 1). The original di Rigano, with its left tributaries of Mortillaro, Celona, and
hydrographic configuration of the city has been completely Borsellino, which flow into a unique stream further down-
changed over the years. The two rivers that originally tra- stream, and its right tributary of Luparello, which is an exten-
versed the city, the Kemonia and the Papireto, have been sion of the channel Passo di Rigano upstream of the conflu-
forced underground, while there is only a river, the Oreto, ence between the Celona and the Borsellino channels. This
that still runs on the surface. The city is characterized by drainage system, which is almost completely underground
some ephemeral streams, called valloni, that convey rainwa- and embedded within the urban structure, flows toward the
ter from the mountains and the hills around the city to the industrial harbor of Palermo. In Fig. 2, within the colored
inner city, sometimes causing damage and inconveniencing boxes, the channel cross sections are shown (Oliveri, 1996).
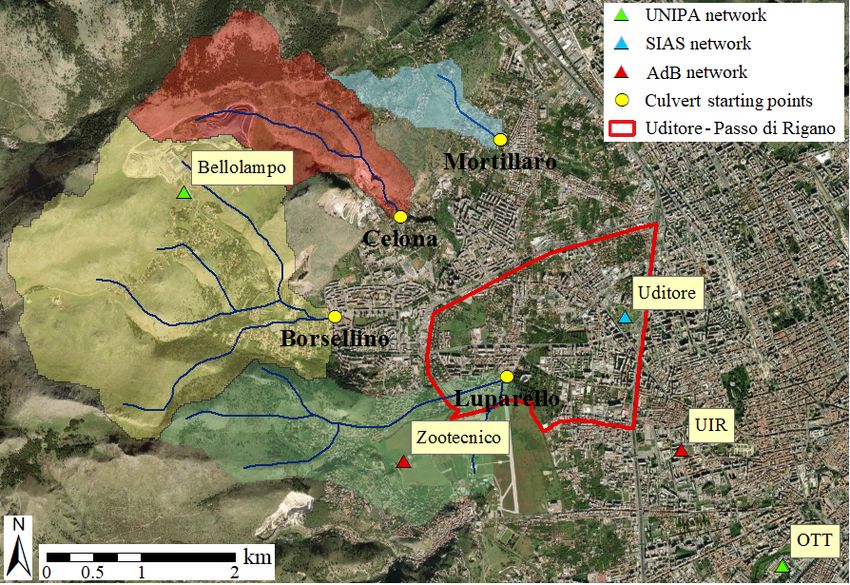
the people. As it is possible to observe in Fig. 3, there are four different
The city has a Mediterranean climate, with hot and dry main drainage areas that feed the abovementioned channels
summers and cool and wet winters. The mean annual precip- and mainly contribute to the total runoff formation within the
itation is about 800 mm, with precipitation mostly concen- study area. The outlets of the four contributing catchments
trated in fall and winter, while the summer season (i.e., June, (yellow circles in Fig. 3) match with the starting points of
July, and August) is usually almost without rain. The mean the covered parts of channels (i.e., culverts) of Mortillaro,
https://doi.org/10.5194/nhess-21-2563-2021 Nat. Hazards Earth Syst. Sci., 21, 2563–2580, 2021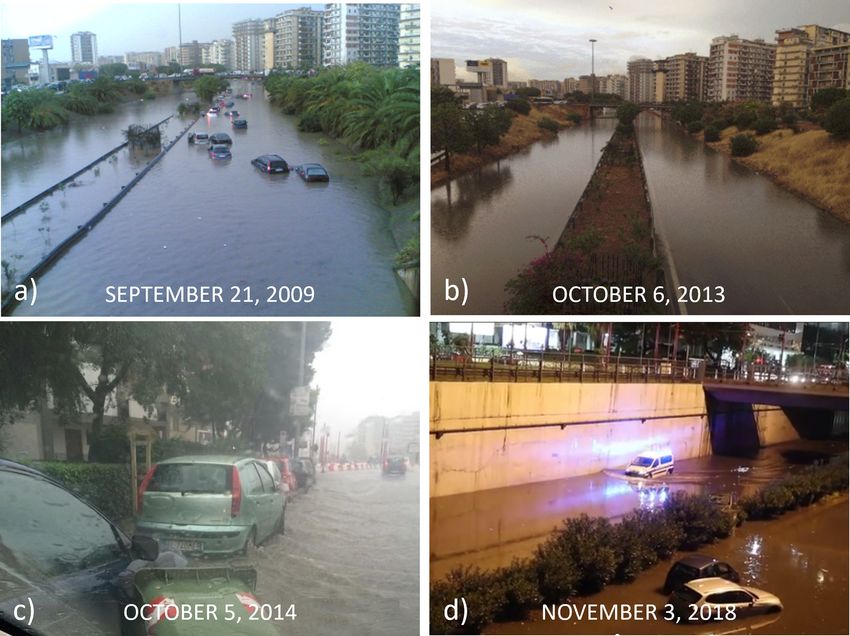
2566                             A. Francipane et al.: A paradigm of extreme rainfall pluvial floods in complex urban areas

Figure 2. The Passo di Rigano drainage system for the conveying and regulating rainwater in the study area. The yellow color is associated
with Borsellino, red with Celona, green with Luparello, and blue with Mortillaro channels; the box with mixed colors (red, yellow, and green)
refers to the section of the Luparello channel downstream of the confluence with the Borsellino and Celona channels.

Celona, Borsellino, and Luparello. Apart from the Uditore                gional plan that maps the hydraulic and geomorphological
rain gauge, located within the Uditore–Passo di Rigano dis-              hazard and risk for the Sicilian territory. The PAI shows the
trict (cyan triangle in Fig. 3), other rain gauges very close to         presence of a hydraulic hazard only for two small areas in the
the study area are the Zootecnico and UIR (red triangles in              upper and central parts of the domain of study, which were
Fig. 3) rain gauges, which are part of the rain gauge network            scarcely affected by the flood studied here. In this case, the
of the Autorità di Bacino della Regione Sicilia (Basin Au-               hazard map of the study, which dates to the early 2000s, was
thority of the Sicilian Region; hereafter AdB), and the Bel-             made by using a very simplistic approach just based on the
lolampo and OTT (green triangles in Fig. 3) gauges, which                position of the morphological depressions and without mod-
are part of the rain gauge network of the Department of En-              eling any flooding dynamics in the study area.
gineering of the University of Palermo (hereafter UNIPA).
   During the last 15 years, the area has undergone a signifi-           2.1   Overview of the most significant past flooding
cant change in its urban environment due to the construction                   events
of a new mall in the northwestern part of the district, im-
mediately downstream of the Celona basin outlet in Fig. 3,               Over the past 15 years, the Uditore–Passo di Rigano district
and a new tramline that traverses the entire district along the          has been affected by at least one flooding event per year. Fig-
WSW–ENE axis. Both the interventions have increased the                  ure 4 shows a collection of pictures of some of the most im-
impervious areas within the district, thus exacerbating the ef-          portant events that occurred between 2009 and 2019. As it
fects of rainfall–runoff response of more severe precipitation           is possible to notice from these examples, all the events oc-
events. Moreover, the tramline, which is bordered by side-               curred between the end of summer and mid-fall as a con-
walks and walls, acts as a channel that conveys the stormwa-             sequence of convective rainfall events, which are typical of
ter and causes a faster propagation of the flood wave towards            that period (Cipolla et al., 2020). Figure 4 also shows that
the Da Vinci underpass.                                                  the most-affected area of the district is usually the ring road
   The hydraulic hazard and risk maps for the study area are             of Palermo, along with its underpasses, since they act as col-
reported in the Hydrogeological Setting Plan (Piano stralcio             lectors of the water conveyed by the via Leonardo Da Vinci,
per l’Assetto Idrogeologico – PAI) for Sicily, which is a re-            viale Michelangelo, and the tramline. The water that flows
                                                                         on the streets and the tramline generates fast flooding events

Nat. Hazards Earth Syst. Sci., 21, 2563–2580, 2021                                        https://doi.org/10.5194/nhess-21-2563-2021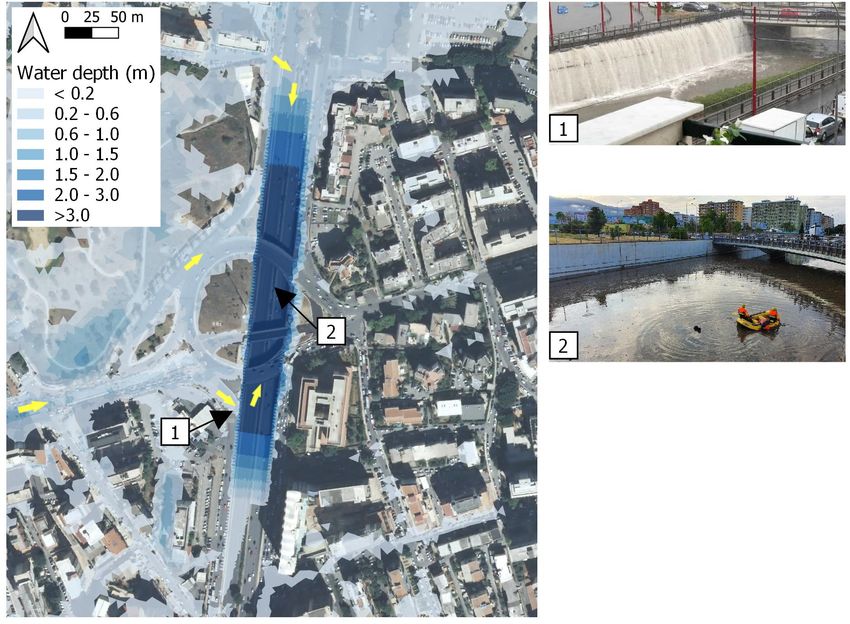
A. Francipane et al.: A paradigm of extreme rainfall pluvial floods in complex urban areas                                               2567

Figure 3. Main contributing catchments for the study area, i.e., Borsellino, Celona, Luparello, and Mortillaro. The yellow circles indicate the
outlets of the contributing catchments and match with the starting points of the culverts. The red, cyan, and green triangles indicate the rain
gauges of the basin authority (AdB), SIAS, and UNIPA networks, respectively. The red line indicates the Uditore–Passo di Rigano district.
Source: © Google Maps Satellite basemap available within the QuickMapServices plugin of Quantum GIS.

that may cause considerable difficulties to drivers who often             marked oblique axis, there was a convergence line between
have no time to leave the ring road.                                      the air coming from WNW and the sea breeze coming from
   Figure 5 shows the hyetographs of the rainfall events as-              NNE. At high altitude, this convergence line joined a strong
sociated with the flooding events reported in Fig. 4. All the             instability area (region of positive vorticity advection) due
events are relative to the rainfall collected at the Uditore rain         to the passage of a trough on the Mediterranean Sea. This
gauge (red circle in Fig. 1). The duration of the events ranges           generated an intense updraft that favored the rapid cooling of
between about 1.5 h (e.g., event of 6 October 2013) and                   the humid air coming from the sea. Moreover, the presence
about 4 h (e.g., event of 3 November 2018), with an instan-               of hills and mountains close to the sea favored the down-
taneous (i.e., 10 min) intensity peak between 62.4 mm h−1                 draft of cold and dry air down to the sea, where the pres-
(e.g., event of 21 September 2009 and 3 November 2018) and                ence of warmer and humid air created the conditions for a
116.4 mm h−1 (e.g., event of 6 October 2013). All the events              new updraft that continuously fed the supercell. Figure S2
are characterized by a total rainfall higher than 40 mm, with             in the Supplement shows the self-healing thunderstorm cell
a maximum of about 60 mm during the event of 3 Novem-                     observed around the 17:00 CET (Central European Time) on
ber 2018, and can be statistically classified as ordinary events          the city of Palermo from the visible channel of Meteosat-11
with a return period ranging between 5 and about 20 years.                project satellites and provided by the EUropean Organisation
The fact that even an ordinary rainfall event can generate a              for the Exploitation of Meteorological Satellites (EUMET-
considerable flooding of the district is probably due to its              SAT) of the UK Met Office.
high urbanization, which has completely upset the natural                    The phenomenon was not easy to forecast; the Global
rain drainage network in that area, thus exacerbating the ef-             Forecast System (GFS) model of National Centers for En-
fects of the rainfall–runoff response.                                    vironmental Prediction (NCEP) of the National Oceanic and
                                                                          Atmospheric Administration (NOAA) forecasted, between
2.2   The precipitation event of 15 July 2020                             the 15:00 and 20:00 UTC, a cumulated rainfall in the range
                                                                          of 5–20 mm for some areas of the city of Palermo. However,
The severe storm that affected the city of Palermo on                     from the observation of the synoptic pattern associated with
15 July 2020 was the heaviest rainfall event recorded in the              the event, it was possible to deduce a risk of locally intense
Palermo area during the last 90 years. It was due to a self-              thunderstorm phenomena.
healing supercell that remained in the same area for differ-                 Figure 6 shows the geopotential heights of the 500 mbar
ent hours, dumping a large amount of rainwater on it in a                 pressure surface (colored map in Fig. 6) and the MSLP (mean
very short time. At the origin of the event, which assumed a

https://doi.org/10.5194/nhess-21-2563-2021                                        Nat. Hazards Earth Syst. Sci., 21, 2563–2580, 2021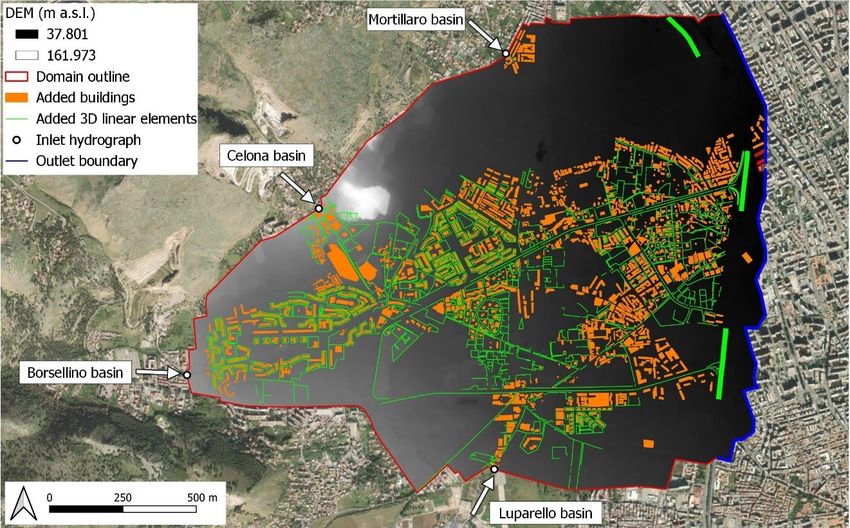
2568                            A. Francipane et al.: A paradigm of extreme rainfall pluvial floods in complex urban areas

Figure 4. Flooding events that affected the Uditore–Passo di Rigano district on (a) 21 September 2009, (b) 6 Oc-
tober 2013, (c) 5 October 2014, and (d) 3 November 2018. Source (a): Rosalio (https://www.rosalio.it/2009/09/22/
allagamenti-in-citta/, last access: 23 August 2021). Source (b): La Voce dell’Isola (https://www.lavocedellisola.it/2013/10/
palermo-nubifragio-in-corso-aerei-dirottati-viale-lazio-chiuso/, last access: 23 August 2021). Source (c): PalermoToday (https:
//www.palermotoday.it/foto/cronaca/temporale-palermo-allagamenti-foto-5-ottobre-2014/via-leonardo-da-vinci-foto-antonio-rao.
html, last access: 3 March 2021). Source (d): Giornale di Sicilia (https://palermo.gds.it/video/cronaca/2018/11/04/
maltempo-a-palermo-strade-come-fiumi-e-auto-impantanate-il-video-di-viale-regione-allagata-8592631d-fcf3-4afe-a92c-db35376cd5ac/,
last access: 23 August 2021).

Figure 5. Rainfall collected at the Uditore rain gauge for the events occurring on (a) 21 September 2009, (b) 6 October 2013, (c) 5 Octo-
ber 2014, and (d) 3 November 2018.

sea level pressure; solid lines in Fig. 6) for 15 July 2020, as        of a subtropical jet stream. These conditions of instability
forecasted by the 12 z GFS. From the analysis of Fig. 6, it            were further exacerbated by the positive values of potential
is possible to observe a trough progressing southward, from            vorticity, extending from the lower Mediterranean–Sardinian
Denmark to the Mediterranean Basin, with a strong positive             channel up to western Sicily, which injected further cold and
vorticity advection quickly moving toward Sicily. The activ-           dry air from the stratosphere.
ity between the descendent trough from Denmark and the an-               The presence of a strong subtropical jet stream (around
ticyclone from North Africa favored the ascent, up to Sicily,          300 hPa), cold and dry air (above 600 hPa), and very warm

Nat. Hazards Earth Syst. Sci., 21, 2563–2580, 2021                                     https://doi.org/10.5194/nhess-21-2563-2021
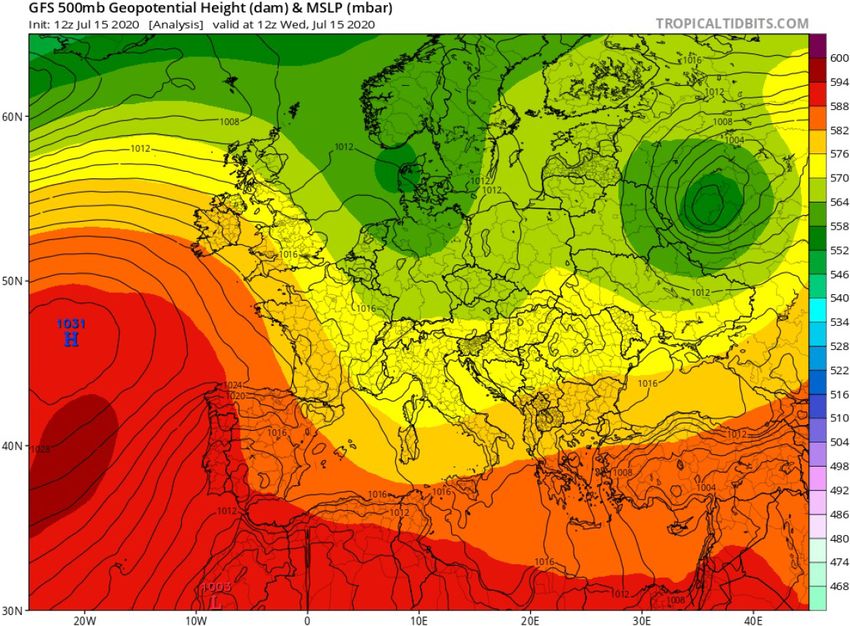
A. Francipane et al.: A paradigm of extreme rainfall pluvial floods in complex urban areas                                           2569

Figure 6. Geopotential heights at the 500 mbar level (12 z GFS) and mean sea level pressure (MSLP). Colored scale bar indicates the
geopotential height values in dam (i.e., decameter), while black contour lines indicate MSLP in mbar (i.e., millibar). Source: NCEP (NOAA).

and humid air in lower layers are confirmed by the data                 which are characterized by a 48- and a 40-year time series,
recorded at the radiosonde data station at Trapani–Birgi (see           the precipitation of 15 July 2020 shows much higher values
Fig. S3).                                                               of depth at the durations of 1 h (i.e., 67 mm for the UIR sta-
   The storm caused a very high intensity precipitation, es-            tion and 51.8 mm for the Zootecnico station) and 3 h (i.e.,
pecially over the Uditore–Passo di Rigano district (red line            85.4 for the UIR station and 99 mm for the Zootecnico sta-
in Figs. 1 and 3) and the hilly/mountainous area around it,             tion); the return period for both the 1 and 3 h rainfall dura-
which started at around 16:00 UTC and lasted about 2 h. On              tions, which has been estimated through the rainfall growth
that occasion, the Uditore rain gauge (red circle in Fig. 1) of         curves derived by Forestieri et al. (2018), resulted in val-
the regional agency SIAS (Servizio Informativo Agromete-                ues much higher than 200 years, thus highlighting the ex-
orologico Siciliano – Agrometeorological Information Ser-               ceptionality of the rainfall event that occurred on that day in
vice of Sicily) reported a maximum hourly intensity of the              Palermo.
event equal to 87.8 mm h−1 , with an instantaneous intensity               Similar rainfall depths were also recorded by the rain
peak of 168 mm h−1 in 5 min at around 17:35 CET and a cu-               gauges nearby. Figure 7b–e show the hyetographs for the
mulative rainfall of 134 mm (Fig. 7a). Even without a robust            Zootecnico, UIR, Bellolampo, and OTT (see Fig. 3) rain
statistical analysis made on the historical data, considering           gauges, respectively. As it is possible to notice, the Uditore
that this is the highest value ever recorded at the station since       (Fig. 7a), Zootecnico (Fig. 7b), and UIR (Fig. 7c) rain gauges
its installation (i.e., 2002) and that it represents the wettest        show similar shapes of hyetographs, with two peaks rang-
day in July for the city of Palermo since 1797, much higher             ing between 17 mm and about 21 mm at around 16:20 CET
than the previous record (i.e., 39.2 mm on 6 July 1935), it             and about 24 mm and about 27 mm at around 17:30 CET, re-
is clear how the storm under analysis was not an ordinary               spectively, and a total rainfall depth between about 121 and
rainfall event. Comparing the rainfall recorded for differ-             134 mm in total over the duration of the rainfall event. The
ent accumulation periods with the annual maxima precipita-              Bellolampo (Fig. 7d) and OTT (Fig. 7e) rain gauges, de-
tion (AMP) for the same accumulation periods and recorded               spite still having a two-peak shape and a similar duration
from 2002 through 2020 at the Uditore rain gauge, it is pos-            to the previous ones, instead show different values of peaks
sible to notice how the precipitation on 15 July 2020 is much           and lower total rainfall depths than the previous rain gauges.
higher than the corresponding annual maximum values (e.g.,              Moreover, the hyetograph related to the Bellolampo rain
25.6 mm vs. 19.4 mm at 10 min, 87.8 mm vs. 48.2 mm at 1 h,              gauge (Fig. 7d) is shifted forward in time, suggesting that the
and 134 mm vs. 55.8 mm at 3 h). Also, looking at the rain-              supercell moved from the sea towards the mountains, show-
fall collected at the nearby UIR and Zootecnico rain gauges,

https://doi.org/10.5194/nhess-21-2563-2021                                     Nat. Hazards Earth Syst. Sci., 21, 2563–2580, 2021
2570                            A. Francipane et al.: A paradigm of extreme rainfall pluvial floods in complex urban areas

Figure 7. Rainfall collected at the rain gauges at (a) Uditore, (b) Zootecnico, (c) UIR, (d) Bellolampo, and (e) OTT on 15 July 2020 between
15:30 and 18:30 CET.

ing its exceptional nature, especially over the Uditore–Passo           description of the data used to verify the reliability of hy-
di Rigano district.                                                     draulic model results is given as well.
   The result of such a precipitation event on a very highly
urbanized area was the flooding of the ring road of Palermo             3.1    Hydrological modeling: the TOPDM
and its underpasses, with damage to several cars and people
being inconvenienced. In the Da Vinci underpass, as mea-                The topography-based probability distributed model
sured by the local fire department, the water level reached             (TOPDM; Liuzzo et al., 2015; Noto, 2014) is a lumped
a depth of about 5 m, with an estimated water volume of                 conceptual model that allows the simulation, at basin scale,
28 000 m3 , trapping many drivers in their cars. Moreover, the          of all the hydrological processes of interest for the sort of
precipitation caused some flash floods from the small hilly             flooding studied here. The model belongs to the family of
and mountain catchments around the Uditore–Passo di Rig-                the probability distribution models (PDMs; Moore, 1985),
ano district that carried mud and debris from the slopes of             which represent the basin as a series of storages of capac-
the hills and mountains to the city. Although an exact quanti-          ity c. In particular, the TOPDM uses the spatial distribution
tative estimation of the damages is still under evaluation, the         of the topographic index to derive the probability distribution
regional government of Sicily has already allocated a first             of the capacity of the considered storages. The model is
extraordinary contribution for damages of EUR 900 000; the              capable of working at different temporal scales (i.e., from
amount includes EUR 350 000 for damages to warehouses,                  sub-hourly to daily); this makes the TOPDM suitable for
shops, and production activities, EUR 250 000 for vehicles,             simulating runoff and analyzing hydrological processes at
EUR 150 000 for damage to furnishings, EUR 100 000 for                  the catchment scale, using a daily time step, or for simulating
damages to homes, and EUR 50 000 for physical damage to                 the flood forcing within the small Mediterranean basins,
people.                                                                 using an hourly or sub-hourly time step (Forestieri et al.,
                                                                        2016).
                                                                           TOPDM conceptualizes the basin as two different bucket
                                                                        types, i.e., the soil moisture system, which is represented
3   Material and methods                                                by a series of storages with capacity c, and the groundwa-
                                                                        ter bucket, which interacts with the sub-surface system (i.e.,
This section presents hydrological and hydraulic models that            soil moisture storage) and exclusively receives water vol-
were used for simulating the event that affected the Uditore–           umes from it. Each storage in the soil moisture system can
Passo di Rigano district. Both the models have been devel-              take water from rainfall and lose it by evaporation and/or ver-
oped at the Department of Engineering of UNIPA. A brief                 tical drainage, until one of the following conditions occurs:

Nat. Hazards Earth Syst. Sci., 21, 2563–2580, 2021                                       https://doi.org/10.5194/nhess-21-2563-2021
A. Francipane et al.: A paradigm of extreme rainfall pluvial floods in complex urban areas 2571
the storage fills and generates direct runoff, q 0 , or empties ables, such as the mean level of soil moisture within the wa-
and ceases to lose water by evaporation and vertical drainage. tershed, the percentage of saturated area, the groundwater
The complex process of evapotranspiration from the buckets storage, and the potential and actual evapotranspiration.
is here indicated in its totality by the water lost. The storage For a complete description of the TOPDM, interested read-
capacity, c, is modeled as a random variable with a proba- ers are referred to Noto (2014).
bility density function, p(c). Therefore, that portion of basin
characterized by a capacity ranging between c and c +dc can 3.2 Hydraulic modeling: the WEC-FLOOD
be described as p(c)dc.
According to the type of saturation mechanism in the soil The WEC-FLOOD (Filianoti et al., 2020; Sinagra et al.,
column, the direct runoff from the soil moisture system (i.e., 2020) is a two-dimensional (2D) hydraulic model that solves
fast response) can be of two types, namely Hortonian or Dun- the Saint-Venant equations to study the flood propagation
nian. While the Dunnian runoff comes from a saturation ex- within a 2D domain. The model is suitable for studies in
cess mechanism, the Hortonian runoff, instead, occurs in the urban areas, where the high complexity in the modeling of
storages not yet saturated because of infiltration excess. Ver- the surface runoff prompts, for the adoption of 2D models,
tical drainage to groundwater, conceptualized by the model a better simulation of the flooded areas (El Kadi Abderrez-
as a storage with unlimited capacity, is also simulated. This zak et al., 2009; Dottori and Todini, 2013; Lamb et al., 2009;
storage does not exchange water with the sub-surface system Mignot et al., 2006). The use of the diffusive form, instead
and generates the slow response (i.e., baseflow) of the basin. of the fully dynamic one, is mainly motivated by the smaller
The fast response (i.e., surface runoff) of the system is routed sensitivity of the computed water depth with respect to the to-
to the basin outlet by means of a routing module based on the pographic error (Aricò et al., 2011). The hydraulic 2D model
concept of the distributed unit hydrograph (Noto and la Log- (Aricò et al., 2011, 2016) in the diffusive form can be written
gia, 2007). as follows:
Estimation of the spatial distribution of the capacity is ∂H ∂ h5/3 cos α 2/3 ∂H
based on the catchment morphology through the topographic − √
∂t ∂x n |∇H | ∂x
index, which is, as the capacity, an indicator of the catch-
∂ h cos α 2/3 ∂H
5/3
ment capability to produce runoff. The topographic index, λ,
− √ = Q, (4)
is expressed as follows: ∂y n |∇H | ∂y
α where t is time, H is the piezometric head, h is the water
λ = ln , (1) depth, α is the bottom slope, n is the Manning roughness co-
tan β
efficient, Q is the source term, and x and y are the Cartesian
where α is the cumulative area drained through a unit length directions. To make the model work properly, it is necessary
of contour line, and β is the local surface slope. The probabil- to define the initial and boundary conditions for the domain
ity distribution of the storage capacity is derived by assuming (Eq. 4). Boundary conditions may be of the Dirichlet (pre-
a linear relationship between topographic index λ and storage scribed piezometric head or water depth) or Neumann (pre-
capacity c as follows: scribed flux) type.
The solution of the problem (Eq. 4) in the H unknown is
λmax − λ attained by means of a time-splitting approach named MAST
c = cmin + (cmax − cmin ) , (2)
λmax − λmin (marching in space and time; Aricò et al., 2011) and solving
for each time step consecutively in a convective prediction
where cmin is here set equal to 0, and cmax is a model pa-
system (Eq. 5) and a diffusive correction system (Eq. 6) as
rameter. Equation (2) allows us to relate a high topographic
follows:
index value to all those elements located along the network
and characterized by a higher probability of saturation and
∂H 5/3 2/3
∂ h cos α ∂H k
a low topographic index value to those elements located on − q
the hillslope. Once defined, the next step for the spatial dis- ∂t ∂x n ∇H k ∂x
tribution of c is to fit on it a probability distribution. Here, a
gamma distribution has been used as follows: ∂ h5/3 cos α 2/3 ∂H k
− q =Q (5)
k−1 ∂y n ∇H k ∂y
e−[(c−ε)/θ]
c−ε
p(c) = , (3)
θ θ 0(k)
where the parameters θ , ε, and k derive from the mean, stan-
dard deviation, and skewness of the sample, respectively.
The model returns as output, in addition to the hydrograph
at the outlet of the basin, different hydrological state vari-
https://doi.org/10.5194/nhess-21-2563-2021 Nat. Hazards Earth Syst. Sci., 21, 2563–2580, 20212572 A. Francipane et al.: A paradigm of extreme rainfall pluvial floods in complex urban areas
reliability of the hydraulic modeling results, above all in cor-
respondence with viale Regione Siciliana and the Da Vinci
and Michelangelo underpasses, which were the most affected
areas of the investigated domain. The georeferencing of the
images was possible by matching the crowdsourced data with
information gathered from Google Street View.
Figure 8. Computational mesh of WEC-FLOOD model. The ver- 4 Results and discussion
tices of each cell (black dots) are the computational centers of the
cells (i.e., the point at which the water surface is computed for the This section presents the results of the numerical reconstruc-
cell) and are obtained as the circumcenters of the generalized De- tion of the flooding event that affected the city of Palermo on
launay triangulation. 15 July 2020 that arose from the modeling framework pro-
posed in this study. In particular, the hydraulic forcing to be
propagated within the study area consists of the hydrographs
5/3 simulated at the outlets of the four contributing catchments
∂η ∂ hkm cos α 2/3 ∂(η − ϑ)
− q (yellow circles in Fig. 3) with the TOPDM. The hydrographs
∂t ∂x n ∇H k ∂x
were propagated within the study area with WEC-FLOOD to
5/3 simulate the flood map for the event under study.
km 2/3
cos α ∂(η − ϑ)
∂ h = 0,
− q (6)
∂y n ∇H k ∂y 4.1 Hydrological modeling
where η = H − H k+1/2 , ϑ = H k − H k+1/2 , and hkm is a wa- The spatial distribution of the topographic index λ was de-
ter depth value in the computational cell (Fig. 8) obtained by rived from the 2 m resolution digital elevation model (DEM)
local mass balance. It is worth observing that the formulation data of the study area (Fig. 3) with the single flow direction
of Eq. (5) differs from the original one (Eq. 4) in the time algorithm (SFD; O’Callaghan and Mark, 1984). The DEM is
level of spatial gradients of H , in which the prediction steps available at the SITR (Sistema Informativo Territoriale Re-
are kept constant in time and equal to the values computed gionale della Sicilia – Geographical Information System of
at the end of the previous time step. The reader is referred to Sicily). λ was used to derive the specific contributing area
the original papers for more details. and the slope of each catchment with the Wolock–McCabe
The spatial discretization of the 2D domain is performed method (Wolock and McCabe, 1995). The grid cells with
with an unstructured triangular mesh, satisfying the gener- a null value of the slope, which would make the λ calcula-
alized Delaunay conditions (Aricò et al., 2011). The source tion impossible, were replaced by very small values of the
term Q in Eq. (4) is given either by the net rainfall intensity, slope. By these calculations, the areas characterized by the
which is integrated over all the cell area (Fig. 8), or by the highest values of the topographic index are located along the
storm hydrograph, if the cell is a boundary cell. drainage network. The relative frequency of the topographic
index has been used to derive the spatial distribution of the
3.3 Crowdsourced data storage capacity, c, using Eq. (2), while a three-parameter
Gamma distribution has been fitted to the distribution of c
One of the main difficulties when evaluating the reliability of through Eq. (3).
hydraulic simulations in urban areas is the absence of mea- Rainfall data collected at the Uditore, Zootecnico, UIR,
sured water depth values to be used for the validation of Bellolampo, and OTT (see Fig. 3) rain gauges were interpo-
results. To overcome this problem, many studies have used lated with the inverse distance weighted (IDW) method to
crowdsourced data to analyze flood events (Annis and Nardi, provide the spatial rainfall field over the study area; the dis-
2019; Mazzoleni et al., 2015, 2018; Smith et al., 2017; Yu et tributed rainfall was then used to obtain the rainfall forcing,
al., 2016). at the catchment scale, of the hydrological model.
Considering the high population density that characterizes The Passo di Rigano drainage system was supposed to be
the city of Palermo in the proximity of the viale Regione Si- in a perfect condition of maintenance, even though its actual
ciliana, and that it is a very busy road, especially during the state is not known because of its complexity. The informa-
summer period, the flood occurring on 15 July 2020 was pho- tion provided by the municipality of Palermo was used to
tographed and filmed by many social network users. set the maximum discharge (i.e., channel capacity) for the
Data (e.g., videos and pictures) from YouTube and on- Borsellino, Celona, Luparello, and Mortillaro channels equal
line local magazines (e.g., PalermoToday, Giornale di Sicilia, to 40, 14, 25, and 11 m3 s−1 , respectively. These channel
Live Sicilia, La Voce dell’Isola, etc.) were used to verify the capacities were then subtracted from the simulated hydro-
Nat. Hazards Earth Syst. Sci., 21, 2563–2580, 2021 https://doi.org/10.5194/nhess-21-2563-2021A. Francipane et al.: A paradigm of extreme rainfall pluvial floods in complex urban areas 2573
Manning coefficient values have been adopted for urban and
natural areas (Chow, 1959), with values equal to 0.03 and
0.05 s m−1/3 , respectively.
4.2.2 2D urban flood simulation
The numerical results from the hydraulic model in some
of the most affected areas during the flood under analysis
were compared with specific reports, crowdsourced data, and
satellite images to assess the goodness of the simulations.
Figure 11 shows the map of the flooded areas returned by
the simulations in WEC-FLOOD. The results show a good
agreement with what happened on that day, based on the fire
Figure 9. Flow discharge obtained from the hydrological simula- department reports, images, videos, and interviews collected
tions in TOPDM. The bars in the upper part of the figure indicate from the web that were shared by people on that day. As
the IDW interpolated precipitation over the four basins. it is possible to notice from Fig. 11, most of the Uditore–
Passo di Rigano district (see the red polygon in Figs. 1 and 3)
was flooded. The most-affected areas were the streets within
graphs and were supposed to be conveyed downstream of the the district and the tramline, which turned into a river that
study area by the culverts. finished as waterfall in the Da Vinci underpass (picture 1
Figure 9 shows the flow hydrograph for each channel af- in Fig. 12). It was precisely the Da Vinci underpass (box 1
ter the subtraction of its channel capacity. As it is possible in Figs. 11 and 12), along with the Michelangelo underpass
to notice from Fig. 9, as compared to the Borsellino, Celona, (box 2 in Figs. 11 and 13), that formed the most critical area
and Luparello hydrographs, the contribution of the Mortillaro on 15 July 2020.
basin is very small (i.e., hydrograph peak about 6 m3 s−1 ) Figures 12 and 13 show the results of simulations in WEC-
since its channel capacity can intercept almost the entire hy- FLOOD for the Da Vinci and Michelangelo underpasses,
drograph. respectively. During the flood event, the two underpasses
worked as two reservoirs, where the water depth reached val-
4.2 Hydraulic modeling
ues higher than 4 m. Also in this case, it is possible to notice
a good qualitative match with the historical pictures taken
4.2.1 The domain reconstruction
from the people in the Da Vinci (Fig. 12) and Michelangelo
The digital reconstruction of the hydraulic computing do- (Fig. 13) underpasses. The simulation returned water depths
main was carried out using the 2 m resolution DEM provided of about 3.2 and 5.0 m in points 1 and 2 of Fig. 12, respec-
by the SITR. The complexity of the urban area required an tively, which are totally compatible with values reported by
improvement of the built-up environment by manually insert- the fire department (i.e., between 4.5 and 5.0 m in the deep-
ing the plano-altimetric trend of the elements that may affect est point of the Da Vinci underpass). With reference to the
flow direction, such as traffic islands, the tramline, buildings, Michelangelo underpass, the model returned water depths of
and underpass roads (green and orange elements in Fig. 10), about 1.5 m in points 1 and 2 and about 2.3 m in point 3 of
not reproduced by the DEM model. The study area has a Fig. 13, which are compatible with the water levels shown by
surface of 9.2 km2 and is very irregular due to its high an- the pictures.
thropization. In order to make a further evaluation of the goodness of
According to the outline and the constrained elements in- the results in terms of flooded area extent, these have been
side the domain, a computational mesh of 771 018 elements qualitatively compared with images provided by the Coper-
and 412 919 nodes was generated. The resulting mean length nicus Sentinel-2 project (Drusch et al., 2012) of the European
of the triangle sides is between 3 and 8 m. A null water depth Space Agency (ESA) for 16 July 2020 at around 09:50 UTC
was assumed to be the initial condition. The discharge hydro- and limited to the areas of the Da Vinci and Michelan-
graphs of the basins named Borsellino, Celona, Luparello, gelo underpasses. The Sentinel-2 images of 14 July 2020 at
and Mortillaro, simulated with the TOPDM (Fig. 9), were around 10:00 UTC (i.e., the day before the flooding event)
assigned as inlet boundary conditions and then propagated and 16 July 2020 at around 10:00 UTC (i.e., the day after the
within the domain of study with the hydraulic model. More- flooding event) are reported in the Supplement (see Fig. S4a
over, precipitation over the entire domain was obtained from and b, respectively). In particular, Fig. S4b reveals the traces
the interpolated rainfall field. A zero-diffusion condition was left by the mud the day after the flooding event in the two
assigned to the outlet boundary (blue line in Fig. 10). Par- underpasses, which are compatible with the extension of the
ticular attention has been paid to the choice of the rough- flooded area returned by the WEC-FLOOD numerical simu-
ness coefficient to be used for the simulations; two different lations.
https://doi.org/10.5194/nhess-21-2563-2021 Nat. Hazards Earth Syst. Sci., 21, 2563–2580, 20212574 A. Francipane et al.: A paradigm of extreme rainfall pluvial floods in complex urban areas
Figure 10. Domain reconstruction for the 2D hydraulic simulation in WEC-FLOOD. Source: © Google Maps Satellite basemap available
within the QuickMapServices plugin of Quantum GIS.
Figure 11. Map of the maximum flood depths reached on 15 July 2020 for the Uditore–Passo di Rigano district as simulated in WEC-FLOOD.
The yellow arrows indicate the flow directions of the flood. Source: © Google Maps Satellite basemap available within the QuickMapServices
plugin of Quantum GIS.
4.3 Future directions in urban stormwater a protection system that includes accurate activities of fore-
management cast and assessment of the risk, the adoption of adequate pre-
vention and protection measures, and a correct residual risk
Effective assessment and management of the hydraulic risk management.
in an urban context should be the result of a well-balanced
and dynamic development of all the essential components of
Nat. Hazards Earth Syst. Sci., 21, 2563–2580, 2021 https://doi.org/10.5194/nhess-21-2563-2021A. Francipane et al.: A paradigm of extreme rainfall pluvial floods in complex urban areas 2575
Figure 12. Maximum flood depths for the Da Vinci underpass as simulated in WEC-FLOOD. The yellow arrows indicate the flow direc-
tions of the flood. Source: © Google Maps Satellite basemap available within the QuickMapServices plugin of Quantum GIS. Source pic-
ture 1: PalermoToday (https://www.palermotoday.it/cronaca/nubifragio-palermo-15-luglio-2020.html, last access: 23 August 2021). Source
picture 2: Monreale Press (https://www.monrealepress.it/2020/07/15/tragedia-in-viale-regione-morte-quattro-persone-nei-sottopassi/, last
access: 23 August 2021).
The increasing availability of accessible crowdsourced in- fall monitoring and early flood warning in order to take ap-
formation, along with more accurate hydrological and hy- propriate civil protection actions (e.g., closure of roads and
draulic models, suggests new approaches in urban flood underpasses, warnings to the population, etc.). However, as
modeling, highlighting the importance of developing frame- it has been shown in this study, sometimes the rainfall event
works capable of doing the following: causing an urban flood can be extremely difficult to forecast
due to its very fast emergence and intrinsic morphometric
1. producing reliable reconstructions of occurred events characteristics of the area. In such a case, the real-time mon-
and mapping particularly vulnerable areas; itoring of the flood event (e.g., real-time observation of water
levels and precipitation in some strategic points or locations)
2. using crowdsourced data, considering that satellite data
could be an important option to drive emergency actions and
are not always adequate for obtaining observations dur-
reduce the potential flood damages.
ing (or after) such critical events (see, for instance,
In this regard, after the urban flood event of 15 July 2020,
Fig. S4) and are often not timeously available because
the municipality of Palermo and the integrated water service
of the satellite orbit revisit time;
company of AMAP S.p.A. planned the realization of a real-
3. forecasting, in near-real time, the potential effects of in- time monitoring network, including seven water level sen-
coming rainfall and, consequently, selecting adequate sors and cameras installed at different strategic and particu-
mitigation strategies; and larly vulnerable sites over the city; two of these sensors have
already been installed in the Da Vinci and Michelangelo un-
4. running multi-scenario simulations during the urban ex- derpasses and are connected to traffic lights, opportunely in-
pansion planning phase to preliminarily evaluate the stalled over the ring road of Palermo, to inhibit the vehicular
effects of both new urban expansions, including gray, transit when a prefixed threshold water level in the under-
green, and blue infrastructures, and possible alternative passes is exceeded. Such a measure could probably have sig-
interventions on the urban drainage systems to adapt nificantly reduced the damage for vehicles during the flood
cities to the future hydraulic risks. of 15 July 2020 and, in general, could considerably reduce
the risk of mortality, considering that more than half of the
In areas particularly susceptible to pluvial and flash floods, fatalities attributed to flash floods (i.e., 56.1 %) in the 50-
it is extremely important to enhance the capability of rain-
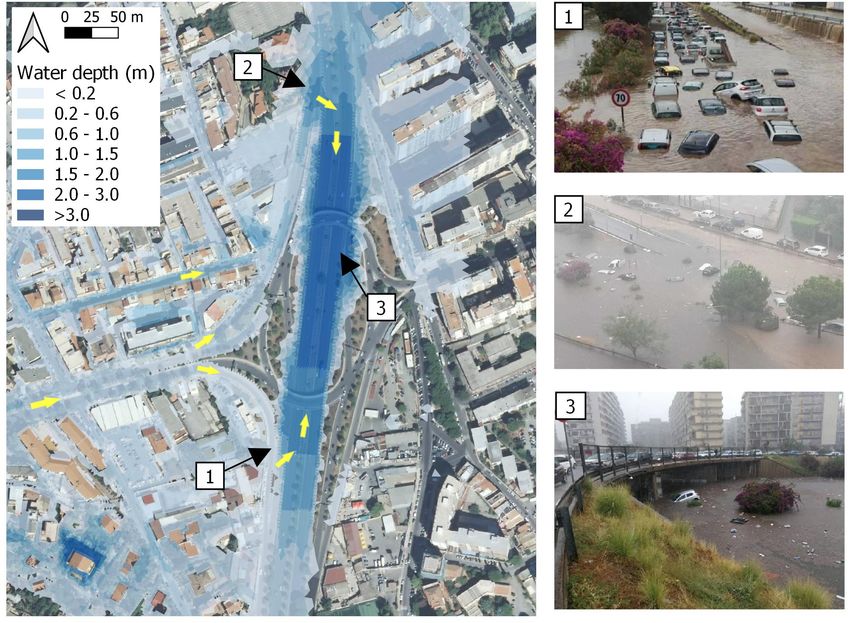
https://doi.org/10.5194/nhess-21-2563-2021 Nat. Hazards Earth Syst. Sci., 21, 2563–2580, 20212576 A. Francipane et al.: A paradigm of extreme rainfall pluvial floods in complex urban areas Figure 13. Maximum flood depths for the Michelangelo underpass as simulated in WEC-FLOOD. The yellow arrows indicate the flow directions of the flood. Source: © Google Maps Satellite basemap available within the QuickMapServices plugin of Quantum GIS. Source picture 1: PalermoToday (https://www.palermotoday.it/foto/cronaca/allagamento-palermo-15-luglio-2020-foto/ #allagamento-festino-2020-viale-regione-4.html&gid=1&pid=1, last access: 23 August 2021). Source picture 2: La Repubblica Palermo (https://palermo.repubblica.it/cronaca/2020/07/15/news/palermo_-262015602/, last access: 23 August 2021). Source picture 3: Stret- toWeb (http://www.strettoweb.com/foto/2020/07/maltempo-sicilia-alluvione-palermo-morti-dispersi-bambini-ipotermia-foto/1037325/, last access: 23 August 2021). year period (1965–2014) in Italy are car related (Salvati et ban green areas, green roofs, pervious pavements, or rain- al., 2018). fall harvesting systems, which could contribute to mitigat- Nowadays, it is important to point out the need to pay ing the effects of rainfall–runoff response of ordinary rainfall greater attention to the development/modification of urban events, with a return period comparable to that used to de- areas, where the alterations induced on the soil properties sign the drainage system, while solutions such as the urban must be accompanied by an integrated planning system for flood retention basins may be suitable for reducing the effects the assessment of future risk and aiming to find new paths of more severe rainfall, with return period which is slightly towards the risk adaptation of smart, sustainable, and flood- higher than that characteristic of the urban drainage system. resilient cities. In highly urbanized areas, where modifica- For extraordinary rainfall events, such as the one that has tions to the existing urban drainage system are difficult and caused the event of Palermo investigated here, the only so- under a climate change context, with more frequent heavy lutions that could contribute to reducing damages and risks rainfall events, it is necessary to shift towards a new way of are probably those oriented to the concept of floodability managing the hydraulic risk and adapting cities to it. (La Loggia et al., 2020), which is based on the concept that There is, therefore, the need for a new paradigm capable flooding can be tolerated by the society and has to be viewed of proposing solutions that are changeable according to the as a driver for societal development. A floodable system is a rainfall event that is causing the flooding event. In this re- well-informed aggregation of resistant, resilient, and flood- gard, several studies (Ahiablame et al., 2013; Liu et al., 2014; able subsystems in which people are the key actors. In such Zahmatkesh et al., 2015) have demonstrated the effectiveness a system, people are instructed and trained to prepare them- of best management practices (BMPs) and solutions inspired selves and adapt their properties and activities to the possibil- and supported by nature, i.e., the so-called natural-based so- ity of flood events and then to “live with floods”. A learning- lutions (NBSs), in significantly reducing runoff volumes and by-doing process is adopted to make the population able to peak discharges and increasing the times to the peak of an adapt its strategies to the evolution of events and then also urban flooding. In this regard, it would be possible to plan to face unexpectedly severe events. Moreover, the involve- the use of sparsely distributed NBSs and BMPs, such as ur- ment of other actors, such as public bodies, citizen organi- Nat. Hazards Earth Syst. Sci., 21, 2563–2580, 2021 https://doi.org/10.5194/nhess-21-2563-2021
A. Francipane et al.: A paradigm of extreme rainfall pluvial floods in complex urban areas                                        2577

zations, professional associations, commercial and industrial       ing of both rain and flood events, have made possible to ver-
corporations, and technical experts, support the integration        ify the reliability of the hydraulic model by means of reports
of structural mitigation measures with individual and coordi-       and hundreds of pictures and videos found on social media.
nated actions that result in a reduction in cities’ vulnerability   In this regard, the modeling framework here developed can
and an improvement of the society’s adaptivity.                     be assumed to be a paradigm for the modeling of extreme
   Such a new paradigm probably requires a change in the            rainfall pluvial floods in complex urban areas.
aesthetic convention by which the only purpose of parks and            The study of the event of 15 July 2020 has pointed out that
playgrounds is recreation. Indeed, instead of assigning recre-      the city of Palermo, with its long track of history – as with
ation as the exclusive use of parks, these could be designed to     many cities in the world – cannot plan the design of new,
serve as temporary storage areas to fulfill hydrological roles.     larger sewer pipes that pass under the city or the construc-
Open spaces could thus become spaces for restoring the dam-         tion of flood diversion channels that drain the water coming
age done by excessive urban development, both in terms of           from the upstream-contributing basins. There is, therefore,
hydrology and architecture, thus making it possible to adapt        the need to implement some new ideas such as the one of
cities to future risk.                                              floodability. Floodable cities are able to avoid physical dam-
                                                                    age and socioeconomic disruption during a flood. Due to this
                                                                    feature, floodable cities are more than resilient because their
5   Conclusions                                                     systems do not aim to return to their pre-existing equilibria
                                                                    quickly and efficiently but to adapt and find new equilibria in
This study reproduces the dynamics and impacts of a recent          which flooding is an event “to live with”. As a matter of fact,
urban flood that affected the city of Palermo (Sicily, Italy),      change cannot be solely technical or infrastructural when
mainly focusing on the analysis of the precipitation event that     considering that services, functions, land use, and infrastruc-
caused it, which can be classified as an extraordinary event,       ture will change and may be different in the steady state (i.e.,
and the hydrological and hydraulic modeling framework nec-          when the flood is not happening) compared to when they are
essary to correctly simulate its effects on rainfall-induced        in the event state (i.e., during flooding); therefore, change
runoff response. According to the last report released by           must involve an entire society.
IPCC (Intergovernmental Panel on Climate Change; 2019),                Thus, water and urban planning integration can be consid-
climate change and global warming are significantly chang-          ered as the keys needed to develop useful strategies that are
ing the frequency of these types of events, which are becom-        able to make cities resilient and floodable. Floodability does
ing the new normal in the Mediterranean area; this is leading       not introduce new mitigation measures; rather, it provides
to an increased occurrence of short duration rainfall extremes      a new perspective through which it is possible to combine
that have caused landslides and floods in the last few decades      existing measures in a framework that incorporates societal,
(Yin et al., 2018). Moreover, the rapid and progressive urban-      economic, environmental, and technical aspects, as demon-
ization, especially for larger cities with important historical     strated for the city of Palermo.
centers, with continuous losses of natural soil and substantial
modifications to natural drainage systems, is profoundly al-
tering the effects of the rainfall–runoff response of heavy pre-    Code availability. The TOPDM model is available upon request
cipitation on urban areas, often with dramatic consequences.        by contacting the corresponding author directly by email. The
In this regard, the case study investigated here, due to the pre-   WEC-FLOOD model was developed by the WECONS (Water
cipitation characteristics, effects of rainfall–runoff response,    Engineering CONSulting) and is not publicly accessible. Cur-
                                                                    rently, the WECONS is working to develop an open-source ver-
flooding dynamics, and degree of urbanization, can be con-
                                                                    sion of the model. For more information, please visit https://www.
sidered as representative of what many cities in the Mediter-       wecons.it/ (last access: 23 August 2021; WECONS, 2021) or con-
ranean area may have to deal with in the near future.               tact Marco Sinagra directly by email (marco.sinagra@unipa.it or
   The flooding event has been simulated using a cascading          m.sinagra@wecons.it).
hydrological and 2D hydraulic model, and the results have
been validated through a qualitative comparison with crowd-
sourced information and some satellite post-event images.           Data availability. The authors collected original precipitation data
The hydraulic model has shown relevant performances in re-          from different sources. The original data are available upon request
producing the flooding under analysis, as demonstrated by           by contacting the corresponding author directly by email.
the qualitative comparison with reports, pictures, and satel-
lite images acquired during and after the event. The crowd-
sourced data, which represent a new frontier to improve the         Supplement. The supplement related to this article is available on-
observation, understanding, and modeling of floods, espe-           line at: https://doi.org/10.5194/nhess-21-2563-2021-supplement.
cially in an urban area, where the enormous and increasing
diffusion of mobile devices (e.g., smartphones, tablets, etc.)
makes it possible to acquire real-time and no cost monitor-

https://doi.org/10.5194/nhess-21-2563-2021                                 Nat. Hazards Earth Syst. Sci., 21, 2563–2580, 2021
You can also read