A restructured and updated global soil respiration database (SRDB-V5) - ESSD
←
→
Page content transcription
If your browser does not render page correctly, please read the page content below
Earth Syst. Sci. Data, 13, 255–267, 2021
https://doi.org/10.5194/essd-13-255-2021
© Author(s) 2021. This work is distributed under
the Creative Commons Attribution 4.0 License.

                        A restructured and updated global soil
                            respiration database (SRDB-V5)
          Jinshi Jian1 , Rodrigo Vargas2 , Kristina Anderson-Teixeira3,4 , Emma Stell2 , Valentine Herrmann3 ,
             Mercedes Horn5 , Nazar Kholod1 , Jason Manzon6 , Rebecca Marchesi3 , Darlin Paredes7 , and
                                                  Ben Bond-Lamberty1
             1 Pacific Northwest National Laboratory, Joint Global Change Research Institute at the University of

             Maryland–College Park, 5825 University Research Court, Suite 3500, College Park, MD 20740, USA
                  2 Department of Plant and Soil Sciences, University of Delaware, Newark, DE 19716, USA
          3 Conservation Ecology Center, Smithsonian Conservation Biology Institute, Front Royal, VA 22630, USA
       4 Center for Tropical Forest Science-Forest Global Earth Observatory, Smithsonian Tropical Research Institute,

                                            Panama City, 0801, Republic of Panama
                      5 University of Vermont, Rubenstein School of Environment and Natural Resources,

                                                   Burlington, VT 05405, USA
                                    6 University of Maryland, College Park, MD 20740, USA
                       7 Georgetown University, School of Foreign Service, Washington, DC 20057, USA

            Correspondence: Jinshi Jian (jinshi@vt.edu) and Ben Bond-Lamberty (bondlamberty@pnnl.gov)

                                   Received: 30 May 2020 – Discussion started: 6 August 2020
                      Revised: 5 December 2020 – Accepted: 16 December 2020 – Published: 3 February 2021

      Abstract. Field-measured soil respiration (RS , the soil-to-atmosphere CO2 flux) observations were compiled
      into a global soil respiration database (SRDB) a decade ago, a resource that has been widely used by the bio-
      geochemistry community to advance our understanding of RS dynamics. Novel carbon cycle science questions
      require updated and augmented global information with better interoperability among datasets. Here, we re-
      structured and updated the global RS database to version SRDB-V5. The updated version has all previous fields
      revised for consistency and simplicity, and it has several new fields to include ancillary information (e.g., RS
      measurement time, collar insertion depth, collar area). The new SRDB-V5 includes published papers through
      2017 (800 independent studies), where total observations increased from 6633 in SRDB-V4 to 10 366 in SRDB-
      V5. The SRDB-V5 features more RS data published in the Russian and Chinese scientific literature and has an
      improved global spatio-temporal coverage and improved global climate space representation. We also restruc-
      tured the database so that it has stronger interoperability with other datasets related to carbon cycle science. For
      instance, linking SRDB-V5 with an hourly timescale global soil respiration database (HGRsD) and a community
      database for continuous soil respiration (COSORE) enables researchers to explore new questions. The updated
      SRDB-V5 aims to be a data framework for the scientific community to share seasonal to annual field RS mea-
      surements, and it provides opportunities for the biogeochemistry community to better understand the spatial and
      temporal variability in RS , its components, and the overall carbon cycle.
         The database can be downloaded at https://github.com/bpbond/srdb and will be made available in the Oak
      Ridge National Laboratory’s Distributed Active Archive Center (ORNL DAAC).
         All data and code to reproduce the results in this study can be found at https://doi.org/10.5281/zenodo.3876443
      (Jian and Bond-Lamberty, 2020).

Published by Copernicus Publications.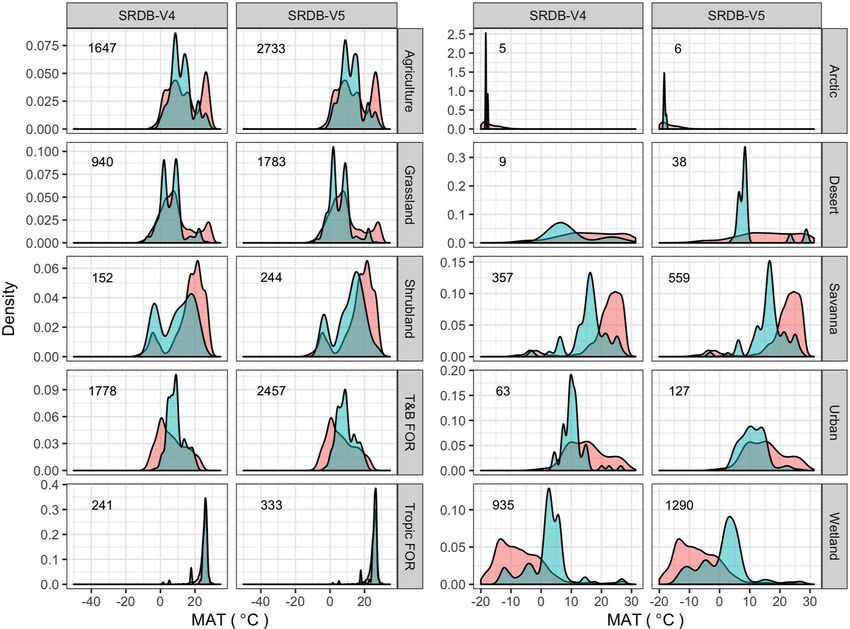
256                                     J. Jian et al.: A restructured and updated global soil respiration database (SRDB-V5)

1   Introduction                                                    0.1 Pg C yr−2 . The SRDB has been widely used in the past
                                                                    decade since the first version was published (Bond-Lamberty
Soil respiration (RS ), the soil-surface-to-atmosphere CO2          and Thomson, 2010a), and to date it has been cited 359 times
flux, is one of the largest carbon fluxes between the terrestrial   (searched in Google Scholar on 20 May 2020), but its use
land surface and atmosphere (Luo and Zhou, 2010). The ma-           continues to increase each year (Fig. 1).
jority of RS is released by soil microbial/fauna (heterotrophic        The SRDB of Bond-Lamberty and Thomson (2010a) how-
respiration) and plant root respiration (autotrophic respira-       ever only recorded seasonal to annual RS fluxes, hindering
tion). Soils hold a large amount (> 2000 Pg C to 1 m depth)         analyses at finer temporal resolutions. Based on the SRDB,
of carbon, more than the total carbon stock in the atmosphere       Jian et al. (2018c) collected SRDB studies reporting diur-
and aboveground plants (Batjes, 2016; Tarnocai et al., 2009).       nal RS and compiled these into a global hourly soil res-
Thus, its C efflux to the atmosphere has major implications         piration database (HGRsD). Similarly, Jian et al. (2018a)
for our understanding of ecosystem- to global-scale biogeo-         further collected detailed monthly and daily timescale RS
chemical cycling. For better monitoring of soil carbon dy-          measurements into a global monthly and daily soil respi-
namics as well as to investigate how soil carbon responds to        ration database (MGRsD). More recently, Bond-Lamberty
global climate change, it is important to measure RS across         et al. (2020) have built a database (COSORE) of continuous
different vegetation types and climate conditions.                  (typically half-hourly or hourly) datasets from globally dis-
   Many field experiments have been conducted in recent             tributed sites. With these different-timescale databases, RS
decades to measure RS in different climate conditions and           temporal variability and its time-related driving processes
vegetation types (Bond-Lamberty and Thomson, 2010b;                 and uncertainties can be analyzed (Jian et al., 2018a, b, c).
Davidson et al., 1998; Raich and Potter, 1995). However, the        There is still a need to improve interoperability among RS
resulting estimates of seasonal to annual RS fluxes are scat-       databases to expand available information, improve database
tered throughout the scientific literature in a variety of for-     usage, and advance our understanding of RS dynamics across
mats. Therefore, compiling past RS measurements together            multiple spatial and temporal scales.
into a standardized data framework to support synthesis anal-          In approaching a decadal reworking of the SRDB, we en-
ysis is very important to advance carbon cycle science.             visioned that it required improvements to increase its us-
   Published site-scale RS measurements across the globe            age across different disciplines. Some important information
have been compiled and standardized into global soil respira-       (e.g., collar area, collar insertion depth, RS measure time,
tion databases to support synthesis studies, macro-to-global-       soil temperature, soil moisture, soil temperature measure
scale RS estimates, and soil carbon response to climate             depth, and soil moisture measure depth) was not included
change investigation (Bond-Lamberty and Thomson, 2010a;             in the older versions (hereafter named SRDB-V1 to SRDB-
Raich and Schlesinger, 1992). Schlesinger (1977) compiled           V4), and thus important questions such as whether RS sur-
one of the earliest listings of RS estimates from diverse           vey time (Cueva et al., 2017), collar insertion depth (Heine-
ecosystems. Raich and Schlesinger (1992) subsequently in-           meyer et al., 2011), and/or how collar cover area affected
tegrated RS from published papers which covered 13 ecosys-          RS measurement accuracy could not be addressed. In addi-
tems and developed a simple linear model between RS and             tion, SRDB-V4 included data mainly published in English
climate factors (i.e., temperature and precipitation), estimat-     (∼ 98 %), while data published in other languages (∼ 2 %)
ing global RS to be 68 ± 4 Pg C yr−1 . Later, more RS mea-          were rarely included (Epule, 2015). Some metadata such
surements (especially measured using the infrared gas ana-          as manipulation and measurement method were not stan-
lyzer, IRGA) were added, and the global RS was updated to           dardized and thus were difficult to use in subsequent meta-
76–81 Pg C yr−1 (Raich et al., 2002; Raich and Potter, 1995).       analyses. For instance, the attempt to link SRDB to the Forest
In 2010, Bond-Lamberty and Thomson (2010a) compiled a               Carbon Database (ForC) showed that the old SRDB structure
comprehensive global soil respiration database (SRDB), and          required modification before it could be linked with ForC
this database was released for public usage. The SRDB con-          (Anderson-Teixeira et al., 2018). Finally, information about
tains annual and seasonal RS measurements, ancillary car-           how heterotrophic (RH ) and autotrophic respiration (RA ) re-
bon pools and fluxes (e.g., gross primary production, net pri-      spond to environmental conditions (i.e., temperature and soil
mary production, ecosystem respiration), response of RS to          moisture) was not included.
temperature and moisture (i.e., model parameters to describe           The older SRDB followed certain data integration prin-
the relationship between RS and temperature and moisture),          ciples, including inclusion criteria, database structure de-
and sites’ background information (e.g., latitude, longitude,       sign, and quality control (Bond-Lamberty and Thomson,
elevation, mean annual temperature, mean annual precipi-            2010a), but improvements could be made. We have updated
tation) (Bond-Lamberty and Thomson, 2018, 2010a). With              it to a new version (hereafter named SRDB-V5) following
more IRGA-based RS measurements added and alkaline-                 FAIR protocols (i.e., findable, accessible, interoperable, and
based measurements excluded, Bond-Lamberty and Thom-                reusable) (Wilkinson et al., 2016). This has been accom-
son (2010b) estimated the global RS to be 98 ± 12 Pg C yr−1         plished by (1) restructuring SRDB and improving its inter-
and estimated that global RS was increasing at a rate of            operability so that data from SRDB-V5 can more easily be

Earth Syst. Sci. Data, 13, 255–267, 2021                                             https://doi.org/10.5194/essd-13-255-2021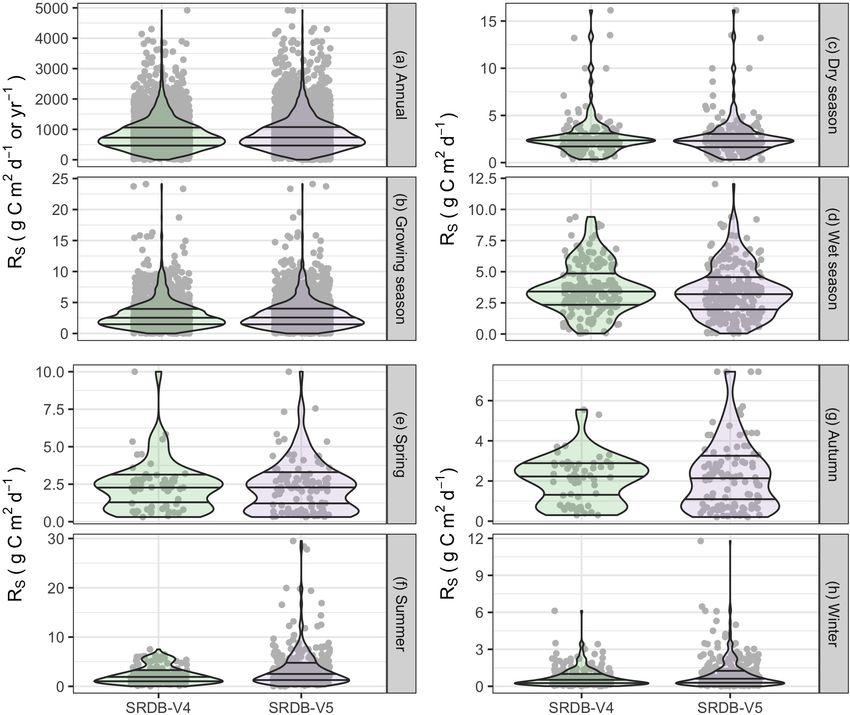
J. Jian et al.: A restructured and updated global soil respiration database (SRDB-V5)                                            257

Figure 1. Summary of studies citing the global soil respiration database (SRDB) between 2010 and 2019. More and more studies are using
SRDB since the first version (SRDB-V1) was published (Bond-Lamberty and Thomson, 2010a).

linked to external datasets; (2) separating the RS , RH , and        sions as comma-separated value data are easy to work with
RA responses to temperature and soil moisture functions              and universally readable by software.
into a separate file to simplify the database and improve its
reusability; (3) adding collar area, collar insertion depth, and
RS measurement time information to SRDB-V5; (4) collect-             2.2   Metadata
ing more RS data published in the Russian and Chinese scien-
tific literature; (5) updating RS records available throughout       We standardized the background information of SRDB-V5.
the world from recently published literature (until 2017); and       Most of the metadata are described by Bond-Lamberty and
(6) improving the metadata description. We hope that these           Thomson (2010a), and here we only describe new added
efforts will significantly improve the future interoperability       columns or metadata with updates (Tables 1 to 3). We added
and reusability of SRDB-V5.                                          five columns (i.e., Site_ID, Collar_height, Collar_depth,
                                                                     Chamber_area, Time_of_day) in SRDB-V5. Four columns
                                                                     (Rs_max, Rs_maxday, Rs_min, Rs_minday) were deleted
2     Methods                                                        (Table 1) because they were rarely reported and had not
                                                                     been used by the community in the past 10 years (accord-
2.1    Soil respiration database restructuring                       ing to our literature search, Rs_max, Rs_maxday, Rs_min,
                                                                     and Rs_minday have never been used). In the Quality_flag
We restructured the SRDB for easier data collection and              column, we added two more flags related to RS temperature
quality control. The previous global RS database versions            equations: Q15 means the equation was developed based on
(SRDB-V1 to SRDB-V4) mainly included two files: a “stud-             seasonal RS data rather than covering at least a whole year,
ies” file, which recorded the detailed metadata for all pub-         and Q16 notes that there is a soil water content (SWC) com-
lished papers examined by the SRDB, and a “data” file,               ponent within the reported equation (Table 1).
which stores all the RS data; a variety of ancillary site, soil,        For many analyses SRDB needs to be connected with
and carbon cycle data (e.g., gross primary production, GPP;          other datasets, and a unique observation ID is essential for
net primary production, NPP; ecosystem respiration); and re-         this process. In the SRDB-V5, we added a “Site_ID” col-
lated background information such as site location, ecosys-          umn to guarantee a unique ID for each Rs_annual obser-
tem type, and management (Bond-Lamberty and Thomson,                 vation within a study, enabling users to easily link SRDB-
2010a). In SRDB-V5 the “studies” file remains unchanged,             V5 records with external data such as MGRsD and HGRsD.
but the “data” file is now separated into two files: “srdb-data”     The Site_ID is in the form of “CC–RC–IC”, where CC is
and “srdb-equations”. This simplifies the structure of the for-      the ISO Alpha-2 country code (https://www.nationsonline.
mer while moving all the “Response of RS to temperature              org/oneworld/country_code_list.htm, last access: 31 Jan-
and moisture” columns in the SRDB to the latter. Note that           uary 2021), RC is region code (state/province), and IC is
the SRDB-V5 file format remains the same as the older ver-           identity code. Country code and region code are always

https://doi.org/10.5194/essd-13-255-2021                                                Earth Syst. Sci. Data, 13, 255–267, 2021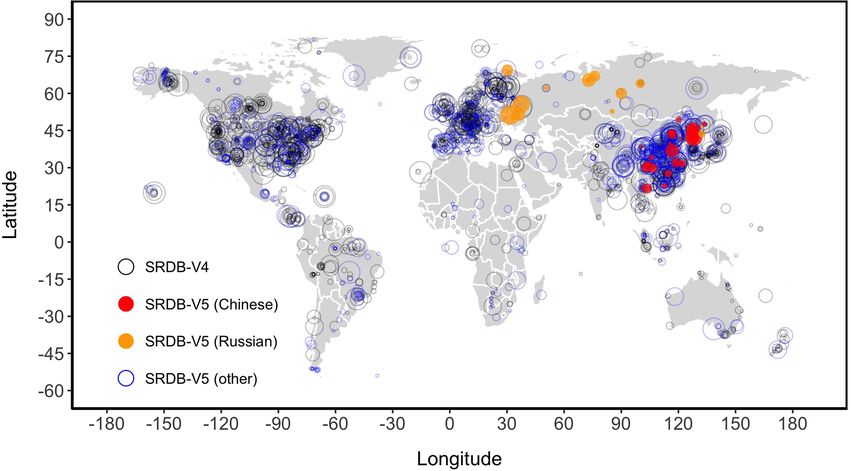
258                                   J. Jian et al.: A restructured and updated global soil respiration database (SRDB-V5)

Table 1. Summary of metadata updates in SRDB-V5 compared with the old version SRDB-V4.

        Column              Description                                                              Comments
        Site_ID             CC–RC–IC (country code–region code–identity code)                        Added in SRDB-V5
        Collar_height       Total height of collar                                                   Added in SRDB-V5
        Collar_depth        Depth of collar inserted into soil (always_Collar_height)                Added in SRDB-V5
        Chamber_area        Area of collar covering the surface                                      Added in SRDB-V5
        Time_of_day         RS survey time (e.g., 8to12 represents RS measured from 08:00 to         Added in SRDB-V5
                            12:00 LT; 0to24 stands for continuous measurement)
        Rs_max              Maximum RS rate in a year                                                Deleted in SRDB-V5
        Rs_maxday           Day of year Rs_max recorded                                              Deleted in SRDB-V5
        Rs_min              Minimum RS rate in a year                                                Deleted in SRDB-V5
        Rs_minday           Day of year Rs_min recorded                                              Deleted in SRDB-V5
        Quality_flag        Q15: equation simulated based on seasonal rather than annual data;       Updated in SRDB-V5
                            Q16: equation with SWC component
        Manipulation        Decreased from 689 unique values to 276 after being standardized         Standardized in SRDB-V5
        Measure_method      See Table 2                                                              Standardized in SRDB-V5
        Partition_method    See Table 3                                                              Standardized in SRDB-V5

Table 2. Summary of standardized measurement method (Meas_method) in SRDB-V5.

        Meas_method            Number of records (n)   Comments
        IRGA                                   7734    Type of infrared gas analyzer (e.g., LICOR 8100A)
        Gas chromatography                     1268    Take gas samples in the field, and measure CO2 concentration back in
                                                       the laboratory to determine soil respiration rate
        Alkali absorption                        910   Using alkali absorption of CO2 to determine soil respiration rate
        Not reported                             238   Measure method not reported in the study
        EC                                        88   Eddy covariance
        Gradient                                  83   Measure CO2 concentration at different soil depth and calculate soil
                                                       respiration rate based on gas diffusion law
        Equation                                  15   Indirectly calculate soil respiration rate (e.g., through relationship be-
                                                       tween soil respiration and GPP)
        Isotope                                    3   Determine soil respiration rate using isotope (e.g., C13 )
        Unknown                                   27   None of above

present, but some studies report only one annual RS value,          by CO2 released from fossil fuel combustion. Similarly, data
and thus IC may or may not be present.                              from the “Warm” and “Precipitation amount change” group-
    We standardized the coding of experimental manipulation,        ings will enable scientists to more easily explore how soil
collapsing the previous ad hoc categories into a smaller set        carbon responds to global climate change. Barba et al. (2018)
of standardized terms. This decreased the number of unique          suggested that bias could arise from measurements made
Manipulation field values from 689 to 276. We used the fol-         in “hotspots” (i.e., areas with high values compared with
lowing criteria to simplify the manipulation in SRDB-V5:            the surrounding environment), and groupings such as “Ant
(1) measurements from no treatment (i.e., control) were cat-        mound” and “High N” facilitate data interpretation and anal-
egorized as “None”; (2) manipulation names were standard-           yses regarding “hotspots”.
ized (e.g., “clipping”, “clip”, and “clipped” are now all stan-        We also standardized the RS measurement method (the
dardized as “Clip”); (3) we used the manipulation level to          Meas_method) and RS partition method (Partition_method)
further describe the difference within a specific manipulation      fields. Measurement method was grouped into nine types
(e.g., “Litter manipulation” could have “double litter”, “50 %      (Table 2), and the partition method was grouped into
litter removal”, “100 % litter removal”). With manipulation         eight types (Table 3). With these changes, scientists can more
standardized, scientists can further analyze how manipula-          easily investigate whether different measure methods affect
tion affects RS . For instance, comparing RS measurements           RS results as well as whether different partition methods af-
from the “CO2 ” group (i.e., elevated CO2 concentration treat-      fect RH and RA partitioning.
ment) with “None” (i.e., control) enables researchers to ana-          Latitude and longitude are key metadata as they can be
lyze how RS responds to CO2 concentration increase caused           used to link RS measurements to spatial data (e.g., precipi-

Earth Syst. Sci. Data, 13, 255–267, 2021                                                https://doi.org/10.5194/essd-13-255-2021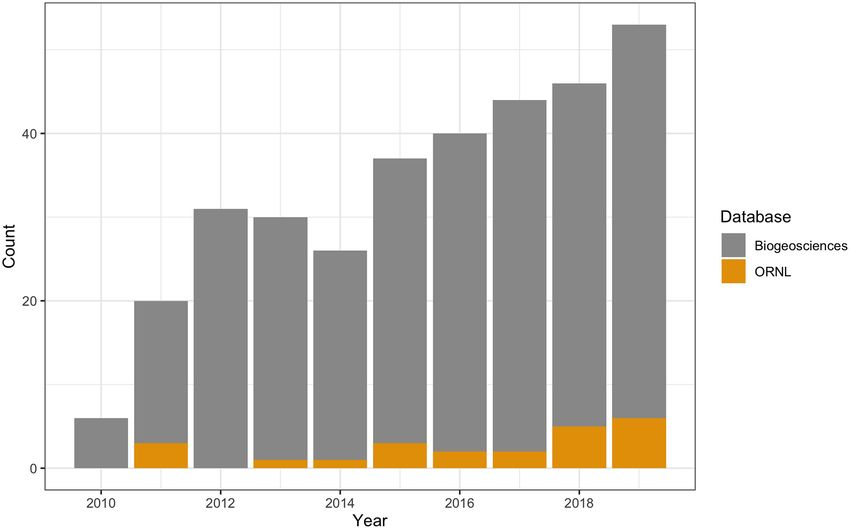
J. Jian et al.: A restructured and updated global soil respiration database (SRDB-V5)                                                259

Table 3. Summary of standardized partition method (Partition_method) in SRDB-V5.

      Partition_method         Number of records (n)   Comments
      Comparison                                150    Separating soil respiration into heterotrophic and autotrophic components by
                                                       comparing with e.g., bare, clear-cut, gap, or clip site
      Exclusion                                1121    Removing roots by trenching, deeply inserting PVC pipe etc.
      Extraction                                180    Directly measure respiration from root to get autotrophic respiration
      Girdling                                   23    Strip the stem bark to the depth of xylem, and measure respiration a few months
                                                       later to get the heterotrophic respiration
      Isotope                                    68    Separating heterotrophic and autotrophic respiration through isotope labeling
      Model                                      49    Separating heterotrophic and autotrophic respiration through a relationship
                                                       (e.g., the relationship reported by Bond-Lamberty et al., 2004)
      Total belowground car-                     16    Determining heterotrophic and autotrophic respiration through total below-
      bon allocation (TBCA)                            ground carbon allocation calculation
      Other                                     122    None of above

tation and air temperature). During the data collecting pro-          studies in SRDB-V5) which were not included by SRDB.
cess, latitude and longitude values reported in the original          Now we have compiled data from those papers into SRDB-
paper were recorded in our database, generally to two sig-            V5.
nificant digits. However, the precision of SRDB latitude and
longitude can be affected by many factors: first, studies re-
                                                                      2.4    Data quality control
port latitude and longitude at different and sometimes uncer-
tain levels of precision; second, studies use different methods       We developed an R (R Core Team, 2019) script to per-
for recording latitude and longitude; and finally, some stud-         form data quality and consistency checks. For example,
ies have multiple nearby sites but report one general latitude        the latitude and longitude fields have to be in specific
and longitude for all those sites. However, it is unlikely that       ranges, otherwise a warning is raised. For details about
the error is very large, and in general we assume that linking        the data constraints used to check each column in SRDB-
RS measurements to relatively coarse spatial data (e.g., 0.1–         V5, please see the “srdb_check.R” script, which is avail-
0.5◦ resolution) should be unproblematic. When linking to             able in the GitHub repository and as part of every release
high-spatial-resolution data (such as 30 m resolution remote-         download (https://github.com/bpbond/srdb/releases, last ac-
sensing images), users should be aware that the variable and          cess: 31 January 2021). This script is also run on all pull re-
uncertain SRDB latitude and longitude precision may cause             quests to the Github repository, which enables us to flag data
data quality issues. That said, SRDB-V5 was revised to avoid          quality problems before changes are made to the database.
unrealistic locations such as points in the ocean. Further-
more, the latitude and longitude fields should be within −90
to 90◦ and −180 to 180◦ , respectively; whenever they are out         2.5    Data coverage analysis
of these ranges, a warning is raised.                                 We compared mean annual temperature (MAT) and mean an-
                                                                      nual precipitation (MAP) of sites from SRDB with the global
2.3     Soil respiration database update                              MAT and MAP to test the representation of the SRDB. We
                                                                      connected the sites from SRDB with external climate data
We updated the SRDB-V5 so that it has temporal coverage               (Willmott and Matsuura, 2001) through latitude and longi-
to 2017 and made an effort to collect RS data published               tude and obtained MAT and MAP. Barren area was masked
in the Russian and Chinese literature to be more inclusive            according to the MODIS land cover (Friedl et al., 2002). Cli-
and expand its spatial coverage. Papers published in English          mate region was retrieved from the climate Köppen classi-
are the majority (∼ 98 %) of sources in SRDB, while pa-               fication (Peel et al., 2007). We also obtained International
pers published in other languages are rarely included (Bond-          Geosphere–Biosphere Programme (IGBP) vegetation classi-
Lamberty and Thomson, 2018, 2010a). This reflects the dom-            fication of the SRDB sites by connecting IGBP classification
inance of English as the language of international science,           data (IGBP, 1990); vegetation was grouped into agriculture,
but there are some data available from the Russian-language           arctic, desert, tropical forest (tropic FOR), temperate & bo-
literature, representing data from a large area (Russia repre-        real forest (T&B FOR), grassland, savanna, shrubland, ur-
sents ∼ 11 % of the terrestrial land surface) and a variety of        ban, and wetland. If the MAT and MAP distribution of SRDB
climate types and vegetation types. In addition, in MGRsD             sites is similar to that of global MAT and MAP distribution, it
and HGRsD, there were some Chinese-language papers or                 should mean that the SRDB better represents the global flux
recently published papers (103 studies, ∼ 5 % of the total            RS distribution as well. We also assume that as data sam-

https://doi.org/10.5194/essd-13-255-2021                                                  Earth Syst. Sci. Data, 13, 255–267, 2021
260 J. Jian et al.: A restructured and updated global soil respiration database (SRDB-V5)
ple size increases, the new database (e.g., SRDB-V5) should as the Sahara. Urban and savanna sites in SRDB had lower
improve its representation compared with the older version MAT compared to their global distribution, probably because
(e.g., SRDB-V1). We tested the representation of sites in dif- many tropical cities and savannas in South America, Asia,
ferent vegetation types (IGBP, 1990). and Africa were rarely measured (Jian et al., 2020; Martin
et al., 2012). We suggest that papers written in other lan-
guages, especially those in Portuguese, Spanish, and French,
3 Results could potentially increase the RS measurements in South
America and Africa.
The number of records of SRDB-V5 is much larger com- Adding new measurements in SRDB-V5 has substantially
pared with older versions. Collecting RS measurements from increased total observations, and the spatial coverage of sites
newly published literature (until 2017) greatly improves the was improved compared with SRDB-V4 (Fig. 2). However,
total number of observations in the database (increased from the distributions of annual RS and seasonal RS (growing, dry,
6633 to 10 366) in SRDB-V5 but only somewhat improved wet, spring, summer, autumn, and winter season RS ) were
its spatial coverage (Fig. 2). The Northern Hemisphere mid- similar in the SRDB-V5 compared to SRDB-V4 (Fig. 5). We
latitude regions, where SRDB-V4 has the most RS sites, had suspect that new RS measurements are collected dispropor-
the largest RS increase in SRDB-V5 as well (blue dots in tionately from the same regions as previously sampled, and
Fig. 2). Adding literature in Chinese did not substantially im- thus future studies should focus more on those regions with
prove the spatial coverage either, possibly because more and fewer data. For the future SRDB update, measurements from
more RS measurements in China have been published in the the Southern Hemisphere, desert, arctic, and tropical forests,
English scientific literature. However, most sites in China are if available, will be important to include.
from the eastern part of the country, and measurements from
western China, if available, will be important to include in fu-
4 Discussion
ture SRDB updates. We collected ∼ 50 papers published in
Russian, but only 14 of them (∼ 0.7 % of total studies of all 4.1 Forecasting global RS , RH , and RA
languages in SRDB-V5) met the criteria (see Bond-Lamberty
and Thomson, 2010a, for details) and were included in the The updated SRDB-V5 provides opportunities for constrain-
database. This small number of papers nonetheless substan- ing global RS estimates in the future. Currently, estimated
tially improved the database’s spatial coverage of the Russian global RS ranged from 68–101 Pg C yr−1 , with many uncer-
landmass (orange circles in Fig. 2). tainties associated with measurements and propagation of er-
MAT and MAP distribution of SRDB sites are very sim- rors evident when upscaling site-specific RS measurements
ilar to global distribution in agriculture, forest, and grass- to regional and global scales (Bond-Lamberty and Thomson,
land regions, indicating good representativeness of SRDB 2010b; Jian et al., 2018a, b; Raich et al., 2002; Raich and Pot-
sites in these three types of vegetation (Figs. 3 and 4). For ter, 1995; Raich and Schlesinger, 1992; Warner et al., 2019).
shrublands, sites in the oldest versions of the database (e.g., For example, RS has been usually measured during daylight
SRDB-V4) did not represent the global distribution well, hours, implicitly assuming that measurements during this pe-
but this distribution was greatly improved as more RS mea- riod represent the mean daily RS . In a water-limited ecosys-
surements were included in SRDB-V5 (Fig. 3). Sites from tem, however, Cueva et al. (2017) estimated a time-of-day
other vegetation types, however, were less representative of bias ranging from −29 % to +40 %. On the global scale,
the corresponding global climate space, with barren lands based on the HGRsD, Jian et al. (2018c) found that not mea-
masked out (Fig. 3, right panel). More specifically, arctic suring RS 24 h continuously contributed less than 6 % of bias
sites in SRDB have relatively narrow MAT and MAP cover- when estimating diurnal RS . Quantifying the amount of bias
age compared with the global arctic MAT and MAP distribu- required detailed information about when RS was measured
tion, probably because many regions in the arctic are covered and how long the measurement lasted (Jian et al., 2018c).
by snow all year round, and thus it is difficult to measure RS In the SRDB-V5, we revised all the studies and collected
at those sites (Virkkala et al., 2019). Desert SRDB sites have the “Time_of_day” information, which should enable future
lower MAT but higher MAP than the global distribution, analyses of how RS measurement bias is related to when RS
probably because (1) the disproportionate number of sam- measurements were collected.
ples in temperate regions (Fig. 2) means that most samples in It is also widely accepted that chamber properties (e.g.,
deserts are likely from wetter deserts; (2) the Sahara has low volume, area) (Davidson et al., 2002) and collar insertion
MAP and high MAT and covers a large area of the world, depth (Heinemeyer et al., 2011) affect the RS measurement
but few studies were conducted there, so that area of the accuracy, but on a global scale, this has not been quantita-
world may simply represent the bias; and (3) many “deserts” tively tested before to our knowledge. We added information
that have been studied are in relatively close proximity to in the SRDB-V5 to enable researchers to investigate whether
urban developments (e.g., southwestern USA, southern Eu- chamber area (smaller chambers are more vulnerable to edge
rope), and those deserts are neither as harsh nor extensive effects, while larger chambers may experience inadequate air
Earth Syst. Sci. Data, 13, 255–267, 2021 https://doi.org/10.5194/essd-13-255-2021J. Jian et al.: A restructured and updated global soil respiration database (SRDB-V5) 261 Figure 2. Spatial distribution of soil respiration (RS ) sites. The gray circles are RS sites from the fourth version of the global soil respiration database (SRDB-V4; n = 1584); the red dots are sites from the literature published in Chinese and added in the fifth version of the global soil respiration database (SRDB-V5; n = 41); the orange dots represent sites from the literature published in Russian and added in SRDB-V5 (n = 16); the blue dots are sites from the literature published in other languages (mainly in English) and added in the SRDB-V5 (n = 840). The size of circles represents the sample size at each measurement site (i.e., bigger circles represent more data). mixing), collar height (which may affect air mixing in the ing from site- to global-scale RS . We recognize that there are chamber), and insertion depth (which may cut off roots) af- many other possible sources of bias, but it is nonetheless pos- fect RS measurement accuracy and bias at seasonal to annual sible that the biogeochemistry community will be able to use scales. SRDB-V5 to improve the confidence of global RS modeling Comparing SRDB-V1 through SRDB-V5, we found that and constrain global carbon cycle estimates. the uneven spatial distribution of RS sites has improved, but Linking SRDB-V5, MGRsD, HGRsD, and COSORE pro- bias still remains, with measurements conducted unevenly vides an opportunity for global RH and RA estimates. Soil around the world and in climate space (Figs. 2–4). The reason respiration mainly consists of two parts, RH and RA , but for the spatially uneven coverage of RS sites is a combination it is difficult to separate these two components, and much of economy, national policy, environmental conditions, spa- fewer RH and RA data are available in the SRDB (Bond- tial heterogeneity, and many other issues. Most obviously, the Lamberty and Thomson, 2010a). Due to a lack of data, far Northern Hemisphere has much more data than the Southern fewer studies have analyzed RH and RA and estimated global Hemisphere as the most economically developed and wealth- RH and RA in the past decades. According to our knowl- iest countries tend to be in the middle latitude of the North- edge, there are only four global RH (or RA ) estimates based ern Hemisphere, and thus more funds, infrastructure, and a on the very limited extant data (n < 500) (Hashimoto et al., broader and deeper pool of students and technical experts are 2015; Konings et al., 2019; Tang et al., 2020; Warner et al., all available to support on-site RS measurement in these re- 2019). In the “srdb-equations” file, response of RH and RA gions. to temperature and moisture information will be recorded, Improving modeling frameworks may help mitigate the which will inspire the study of RH and RA and how they uneven spatial distribution of RS sites. For example, Jian respond to temperature and soil moisture in the future. Fur- et al. (2018b) found that how RS responds to temperature ther, we argue that a big advantage of global soil respira- is significantly different among climate regions, and there- tion databases with finer temporal resolution (i.e., MGRsD, fore climate-specific models may be more appropriate than HGRsD, and COSORE) is that the sample size of RH and a single global model to estimate global RS . Alternatively, RA could be greatly increased (e.g., sample size could be in- machine-learning approaches that account for non-linearity creased 10-fold if using a monthly timescale). In addition, and multiple potential combinations of environmental factors the spatial coverage of RH and RA data could also be im- have been used to estimate global RS (Warner et al., 2019). proved. Based on the monthly RH and RA data and how they SRDB-V5 also significantly increased the RS sample size, relate to environmental conditions (such as temperature and and analyses could be conducted to test whether the increas- precipitation), monthly global RH and RA products could be ing sample size of RS helps reduce uncertainty when upscal- generated, which provide useful data products for the earth https://doi.org/10.5194/essd-13-255-2021 Earth Syst. Sci. Data, 13, 255–267, 2021
262                                      J. Jian et al.: A restructured and updated global soil respiration database (SRDB-V5)

Figure 3. Comparison of mean annual temperature (MAT; ◦ C) around the globe (in red) vs. MAT from the sites in the global soil respiration
database (SRDB; in teal) by the vegetation types. SRDB-V4 represents the older SRDB released in 2018, and SRDB-V5 represents the newest
SRDB published in 2020. Data from SRDB cover 10 vegetation types (agriculture, arctic, desert, tropical forest (tropic FOR), temperate and
boreal forest (T&B FOR), grassland, savanna, shrubland, urban, and wetland). Comparing the fourth version (SRDB-V4) to the newest
version (SRDB-V5), MAT values of agriculture, forest, and grassland sites generally well represent the global MAT; in contrast, MAT from
shrubland sites in the database did not well represent global means in the older SRDB-V4, but their representation significantly improved
in the newest SRDB-V5; for other vegetation types (arctic, desert, savanna, urban, and wetland (including peatland) in the right panel), the
MAT of the database sites does not well represent the global MAT distribution. Note that the barren region was masked using MODIS land
cover data. The number within each panel represents the number of records for each vegetation type.

system models’ (ESMs) benchmarking. The disadvantages                   et al., 2014; Jasek et al., 2014). However, inconsistent re-
of the smaller-timescale databases (MGRsD, HGRsD, and                   sults from different experiments have generated debate re-
COSORE) is that those databases usually have much less                  garding the effects of environmental factors and manipula-
spatial coverage, and much more data are available from the             tions in RS . Now SRDB-V5 includes RS measurements from
growing season than from the non-growing season. There-                 both control and different kinds of treatments, providing op-
fore, spatial upscaling including time may result in additional         portunities for synthesis analysis of how manipulation affects
bias and associated uncertainty that must be carefully inves-           RS . However, these treatment data about RS measurements
tigated.                                                                were rarely used in the past decade as the manipulation infor-
                                                                        mation in older versions of SRDB was not standardized and
                                                                        thus could not easily be used. The updated and standardized
4.2   Perspective                                                       SRDB-V5 manipulation codes have the potential to enable
The updated SRBD-V5 will further support the analysis of                manipulation-driven studies on the macro to global scale.
how different manipulations affect RS . In the past decades,
many field experiments have been conducted to study dif-                4.3    Future improvements
ferent questions, for example, how soil carbon responds to
global climatic warming and changes in precipitation pat-               We made an effort to resolve some issues in the old versions
terns (Vicca et al., 2014) or how human activities (forest              of SRDB (V1–V4), but the database needs to be continuously
management, agriculture cultivation, and pollution) affect              improved in the future. There is much more potentially use-
terrestrial carbon cycling and soil carbon stock (Carrillo              ful information that could be included in future SRDB up-

Earth Syst. Sci. Data, 13, 255–267, 2021                                                   https://doi.org/10.5194/essd-13-255-2021
J. Jian et al.: A restructured and updated global soil respiration database (SRDB-V5) 263
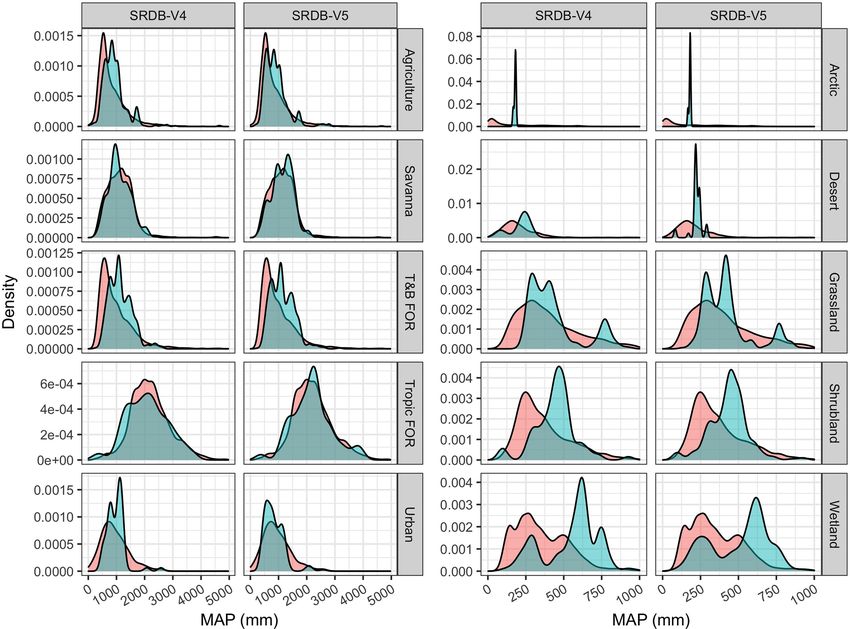
Figure 4. Comparison of mean annual precipitation (MAP; mm) around the globe (in red) vs. MAP from the sites in the global soil respiration
database (SRDB; in teal) by the vegetation types. SRDB-V4 is the older SRDB published in 2018, and SRDB-V5 is the newest SRDB
published in 2020. Data from SRDB covered 10 vegetation types (see Fig. 3). Sites from agriculture, savanna, forest, and urban generally
well represent the global MAP (left panel), while sites from arctic, desert, grassland, shrubland, and wetland (including peatland) do not have
a good MAP representation (right panel). Note that the barren region was masked using MODIS land cover data. The number of records of
each panel is the same as Fig. 3.
dates, although it is important to remember that every addi- remote sensing (Guevara and Vargas, 2019) when this
tional piece of information comes with a never-ending cost variable was not measured at the site.
(in terms of data entry time, quality assurance and quality In addition, some meta information can be improved. For ex-
control, etc). ample, there are still 276 manipulation types in the SRDB-V5
1. Number_of_collar: the number of collars within a cer- and many manipulation types (n = 96 out of 276) with only
tain study area is important information to evaluate the one row of records. Efforts could be made in the database
representability of the RS measurements. update to further simplify the manipulation of SRDB. We
recognize that with thousands of publications included in the
2. Soil organic carbon (SOC): SOC measured in situ or ob- SRDB, it is known that some entries are incorrect, and some
tained from regional or global datasets should be com- information may have been missed during literature collec-
piled into the database (Guevara et al., 2020; Hengl tion. In the past years, users have pointed out many data input
et al., 2017). errors and missing data issues in the SRDB; we made a great
effort to check, and many corrections have been made. How-
3. Currently, Site_ID in SRDB-V5 is only comparable ever, it is inevitable that mistakes and missing information
with Site_ID of MGRsD and HGRsD; further updates still exist; therefore, there is a pressing need to continue with
to Site_ID are necessary so it can connect with more ex- the development of quality assurance and quality control for
ternal datasets (e.g., FLUXNET, COSORE, and Amer- each update.
iFlux and a global database of forest carbon stocks and
fluxes (ForC); Anderson-Teixeira et al., 2018). 4.4 Reducing interoperability barriers
4. Annual_soil_moisture: including a mean value of soil High interoperability is needed to maximize the benefits of
moisture or intra-annual soil variability derived from SRDB-V5 to improve our understanding of the global car-
https://doi.org/10.5194/essd-13-255-2021 Earth Syst. Sci. Data, 13, 255–267, 2021264 J. Jian et al.: A restructured and updated global soil respiration database (SRDB-V5)
Figure 5. Comparison of annual soil respiration (RS ) and seasonal RS (growing, dry, and wet seasons; spring, summer, autumn, and winter)
observations from SRDB-V4 vs. those from SRDB-V5. In summary, adding new measurements does not change the distribution of annual
RS or seasonal RS in the databases.
bon cycle. Interoperability has been defined as an organized recognizing the importance of standardized databases and
collective effort with the ultimate goal to maximize sharing data sharing following FAIR principles.
and using information to produce knowledge, and high inter-
operability is achieved by reducing conceptual, technologi- 5 Code availability
cal, organizational, and cultural barriers (Vargas et al., 2017).
The improved SRDB-V5 has reduced conceptual barriers as All data and code to reproduce the results in this study can be
it provides a standardized and replicable framework to or- found at https://doi.org/10.5281/zenodo.3876443 (Jian and
ganize global RS information that has been used for over Bond-Lamberty, 2020).
a decade (Bond-Lamberty and Thomson, 2010a). It has re-
duced technological barriers by improving standardization of
6 Data availability
data fields (see Tables 1–3) and data formats compatible with
other databases as well as and providing flexible R scripts
Findability and accessibility were well considered and de-
(for details please see Sect. 2.4) in a Github repository for
scribed when SRDB-V1 was published (Bond-Lamberty and
end users and potential data contributors. We recognize that
Thomson, 2010a). To summarize the updating progress,
measuring RS has other technological barriers (e.g., stan-
SRDB-V1 was the first full available dataset, released on
dardization of instrumentation, electrical power supply) that
28 May 2010; SRDB-V2 was released on 13 March 2012,
limit the collection of new measurements in harsh environ-
and RS data of publications from 2011 were integrated into
ments or wide implementation in developing countries. Or-
the database; SRDB-V3 was released on 4 August 2014, and
ganizational barriers remain a challenge as this is a bottom-
RS data of the literature from 2012 were collected and added;
up effort in need of long-term support to continue improving
SRDB-V4 was released on 21 November 2018, and RS data
the quality and the development of the new versions of the
of the literature through 2015 were collected and compiled
SRDB. Finally, we believe that cultural barriers have been
into the database; SRDB-V5 was released on 24 April 2020,
reduced as the global scientific community has improved in
and RS data of the literature from 2017 were collected and
Earth Syst. Sci. Data, 13, 255–267, 2021 https://doi.org/10.5194/essd-13-255-2021J. Jian et al.: A restructured and updated global soil respiration database (SRDB-V5) 265
added (Jian and Bond-Lamberty, 2020). The version release DOE by the Battelle Memorial Institute under contract DE-AC05-
information was recorded at the Oak Ridge National Labo- 76RL01830. We would like to thank Dalei Hao for his help with the
ratory’s Distributed Active Archive Center (ORNL-DAAC). MODIS land cover data processing. Rodrigo Vargas acknowledges
All data and code to reproduce the results in this study can be support from NASA CMS (grant no. 80NSSC18K0173).
found at https://doi.org/10.5281/zenodo.3876443 (Jian and
Bond-Lamberty, 2020).
Financial support. This research has been supported by
the Terrestrial Ecosystem Science program (grant no. DE-
Using and citing SRDB-V5 AC05-76RL01830) and the NASA CMS grant (grant no.
80NSSC18K0173).
SRDB-V5 can be used for individual, academic, research,
commercial, and other purposes and can be repackaged with-
out written permission. Research and non-research products Review statement. This paper was edited by Attila Demény and
using SRDB-V5 should cite this publication. reviewed by two anonymous referees.
7 Conclusions
A global soil respiration database (SRDB) was developed References
to integrate soil respiration measurements from the globe a
decade ago. Since the first release in 2010 (SRDB-V1), it has Anderson-Teixeira, K. J., Wang, M. M. H., McGarvey, J. C., Her-
been widely used to advance our understanding of carbon- rmann, V., Tepley, A. J., Bond-Lamberty, B., and LeBauer, D.
dynamic-related questions. Here, we restructured SRDB to S.: ForC: a global database of forest carbon stocks and fluxes,
a new version (SRDB-V5) following FAIR principles. We Ecology, 99, 1507, https://doi.org/10.1002/ecy.2229, 2018.
Barba, J., Cueva, A., Bahn, M., Barron-Gafford, G. A., Bond-
show that the SRDB substantially improved its represen-
Lamberty, B., Hanson, P. J., Jaimes, A., Kulmala, L., Pumpanen,
tativeness compared with the older versions (SRDB-V1 to J., Scott, R. L., Wohlfahrt, G., and Vargas, R.: Comparing ecosys-
SRDB-V4; Figs. S1 and S2 in the Supplement) and improved tem and soil respiration: Review and key challenges of tower-
its spatial coverage. A primary goal of SRDB-V5 is to im- based and soil measurements, Agr. Forest Meteorol., 249, 434–
prove the interoperability and reusability and make it possi- 443, https://doi.org/10.1016/j.agrformet.2017.10.028, 2018.
ble for scientists to contribute in the future with the ultimate Batjes, N. H.: Harmonized soil property values for
goal to improve our understanding of the global carbon cycle. broad-scale modelling (WISE30sec) with estimates
With those goals in mind, the revised SRDB-V5 is now more of global soil carbon stocks, Geoderma, 269, 61–68,
user-friendly for the ecology, biogeochemistry, and modeling https://doi.org/10.1016/j.geoderma.2016.01.034, 2016.
communities. Bond-Lamberty, B. and Thomson, A.: A global database
of soil respiration data, Biogeosciences, 7, 1915–1926,
https://doi.org/10.5194/bg-7-1915-2010, 2010a.
Bond-Lamberty, B. and Thomson, A.: Temperature-associated in-
Supplement. The supplement related to this article is available
creases in the global soil respiration record, Nature, 464, 579–
online at: https://doi.org/10.5194/essd-13-255-2021-supplement.
582, https://doi.org/10.1038/nature08930, 2010b.
Bond-Lamberty, B., Wang, C., and Gower, S. T.: A global re-
lationship between the heterotrophic and autotrophic compo-
Author contributions. BBL and JJ designed the new version of nents of soil respiration?, Glob. Change Biol., 10, 1756–1766,
the global soil respiration database (SRDB-V5). BBL searched and https://doi.org/10.1111/j.1365-2486.2004.00816.x, 2004.
downloaded the new papers until 2017 and compiled the meta- Bond-Lamberty, B. and Thomson, A. M.: A Global Database
information. BBL, MH, RM, JM, DP, and JJ contributed to data of Soil Respiration Data, Version 4.0, ORNL DAAC, avail-
collection; NK collected data in Russian; KAT and VH raised many able at: https://daac.ornl.gov/cgi-bin/download.pl?ds_id=1578&
useful suggestions while working to integrate with ForC; RV and source=schema_org_metadata (last access: 31 January 2021),
ES provided feedback and insights in all phases. JJ wrote the paper 2018.
in close collaboration with all authors. Bond-Lamberty, B., Christianson, D. S., Malhotra, A., Pennington,
S. C., Sihi, D., AghaKouchak, A., and Ataka, M.: COSORE: A
community database for continuous soil respiration and other
Competing interests. The authors declare that they have no con- soil-atmosphere greenhouse gas flux data, Glob. Change Biol.,
flict of interest. 26, 7268–7283, https://doi.org/10.1111/gcb.15353, 2020.
Carrillo, Y., Dijkstra, F. A., Pendall, E., LeCain, D., and Tucker, C.:
Plant rhizosphere influence on microbial C metabolism: the role
Acknowledgements. This research was supported by the US De- of elevated CO2 , N availability and root stoichiometry, Biogeo-
partment of Energy, Office of Science, Biological and Environ- chemistry, 117, 229–240, 2014.
mental Research, as part of the Terrestrial Ecosystem Science pro- Cueva, A., Bullock, S. H., López-Reyes, E., and Vargas, R.: Po-
gram. The Pacific Northwest National Laboratory is operated for the tential bias of daily soil CO2 efflux estimates due to sampling
https://doi.org/10.5194/essd-13-255-2021 Earth Syst. Sci. Data, 13, 255–267, 2021266 J. Jian et al.: A restructured and updated global soil respiration database (SRDB-V5)
time, Sci. Rep.-UK, 7, 11925, https://doi.org/10.1038/s41598- Jian, J. and Bond-Lamberty, B.: jinshijian/ESSD: SRDB-
017-11849-y, 2017. V5 first release (Version v1.0.0) [Data set], Zenodo,
Davidson, E. A., Belk, E., and Boone, R. D.: Soil water con- https://doi.org/10.5281/zenodo.3876443, 2020.
tent and temperature as independent or confounded factors con- Jian, J., Steele, M. K., Thomas, R. Q., Day, S. D., and Hodges, S.
trolling soil respiration in a temperate mixed hardwood forest, C.: Constraining estimates of global soil respiration by quanti-
Glob. Change Biol., 4, 217–227, https://doi.org/10.1046/j.1365- fying sources of variability, Glob. Change Biol., 24, 4143–4159,
2486.1998.00128.x, 1998. https://doi.org/10.1111/gcb.14301, 2018a.
Davidson, E. A., Savage, K., Verchot, L. V., and Navarro, R.: Jian, J., Steele, M. K., Day, S. D., and Thomas, R. Q.: Future global
Minimizing artifacts and biases in chamber-based measure- soil respiration rates will swell despite regional decreases in tem-
ments of soil respiration, Agr. Forest Meteorol., 113, 21–37, perature sensitivity caused by rising temperature, Earths Future,
https://doi.org/10.1016/S0168-1923(02)00100-4, 2002. 6, 1539–1554, https://doi.org/10.1029/2018EF000937, 2018b.
Epule, T. E.: A New Compendium of Soil Res- Jian, J., Steele, M. K., Day, S. D., and Thomas, R. Q.: Measure-
piration Data for Africa, Challenges, 6, 88–97, ment strategies to account for soil respiration temporal hetero-
https://doi.org/10.3390/challe6010088, 2015. geneity across diverse regions, Soil Biol. Biochem., 125, 167–
Friedl, M. A., McIver, D. K., Hodges, J. C. F., Zhang, X. 177, available at: https://www.sciencedirect.com/science/article/
Y., Muchoney, D., Strahler, A. H., Woodcock, C. E., Gopal, pii/S0038071718302311 (last access: 31 January 2021), 2018c.
S., Schneider, A., Cooper, A., Baccini, A., Gao, F., and Jian, J., Bahn, M., Wang, C., Bailey, V. L., and Bond-Lamberty,
Schaaf, C.: Global land cover mapping from MODIS: algo- B.: Prediction of annual soil respiration from its flux at
rithms and early results, Remote Sens. Environ., 83, 287–302, mean annual temperature, Agr. Forest Meteorol., 287, 107961,
https://doi.org/10.1016/S0034-4257(02)00078-0, 2002. https://doi.org/10.1016/j.agrformet.2020.107961, 2020.
Guevara, M. and Vargas, R.: Downscaling satellite soil moisture Konings, A. G., Bloom, A. A., Liu, J., Parazoo, N. C., Schimel,
using geomorphometry and machine learning, PLoS One, 14, D. S., and Bowman, K. W.: Global satellite-driven estimates
e0219639, https://doi.org/10.1371/journal.pone.0219639, 2019. of heterotrophic respiration, Biogeosciences, 16, 2269–2284,
Guevara, M., Arroyo, C., and Brunsell, N.: Soil Organic Carbon https://doi.org/10.5194/bg-16-2269-2019, 2019.
across Mexico and the conterminous United States (1991–2010), Luo, Y. and Zhou, X.: Soil Respiration and the Environment, El-
available at: https://agupubs.onlinelibrary.wiley.com/doi/abs/10. sevier, San Diego, California, USA, available at: https://play.
1029/2019GB006219?casa_token=LWL2D4HFN4wAAAAA: google.com/store/books/details?id=BILt0bdU6AsC (last access:
pB-LbLOifYvo83VtBTvbtUEBAPpiALnhv2mShJoEYGD0QSJ_ 31 January 2021), 2010.
7_VHPuSkF-lYrRm0SxYkMuUuxXsekMzP (last access: Martin, L. J., Blossey, B., and Ellis, E.: Mapping where ecol-
31 January 2021), 2020. ogists work: biases in the global distribution of terrestrial
Hashimoto, S., Carvalhais, N., Ito, A., Migliavacca, M., Nishina, ecological observations, Front. Ecol. Environ., 10, 195–201,
K., and Reichstein, M.: Global spatiotemporal distribution of soil https://doi.org/10.1890/110154, 2012.
respiration modeled using a global database, Biogeosciences, 12, Peel, M. C., Finlayson, B. L., and McMahon, T. A.: Updated world
4121–4132, https://doi.org/10.5194/bg-12-4121-2015, 2015. map of the Köppen–Geiger climate classification, Hydrol. Earth
Heinemeyer, A., Di Bene, C., Lloyd, A. R., Tortorella, D., Baxter, Syst. Sci., 11, 1633–1644, https://doi.org/10.5194/hess-11-1633-
R., Huntley, B., Gelsomino, A., and Ineson, P.: Soil respiration: 2007, 2007.
implications of the plant-soil continuum and respiration cham- R Core Team: R: A Language and Environment for Statistical Com-
ber collar-insertion depth on measurement and modelling of soil puting, Version 3.6.1, available at: https://www.R-project.org/
CO2 efflux rates in three ecosystems, Eur. J. Soil Sci., 62, 82–94, (last access: 31 January 2021), 2019.
https://doi.org/10.1111/j.1365-2389.2010.01331.x, 2011. Raich, J. W. and Potter, C. S.: Global patterns of carbon diox-
Hengl, T., Mendes de Jesus, J., Heuvelink, B. M., Gerard, B. M., ide emissions from soils, Global Biogeochem. Cy., 9, 23–36,
Heuvelink, B. M. G., Ruiperez Gonzalez, M., Kilibarda, M., https://doi.org/10.1029/94GB02723, 1995.
Blagotic, A., Shangguan, W., Wright, M. N., Geng, X., Bauer- Raich, J. W. and Schlesinger, W. H.: The global carbon diox-
Marschallinger, B., Guevara, M. A., Vargas, R., MacMillan, R. ide flux in soil respiration and its relationship to vegetation
A., Batjes, N. H., Leenaars, J. G. B., Ribeiro, E., Wheeler, and climate, Tellus B, 44, 81–99, https://doi.org/10.1034/j.1600-
I., Mantel, S., and Kempen, B.: SoilGrids250m: Global grid- 0889.1992.t01-1-00001.x, 1992.
ded soil information based on machine learning, PLoS One, 12, Raich, J. W., Potter, C. S., and Bhagawati, D.: Interannual vari-
e0169748, https://doi.org/10.1371/journal.pone.0169748, 2017. ability in global soil respiration, 1980–94, Glob. Change Biol.,
IGBP: The International Geosphere-Biosphere Programme: 8, 800–812, https://doi.org/10.1046/j.1365-2486.2002.00511.x,
A Study of Global Change, The Initial Core Projects, 2002.
IGBP Secretariat, available at: http://www.igbp.net/about. Schlesinger, W. H.: Carbon balance in terrestrial detritus, Annual
4.6285fa5a12be4b403968000417.html (last access: 31 Jan- Reviews in Ecology and Systematics, 8, 51–81, 1977.
uary 2021), 1990. Tang, X., Fan, S., Du, M., Zhang, W., Gao, S., Liu, S., Chen, G.,
Jasek, A., Zimnoch, M., Gorczyca, Z., Smula, E., and Rozan- Yu, Z., and Yang, W.: Spatial and temporal patterns of global soil
ski, K.: Seasonal variability of soil CO2 flux and its car- heterotrophic respiration in terrestrial ecosystems, Earth Syst.
bon isotope composition in Krakow urban area, South- Sci. Data, 12, 1037–1051, https://doi.org/10.5194/essd-12-1037-
ern Poland, Isotopes Environ. Health Stud., 50, 143–155, 2020, 2020.
https://doi.org/10.1080/10256016.2014.868455, 2014. Tarnocai, C., Canadell, J. G., Schuur, E. A. G., Kuhry, P., Mazhi-
tova, G., and Zimov, S.: Soil organic carbon pools in the north-
Earth Syst. Sci. Data, 13, 255–267, 2021 https://doi.org/10.5194/essd-13-255-2021J. Jian et al.: A restructured and updated global soil respiration database (SRDB-V5) 267 ern circumpolar permafrost region, Global Biogeochem. Cy., 23, Warner, D. L., Bond-Lamberty, B., Jian, J., Stell, E., and Vargas, R.: GB2023,https://doi.org/10.1029/2008GB003327, 2009. Spatial Predictions and Associated Uncertainty of Annual Soil Vargas, R., Alcaraz-Segura, D., Birdsey, R., Brunsell, N. A., Respiration at the Global Scale, Global Biogeochem. Cy., 7, 983, Cruz-Gaistardo, C. O., de Jong, B., Etchevers, J., Gue- https://doi.org/10.1029/2019GB006264, 2019. vara, M., Hayes, D. J., Johnson, K., Loescher, H. W., Paz, Wilkinson, M. D., Dumontier, M., Aalbersberg, I. J. J., Appleton, F., Ryu, Y., Sanchez-Mejia, Z., and Toledo-Gutierrez, K. G., Axton, M., Baak, A., Blomberg, N., Boiten, J.-W., da Silva P.: Enhancing interoperability to facilitate implementation of Santos, L. B., Bourne, P. E., Bouwman, J., Brookes, A. J., Clark, REDD: case study of Mexico, Carbon Manag., 8, 57–65, T., Crosas, M., Dillo, I., Dumon, O., Edmunds, S., Evelo, C. https://doi.org/10.1080/17583004.2017.1285177, 2017. T., Finkers, R., Gonzalez-Beltran, A., Gray, A. J. G., Groth, P., Vicca, S., Bahn, M., Estiarte, M., van Loon, E. E., Vargas, R., Al- Goble, C., Grethe, J. S., Heringa, J., ’t Hoen, P. A. C., Hooft, R., berti, G., Ambus, P., Arain, M. A., Beier, C., Bentley, L. P., Kuhn, T., Kok, R., Kok, J., Lusher, S. J., Martone, M. E., Mons, Borken, W., Buchmann, N., Collins, S. L., de Dato, G., Dukes, A., Packer, A. L., Persson, B., Rocca-Serra, P., Roos, M., van J. S., Escolar, C., Fay, P., Guidolotti, G., Hanson, P. J., Kah- Schaik, R., Sansone, S.-A., Schultes, E., Sengstag, T., Slater, T., men, A., Kröel-Dulay, G., Ladreiter-Knauss, T., Larsen, K. S., Strawn, G., Swertz, M. A., Thompson, M., van der Lei, J., van Lellei-Kovacs, E., Lebrija-Trejos, E., Maestre, F. T., Marhan, Mulligen, E., Velterop, J., Waagmeester, A., Wittenburg, P., Wol- S., Marshall, M., Meir, P., Miao, Y., Muhr, J., Niklaus, P. A., stencroft, K., Zhao, J., and Mons, B.: The FAIR Guiding Princi- Ogaya, R., Peñuelas, J., Poll, C., Rustad, L. E., Savage, K., ples for scientific data management and stewardship, Sci. Data, Schindlbacher, A., Schmidt, I. K., Smith, A. R., Sotta, E. D., 3, 160018, https://doi.org/10.1038/sdata.2016.18, 2016. Suseela, V., Tietema, A., van Gestel, N., van Straaten, O., Wan, Willmott, C. J. and Matsuura, K.: Terrestrial air temperature and S., Weber, U., and Janssens, I. A.: Corrigendum to “Can current precipitation: Monthly and annual time series (1950–1999) Ver- moisture responses predict soil CO2 efflux under altered pre- sion 1.02, Center for Climatic Research, University of Delaware, cipitation regimes? A synthesis of manipulation experiments”, Newark, 2001. Biogeosciences, 11, 3307–3308, https://doi.org/10.5194/bg-11- 3307-2014, 2014. Virkkala, A.-M., Abdi, A. M., Luoto, M., and Metcalfe, D. B.: Identifying multidisciplinary research gaps across Arc- tic terrestrial gradients, Environ. Res. Lett., 14, 124061, https://doi.org/10.1088/1748-9326/ab4291, 2019. https://doi.org/10.5194/essd-13-255-2021 Earth Syst. Sci. Data, 13, 255–267, 2021
You can also read