A Review of Water Quality Issues Influencing the Habitat Quality in Dugong Protection Areas - RESEARCH PUBLICATION NO. 66
←
→
Page content transcription
If your browser does not render page correctly, please read the page content below
R E S E A R C H P U B L I C AT I O N N O . 6 6

A Review of Water Quality Issues
Influencing the Habitat Quality in
Dugong Protection Areas

                                                            Water Quality Unit
                                       Great Barrier Reef Marine Park Authority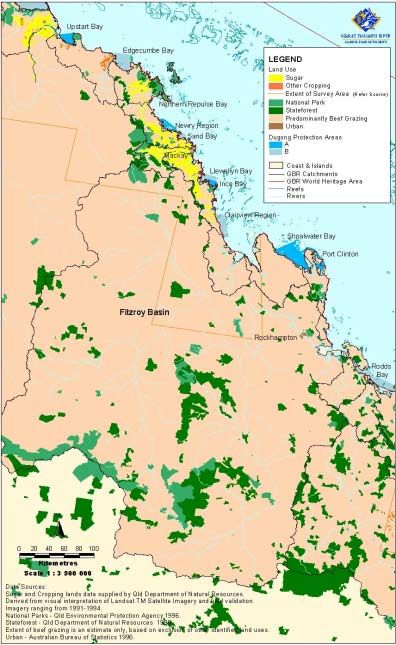
R E S E A R C H P U B L I C AT I O N N O . 6 6

A Review of Water Quality Issues
Influencing the Habitat Quality in
Dugong Protection Areas

Britta Schaffelke, Jane Waterhouse and Caroline Christie
The Great Barrier Reef Marine Park Authority

PO Box 1379
Townsville Qld 4810
Telephone: (07) 4750 0700
Fax:       (07) 4772 6093
Email:     info@gbrmpa.gov.au
www.gbrmpa.gov.au
© Great Barrier Reef Marine Park Authority 2001

ISSN 1037-1508
ISBN 0 642 23093 5

Published January 2002 by the Great Barrier Reef Marine Park Authority.

This work is copyright. Apart from any use as permitted under the Copyright Act 1968, no part may be
reproduced by any process without prior written permission from the Great Barrier Reef Marine Park
Authority. Requests and inquiries concerning reproduction and rights should be addressed to the Director,
Information Support Group, Great Barrier Reef Marine Park Authority, PO Box 1379, Townsville Qld
4810.

The opinions expressed in this document are not necessarily those of the Great Barrier Reef Marine Park
Authority. Accuracy in calculations, figures, tables, names, quotations, references etc. is the complete
responsibility of the authors.

This publication will also be available on the Great Barrier Reef Marine Park Authority’s website,
http://www.gbrmpa.gov.au

National Library of Australia Cataloguing-in-Publication data:

Schaffelke, Britta.
A review of water quality issues influencing the habitat quality in dugong protection
areas.

Bibliography.
ISBN 0 642 23093 5.

1. Dugong – Effect of water pollution on – Queensland. 2.
 Water Quality – Queensland. 3. Dugong – Habitat –
Queensland. 4.Dugong – Conservation – Queensland. I.
Waterhouse, Jane, 1973- . II. Christie, Caroline, 1965 - .
III. Great Barrier Reef Marine Park Authority (Australia).
IV. Title. (Series: Research publication (Great Barrier
 Reef Marine Park Authority (Australia)); no. 66).

599.55909943

  PO Box 1379
  Townsville Qld 4810
  Telephone (07) 4750 0700

                                                    iii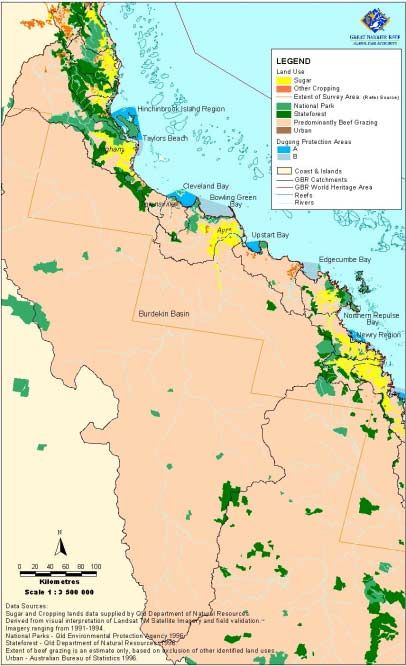
FOREWORD

The seagrass meadows in the Great Barrier Reef Region are important feeding grounds
for a critical proportion of the world population of the dugong species Dugong dugon.
The dugong has high biodiversity value and is considered by the World Conservation
Union to be vulnerable to extinction. A rapid decline of the dugong population in the
southern Great Barrier Reef over the last 10 years has raised concerns about the
survival of the species in that region. Reasons for the reported decline in dugong
numbers are not fully understood, however, because dugongs have very low rates of
population growth any impacts such as degradation and loss of seagrass habitat and
deterioration of water quality have the potential to threaten the integrity of dugong
populations.

Zoning of the Great Barrier Reef Marine Park has provided a certain level of protection
of dugongs, especially in the Cairns and Far Northern Section of the Park. In addition,
in 1997–98, a system of 16 Dugong Protection Areas was established by the
Commonwealth and Queensland Governments as a key strategy to help recover the
declining dugong population in the southern Great Barrier Reef. These areas centre on
significant habitat and feeding grounds of the dugong population and were declared to
minimise the risk to dugongs from anthropogenic effects such as drowning in fishing
nets and collision with boats. However, land based pollutants from the Great Barrier
Reef catchment are also recognised as a threat to dugong populations through
degraded water quality. These pollutants may either directly affect them or indirectly
contaminate them through seagrasses on which the dugong feed. Loss of feed by
smothering and killing seagrasses with sediment is also a concern due to detrimental
land use practices.

The Great Barrier Reef Marine Park Authority is concerned about all potential effects
on dugongs in the Dugong Protection Areas, and has therefore documented
information relating to water quality in the Areas. The information and associated risk
analysis was reported on 30 July 1999 to the Great Barrier Reef Ministerial Council,
comprising the Commonwealth and Queensland Government Ministers for the
Environment and for Tourism. At the meeting, Queensland Ministers undertook,
among other things, to pursue legislative protection of riparian zones and wetlands; to
implement Integrated Catchment Management strategies; and to progress agricultural
industry Codes of Practice from voluntary to mandatory. The Council also undertook
to support studies into habitat quality issues related to seagrass and land runoff; and
requested publication of this report subject to favourable peer review.

In accordance with the Council’s request, the Great Barrier Reef Marine Park Authority
is pleased to make this report available for general consideration.

Hon Virginia Chadwick
Chair
Great Barrier Reef Marine Park Authority

January 2002

                                           iv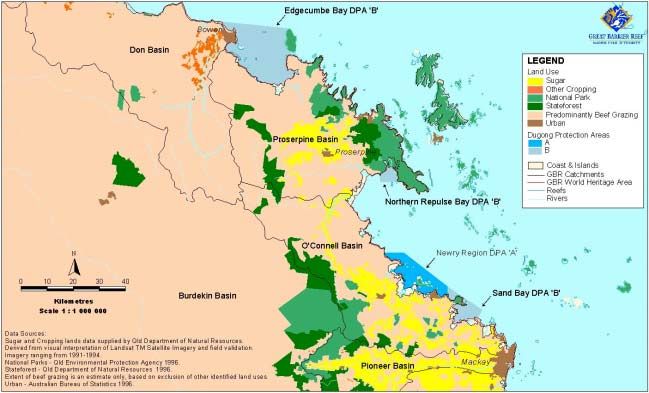
CONTENTS
FOREWORD.............................................................................................................................. iv
CONTENTS................................................................................................................................ v
SUMMARY ................................................................................................................................. 1
ACKNOWLEDGMENTS ............................................................................................................ 2
1. INTRODUCTION.................................................................................................................... 3
1.1 Geographical and Biological Setting............................................................................... 5
1.2 Dugong Habitats............................................................................................................. 5
2. CATCHMENT ACTIVITIES POTENTIALLY AFFECTING DUGONG
PROTECTION AREAS ..................................................................................................... 7
2.1 Changes in Land Use....................................................................................................... 7
2.2 Terrestrial Runoff ............................................................................................................ 8
2.2.1 Point Sources ........................................................................................................... 9
2.2.2 River Discharge...................................................................................................... 10
2.2.3 Cyclonic Flood Plumes .......................................................................................... 12
2.2.4 Other Sources - Water Dynamics and Sediment Resuspension............................ 12
2.3 Constituents of Terrestrial Runoff ................................................................................ 13
2.3.1 Nutrients and Sediment......................................................................................... 15
2.3.2 Heavy Metals ......................................................................................................... 16
2.3.3 Other Contaminants .............................................................................................. 16
2.3.4 Freshwater ............................................................................................................. 17
2.3.5 Acid Sulfate Soils ................................................................................................... 17
2.3.6 Litter....................................................................................................................... 17
3. POTENTIAL IMPACTS OF DEGRADED WATER QUALITY ON DUGONG .................. 18
3.1 Potential Direct Impacts of Water Quality on Dugong Health..................................... 18
3.2 Potential Impacts of Terrestrial Runoff on Dugong Habitats....................................... 18
3.2.1 Increased Nutrients ............................................................................................... 19
3.2.2 Increased Sedimentation ....................................................................................... 20
3.2.3 Contaminants......................................................................................................... 20
3.2.4 Other Considerations............................................................................................. 21
3.3 Other Pressures to Water Quality and Dugong Habitat Quality ................................. 21
3.3.1 Shipping................................................................................................................. 22
3.3.2 Oil Spills................................................................................................................. 22
3.3.3 Trawling................................................................................................................. 22
4. CONDITION OF CATCHMENTS ADJACENT TO DUGONG PROTECTION
AREAS ............................................................................................................................ 23
4.1 Hinchinbrook and Taylors Beach DPAs....................................................................... 23
4.2 Cleveland Bay, Cape Bowling Green Bay and Upstart Bay DPAs ............................... 26
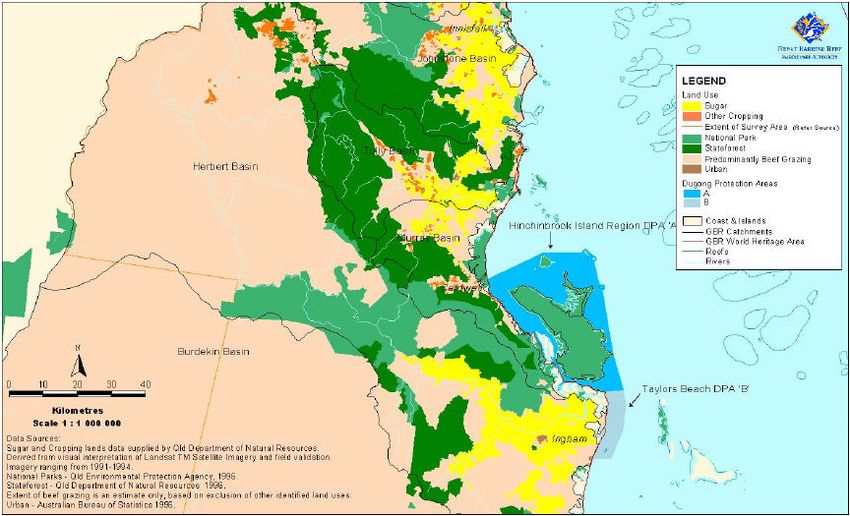
4.3 Edgecumbe Bay, Repulse Bay, Newry Region and Sand Bay DPAs............................ 30
4.4 Llewellyn Bay, Ince Bay, Clairview Region, Shoalwater Bay, Port Clinton
DPAs........................................................................................................................... 33
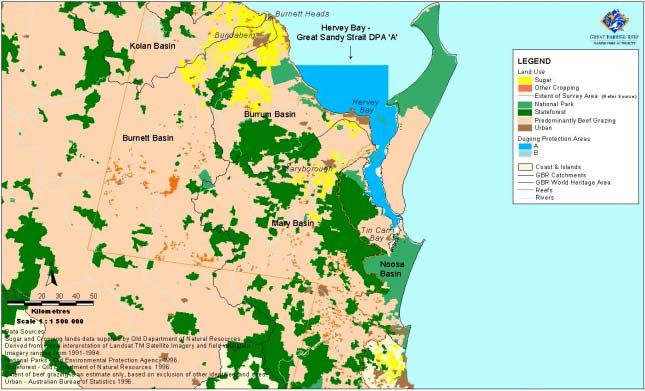
4.5 Rodds Bay and Hervey Bay–Great Sandy Strait DPAs ................................................ 34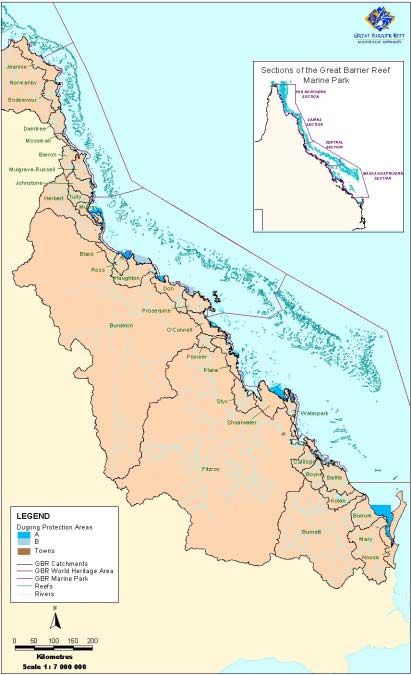
5. QUALITATIVE RISK ASSESSMENT FOR HABITAT QUALITY IN DUGONG
     PROTECTION AREAS ................................................................................................... 40

6. ASSESSMENT AND MONITORING OF POLLUTANTS IN DUGONG
      PROTECTION AREAS ................................................................................................... 44
   6.1 Monitoring of Pollutant Levels in Marine Mammals ................................................... 44
   6.2 Monitoring of Pollutant Levels in Dugong Habitats .................................................... 44
   6.3 Long-term Water Quality Monitoring.......................................................................... 44
      6.3.1 Chlorophyll Monitoring......................................................................................... 44
      6.3.2 Flood Plume Monitoring........................................................................................ 44

7. JURISDICTIONAL LIMITATIONS ...................................................................................... 45

8. DISCUSSION ....................................................................................................................... 46

9. CONCLUSION..................................................................................................................... 47

REFERENCES ......................................................................................................................... 48

APPENDICES........................................................................................................................... 64
  Appendix 1 (Tables A1 to A3). ............................................................................................ 65
  Appendix 2 (Figures A1 to A6)............................................................................................ 68

FIGURES
1.  Location of Dugong Protection Areas and the adjacent river catchment areas of
    the Great Barrier Reef World Heritage Area .................................................................... 4
2.  Increase in land area used for sugar cultivation from 1930 to 1996 ................................. 8
3.  Sources of new nitrogen and phosphorus to Great Barrier Reef shelf waters ................. 9
4.  Extent of cyclonic flood plumes in the inner lagoon of the GBRWHA .......................... 11
5.  Contribution of different land uses to nitrogen and phosphorus runoff ....................... 15
6.  Land use in catchments adjacent to the Hinchinbrook Island Region and
    Taylors Beach Dugong Protection Areas........................................................................ 24
7.  Change of land use in the Herbert River catchment over the past 140 years................. 25
8.  Land use in catchments adjacent to the Cleveland Bay, Bowling Green Bay and
    Upstart Bay Dugong Protection Areas........................................................................... 27
9.  Land use in the Burdekin River Catchment Area........................................................... 28
10. Land use in catchments adjacent to the Edgecumbe Bay, Repulse Bay, Newry
    Region and Sand Bay Dugong Protection Area.............................................................. 32
11. Land use in catchments adjacent to the Llewellyn Bay, Ince Bay,
    Clairview Region, Shoalwater Bay and Port Clinton Dugong Protection Areas........... 35
12. Land use in the Fitzroy River catchment Area ............................................................... 36
13. Land use in catchments adjacent to the Rodds Bay Dugong Protection Area ............... 38
14. Land use in catchments adjacent to the Hervey Bay–Great Sandy Strait Dugong
    Protection Area ............................................................................................................... 39

TABLES
1.  Nutrient concentrations in the Herbert River and the Hinchinbrook Channel ............. 25
2.  Nutrient concentrations in the Burdekin River .............................................................. 29
3.  Nutrient concentrations in the Fitzroy River.................................................................. 34
4.  Qualitative risk assessment of impacts by catchment activities on water and
    habitat quality in Dugong Protection Areas................................................................... 43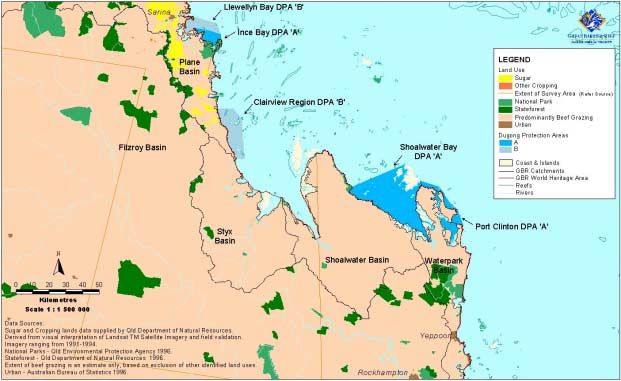
SUMMARY

The Queensland dugong population has declined significantly in the Great Barrier Reef
(GBR) south of Cooktown during the past decade. In response to this decline 16
Dugong Protection Areas (DPAs) were established in 1997 in the Great Barrier Reef
World Heritage Area (GBRWHA) and the Hervey Bay–Great Sandy Strait Region. The
establishment of the DPAs has been a key strategy to protect dugongs from direct
anthropogenic effects such as drowning in fishing nets and collision with boats.

Dugongs are also threatened by indirect anthropogenic impacts to their habitats from
deterioration in water quality that cause either direct adverse effects on dugong health
or indirect effects on the distribution and performance of seagrasses, the main food
source of dugong. Seagrass growth and productivity is adversely affected by high
water turbidity, smothering by sediment or mud, high nutrient availability and the
presence of herbicide residues.

The most important water quality issues in the GBRWHA are high loads of river-borne
nutrients, pesticides and sediments that reach the GBR lagoon. The nutrient and
sediment loads of rivers draining the Queensland catchments have increased since
European settlement as a result of intensified land use. The predominant land uses in
the 17 major catchments adjacent to the GBRWHA are grazing, cropping, urban
development and mining. Intensive cropping requires the application of fertilisers and
pesticides, whereas land clearing, removal of wetlands and riparian zones, and over-
grazing have caused increased erosion of terrestrial sediments. Consequently,
increased loads of sediments, nutrients and pesticides are now exported to the coastal
zone of the GBRWHA.

A qualitative risk assessment was completed as a tool to screen the potential of
adverse effects on habitat quality to occur in DPAs as a result of activities on
adjacent catchments. The level of risk reflects the development and land use on the
adjacent catchments and the associated pollution pressures to the marine
environment, as well as basic site-specific attributes of the DPAs. The output of the
risk assessment is a summary rating of low, moderate or high risk for each of the 16
DPAs, as follows:
High risk - Hinchinbrook, Repulse Bay, Newry Region, Sand Bay, Llewellyn Bay, Ince
Bay, Rodds Bay;
Moderate risk – Taylors Beach, Cleveland Bay, Bowling Green Bay, Upstart Bay,
Edgecumbe Bay, Clairview Region, and Hervey Bay–Great Sandy Strait; and
Low risk –Shoalwater Bay and Port Clinton.

A significant reduction in nutrient, sediment and contaminant inputs to the GBR inner
lagoon is essential to ensure that the DPAs provide favourable habitats. Current land-
based pollution control measures have not been adequate to prevent an ongoing
decline in water quality. Further steps are required to ensure the protection of
downstream habitats. These may include measures such as:
    • Queensland to pursue legislative protection of riparian zones and wetlands;
    • Queensland to implement ICM strategies as a matter of priority; and
    • Queensland to progress Industry Codes of Practice.

With the cooperation of government agencies, peak industry organisations and the
community, the protection of water quality and seagrass habitat will form a key part
of the strategy for the recovery of the severely depleted dugong population in the
GBRWHA.

                                           1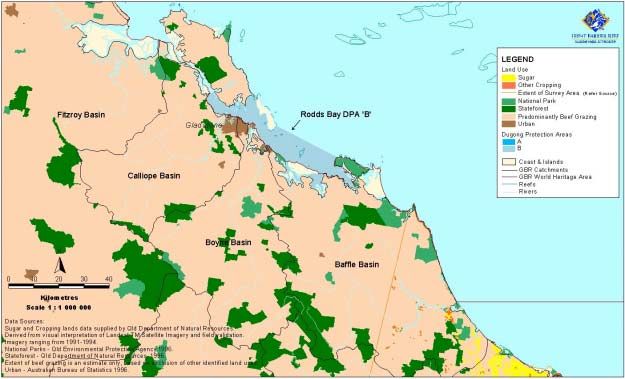
ACKNOWLEDGMENTS

We thank Tony Stokes, Jon Brodie, David Haynes, and Hugh Yorkston from the
GBRMPA for their contributions to the content and editing of the report. We are
grateful to Ian Prosser (CSIRO Land & Water) for making available data from the
National Land and Water Resources Audit. Thanks are also due to the reviewers of
the draft document, Rob Coles (Queensland Department of Primary Industries),
George Rayment (Queensland Department of Natural Resources) and Miles Furnas
(Australian Institute of Marine Science) for their valuable input.

                                        2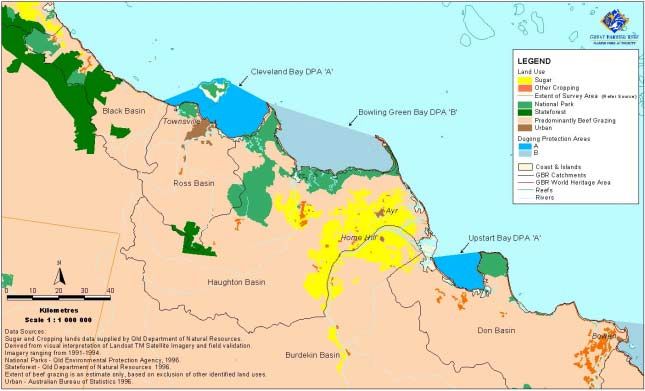
1.   INTRODUCTION

In August 1997, the Commonwealth and Queensland Governments established 16
coastal Dugong Protection Areas (DPAs) to reduce the threat of mesh nets to dugongs
(Dugong dugon). The DPAs are situated in the Central and Mackay/Capricorn
Sections of the Great Barrier Reef Marine Park (GBRMP) and the Hervey Bay–Great
Sandy Strait region (Figure 1), and were enacted by Regulation No. 11 (1997) under
the Queensland Fisheries Act 1994 and the Nature Conservation (Dugong) Conservation
Plan 1999 under the Nature Conservation Act 1992. The establishment of DPAs was
considered the key strategy to address the rapid decline of the Great Barrier Reef
(GBR) dugong population south of Cooktown.

There are two types of DPAs. The Dugong Protection Area ‘A’ (DPA ‘A’) zones
prohibit or restrict the use of fishing nets considered to pose a threat to dugong, while
Dugong Protection Area ‘B’ (DPA ‘B’) zones are less restrictive in the use of nets. The
DPAs are:

         Dugong Protection Area ‘A’             Dugong Protection Area ‘B’
         Hinchinbrook                           Taylors Beach
         Cleveland Bay                          Cape Bowling Green Bay
         Upstart Bay                            Edgecumbe Bay
         Newry Region                           Repulse Bay
         Ince Bay                               Sand Bay
         Shoalwater Bay                         Llewellyn Bay
         Port Clinton                           Clairview Region
         Hervey Bay–Great Sandy Strait          Rodds Bay

The seagrass meadows in the GBR region are important feeding grounds for a critical
proportion of the world population of the dugong species Dugong dugon (Great
Barrier Reef Marine Park Authority 1981). The dugong is considered by the IUCN to
be vulnerable to extinction (IUCN 1990). Aerial surveys of the dugong population in
the inshore waters of the GBRMP were conducted in 1986 and 1987 and then repeated
in 1992 and 1994 (Marsh et al. 1995). The surveys indicated a dramatic decline over
the eight year period with approximately a 50% reduction of dugong numbers (Marsh
et al. 1995). Reasons for the reported decline in dugong numbers are unclear, however,
because dugongs have very low rates of population growth (Marsh 1992) any impacts
such as loss of seagrass habitat and deterioration of water quality have the potential
to threaten the integrity of dugong populations (Marsh 1992; Marsh et al. 1995).

Dugong are threatened by both direct anthropogenic impacts such as entanglement in
fishing nets, boat strikes, displacement by boating activities in feeding areas,
indigenous hunting, and indirect anthropogenic impacts such as deterioration of water
quality and degradation of seagrass meadows. The indirect anthropogenic impacts are
difficult to determine and define, and consequently it is problematic to mitigate their
impact on dugong populations. Such impacts are predominantly caused by changes in
water quality that cause either either direct adverse effects on dugong health or
indirect effects on the distribution and performance of seagrasses, the main food
source of dugong.

Changes in water quality as a result of agriculture, urban expansion and industrial
activities include increased exports to coastal waters of sediments, nutrients, and
other

                                            3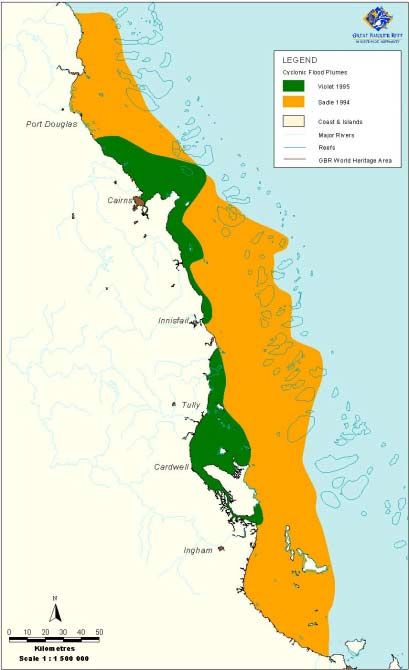
Figure 1. Location of Dugong Protection Areas and the adjacent river catchment areas
     of the Great Barrier Reef World Heritage Area

                                         4
contaminants such as heavy metals, organochlorine compounds, and polycyclic
aromatic hydrocarbons (PAHs) (Fowler 1990; Tatsukawa et al. 1990; Brodie 1995;
Connell 1993). These pollutant groups present a potential risk to dugongs and
seagrass meadows.
The purpose of the present review is to synthesise available information to address
the following questions:
What and how severe are the effects of water quality on habitat quality in the existing
DPAs?
How do water contaminants affect dugongs and their food source, seagrasses and
other dugong habitat features?
Using this information the risks to dugong health and habitat quality in DPAs
associated with poor water quality are assessed, and options to better manage these
risks are suggested.
1.1 Geographical and Biological Setting
The GBRWHA covers an area of about 350 000 km2 on the north-eastern Australian
continental shelf. It encompasses the long, narrow band of the GBR, stretching 2000
km along the coast from 10.5°S at Cape York to 24.5°S near Bundaberg. The GBR is
the largest assemblage of coral reef ecosystems found anywhere in the world and
comprises nearly 3000 individual reefs. Approximately 350 species of hard coral,
1500 species of fish, 240 species of seabirds, more than 4000 species of molluscs and
numerous other biota are found in the GBR region (GBRMPA 1981). In general, there is
a strong cross-shelf component in the abundance and diversity of both reef and inter-
reefal taxa in the GBR. These cross-shelf patterns vary with latitude due to variability
in key physical factors (Kerrigan et al. in press). The principal habitats of the system
have only existed in their present form since the sea level rose 9000 years ago, flooding
the shelf. Mangroves are widespread along the coastline with a total area of about
2000 km2 (Galloway 1982), interspersed with areas of low energy, sandy beachline
and limited rocky shorelines. In the shallow areas along the coast, seagrass meadows
are present and have been documented to cover an area of approximately 3000 km2
(Lee Long et al. 1993). Deep water (> 10 m) seagrasses have been discovered further
offshore in the northern GBR with an area of about 2000 km2 (Lee Long et al. 1996a).
The soft-bottom of the GBR lagoon floor is colonised by communities of algae,
sponges, bryozoans and echinoderms (Birtles & Arnold 1988).
1.2 Dugong Habitats
Dugongs inhabit coastal areas of the GBRWHA. They can travel distances of several
hundred kilometres (Marsh & Corkeron 1997) and have been observed on the outer
shelf of the Far Northern Section of the GBRMP (Marsh & Saalfeld 1989). The Far
Northern Section of the GBRMP is the most important dugong habitat in the
GBRWHA with a relatively large and stable dugong population (approximately 10
000 animals; Marsh & Corkeron 1997). The dugong population from Cooktown to the
southern boundary of the GBRWHA is smaller and from 1986 to 1994 has been
critically reduced by approximately 50% to about 1700 animals (Marsh & Corkeron
1997).
Generally the coastal dugong habitats correspond with the distribution of shallow
water seagrasses in the GBR. However, dugongs have also been observed feeding on
deep water seagrass meadows at depths of more than 20 metres (Lee Long et al. 1989,
1996a). Most seagrasses found in the GBR region grow in the inshore lagoon in
shallow waters (< 10 m), less than 10 kilometres from the coast (Lee Long et al. 1993).
In deeper waters (10 to 60 m depth), considerable areas of seagrass meadows have
recently been discovered in the inter-reefal areas of the GBRWHA (Lee Long et al.
1996a). Baseline seagrass surveys carried out by the Queensland Department of
5Primary Industries in the 1980s provide important information on the large scale
distribution of seagrass meadows in most areas of the GBRWHA inner lagoon (Lee
Long et al. 1993). This information, however, is now dated. Recent re-surveys at a few
locations indicate that at a small spatial scale (hundreds of metres) distribution of
seagrass meadows can change markedly over time (Lee Long et al. 1996b, 1998). There
is also very limited information on seasonal changes in seagrass abundance (Mellors et
al. 1993; Lanyon & Marsh 1995). The current survey information regarding the extent
of seagrass meadows in the GBR is incomplete so is not presented in this report.
The main food source for dugongs are ephemeral seagrasses of the genera Halophila
and Halodule (Preen 1993a), however, all seagrass species described for the GBRWHA
have been found in stomach contents of dugongs (Lanyon et al. 1989). The 15 seagrass
species described to date for the GBRWHA are: Cymodocea rotundata, C. serrulata,
Enhalus acoroides, Halophila decipiens, H. ovalis, H. ovata, H. spinulosa, H. tricostata,
Halodule pinifolia, H. uninervis (possibly two species), Syringodium isoetifolium,
Thalassia hemprichii, Zostera capricorni.(Lee Long et al. 1993) and Halophila capricorni
(Larkum 1995). Enhalus acoroides only occurs in the Far Northern Section of the
GBRMP (Lee Long et al. 1993). Cymodocea serrulata, H. spinulosa, Z. capricorni, and the
wide-leafed form of
H. uninervis contribute most of the seagrass biomass between Cape York and Hervey
Bay (Lee Long et al. 1993).
In addition to being the essential food sources for dugong and green sea turtles
(Chelonia mydas), seagrass communities are of major importance to coastal
ecosystems. Seagrasses stabilise bottom sediments; are important benthic primary
producers; are part of the nutrient cycle in the aquatic system; supply habitat for
adult fish, juvenile fish and invertebrates; contribute substratum for encrusting animals
and plants. In the GBR region seagrass meadows are also important as habitat for
juvenile prawns (Coles et al. 1987), and the seeds of Z. capricorni are a seasonal food
source for juveniles of the species Penaeus esculentus (Dall et al. 1992).
62. CATCHMENT ACTIVITIES POTENTIALLY AFFECTING DUGONG
PROTECTION AREAS
Land use changes in the GBR Catchment are significant to the water quality status in
the GBR. The land use activities in the GBR Catchment determine the quality of the
terrestrial runoff that influences the water quality in the DPAs.
2.1 Changes in Land Use
Land within the 17 major river catchments adjacent to the GBR has been extensively
modified since European settlement. Land clearing, removal of wetlands and riparian
vegetation zones, grazing and cultivation have all occurred to enable the development
of agriculture, mining and urban centres within each of the catchments to a greater or
lesser extent. Only very small areas of the catchments adjoining the DPAs are
considered to be pristine lands. In the Herbert and Haughton River catchments
(Central Section of the GBRMP) approximately 10% of the catchment area is pristine
lands whereas in the Kolan River catchment (Mackay/ Capricorn Section of the
GBRMP) there is no pristine land (Rayment & Neil 1997).
Land clearing during the past 130 years has resulted in loss of rainforest in coastal
lowlands (Johnson et al. 1998) and on the ranges and tablelands (Gardiner et al.
1988), loss of coastal wetland forest (Johnson et al. 1998), and extensive loss of open
woodland. Forest and woodland clearance in Queensland has been quantified from
satellite imagery (Graetz et al. 1995). In the Herbert River catchment Melaleuca
wetlands have been reduced in area from
30 000 hectares in pre-European times to less than 5000 hectares in 1996, while in the
lower Johnstone River catchment a 78% loss occurred between 1951 and 1992. In the
Fitzroy River catchment, during the Brigalow (Acacia harpophylla) woodland clearance
schemes (1950 to 1975) approximately 4 million hectares of Brigalow woodland were
cleared for conversion to grasslands for cattle grazing. The National Greenhouse Gas
Inventory Committee Report (1999) estimated that in the period between 1988 and
1998 approximately 3 million hectares of land would have been cleared in
Queensland. Most of this clearing is now occurring on marginal agricultural land,
particularly in central Queensland, where soil fertility is considered to be inadequate
for agricultural purposes. In recent reports summarising the status and quality of
freshwater streams in Queensland catchments, the loss and disturbance of riparian
vegetation zones in agricultural areas is emphasised, primarily because it causes
increased erosion and enhanced turbidity in stream waters (Moller 1996; Johnson
1997; Russell & Hales 1994, 1997; Russell et al. 1996a, b).
Use statistics and usage trends for the GBR Catchment have been quantified by
Gilbert et al. (in press). Of the catchments flowing into the GBR the primary land use
is cattle grazing for beef production, which occupies 77% of the total catchment area.
In 1996 there were approximately 4.9 million beef cattle grazing in the GBR Catchment
with the highest stock numbers recorded in the Fitzroy River catchment (Gilbert et al.
in press). Other land uses, namely cropping (mainly of sugarcane) and
urban/residential development, each occupy approximately 3% of the total catchment
area.
The largest crop grown on the GBR Catchment is sugarcane which is primarily grown
in lowland coastal areas. The catchment area used for sugarcane cropping has
increased steadily over the last 100 years with 390 000 hectares being cultivated for
sugarcane by 1997 (Figure 2). Sugarcane cropping requires the application of fertiliser
which has resulted in a rapid increase in total fertiliser application since 1950
(Pulsford 1996).
The estimated human population in the GBR Catchment is steadily increasing, by 1995
it was 1.2 million. This population growth has been associated with an increasing
7demand on land for urban development. Other significant land uses, in specific
catchments, include mining (coal and metalliferous) and cotton cropping, however,
these land uses occupy only a small area of land relative to the total GBR Catchment.
Industries such as aquaculture, cotton (mostly on the Fitzroy catchment) and
horticulture (particularly bananas) are presently expanding and consequently fertiliser
application associated with these uses is increasing in the GBR Catchment. For
example, in the Tully River catchment the area under sugarcane has doubled and
fertiliser nitrogen use has increased by 130% (Mitchell et al. 2001).
400
300
Area (ha X 1000)
200
100
0
1930
1934
1938
1942
1946
1950
1954
1958
1962
1966
1970
1974
1978
1982
1986
1990
1994
Figure 2. Increase in land area used for sugar cultivation from 1930 to 1996 (Gilbert et
al. in press)
2.2 Terrestrial Runoff
Terrestrial runoff is considered one of the most significant anthropogenic impacts on
the water quality of the GBRWHA because it carries sediments, nutrients, heavy
metals and other contaminants, acid sulfate soil leachate and litter. There has been an
ongoing and often controversial discussion on the biological and physical impacts of
terrestrial runoff on the health of the GBR (e.g. Bell 1991; Bell & Gabric 1991; Kinsey
1991; Walker 1991; Baldwin 1992; Brodie 1995; Larcombe & Woolfe 1999). However,
there is now agreement that “there is significant risk that terrestrial runoff is currently
or may in future damage areas of high exposure along the tropical and central
Queensland coasts of the GBRWHA” and that “there is a continued urgency to work
towards a reduction in the runoff of sediments, nutrients, herbicides and other
pollutants into the Great Barrier Reef Marine Park World Heritage Area.” (statement
by the CRC Reef Research Centre, December 2001).
The main sources of terrestrial runoff to the GBR are via point sources and river
discharge.
82.2.1 Point Sources
Point source discharges include sewage outfalls, discharge from aquaculture
operations and industrial effluent.
Sewage discharges contribute only a few per cent of the ‘new’ nutrients to the coastal
waters of the GBR (Figure 3) however they can be significant on a local scale (Brodie
1995). A majority of the large coastal cities and most of the smaller coastal
settlements adjacent to the GBRWHA, have secondary treatment sewage systems.
Many of these treatment plants use a proportion of the effluent for land irrigation and
several have sewage outfalls, as point-source discharges, either into coastal streams or
directly into the GBRWHA. The operation of treatment plants (greater than 21
equivalent persons capacity) is regulated by the Queensland Environmental Protection
Act 1994. Problems may arise from these point-source discharges, particularly in dry
season conditions, where discharge into a stream may constitute the total stream flow.
Under these conditions eutrophication, algal blooms and anoxia in the vicinity of the
point-source discharge may result. In some areas with significant urban populations
septic systems are still in operation, for example, most of the Magnetic Island and
Mission Beach residential areas. Plans to upgrade the sewage systems in these
communities are being investigated.
Sewage Sewage Rainfall
2% 8% 11%
N fixation:
Rivers Trichodesmium 25%
40% Upwelling
Reefal 8% 29%
Rivers
Rainfall 52%
Upwelling
15%
10%
a. Nitrogen b. Phosphorus
Figure 3. Sources of new nitrogen and phosphorus to the Great Barrier Reef shelf
waters (Source: Furnas et al. 1995).
Aquaculture of saltwater prawns is a small but expanding industry along the coast
adjacent to the GBRWHA. Wastewater from prawn ponds is periodically released
into coastal streams or potentially, directly into the GBRWHA, and may be a
considerable local source of nutrients (Macintosh & Phillips 1992). Such point-source
discharges are high in nutrients, suspended solids, algae and bacteria and thus have
potential impacts on the GBRWHA. Again such point-source discharges are regulated
under the Queensland Environmental Protection Act 1994 through a licensing system
however compliance is self-regulated by individual prawn farms once a license is
obtained. More recently, regulations have been introduced under Section 66(2)(e) of
the Great Barrier Reef Marine Park Act 1975 that regulate discharge of aquaculture waste
from the coastal boundary of the GBRMP to 5 km inland from the highest
astronomical tide. The Great Barrier Reef Marine Park (Aquaculture) Regulations 2000
came into effect in February 2000 to manage aquaculture waste discharge immediately
adjacent to the coast and the estuaries of the GBRWHA. These Regulations allow for
accreditation of the Queensland assessment and approval processes when these
processes adequately address the Commonwealth assessment and approval
requirements, which aim to minimise impacts on marine ecosystems. At present,
Queensland is encouraging new prawn farms to minimise the volume of discharge and
to install biofiltration systems to reduce the concentration of contaminants in their
9wastewater by filtering the discharge water through beds of bivalves (e.g. oysters and
mussels) or algae, or through mangroves. Currently, publications from a number of
research projects addressing the environmental impacts of prawn farm effluents are in
preparation (M. Burford, CSIRO Marine Research, pers. comm.).
The major industrial sites on the coast adjacent to the GBR are concentrated near
Gladstone and Townsville. Only a few of these sites discharge wastewater into
coastal streams or directly into the GBRWHA. These discharges are regulated under
the Queensland Environmental Protection Act 1994. Recently developed industrial sites
are encouraged to have no ocean wastewater discharge, for example, the Korea Zinc
smelter in Townsville.
2.2.2 River Discharge
River discharges make a substantial contribution to the inputs of ‘new’ nutrients (N
and P) to the shelf ecosystems of the GBR (Figure 3). The actual river flows in all
catchments adjacent to the GBR are highly variable, both between and within years.
Discharge in both wet and dry river systems is dominated by large flood events
associated with tropical cyclones and monsoonal rainfall (Mitchell & Furnas 1997;
Mitchell et al. 1996). While the large ‘dry’ catchments of the Burdekin and Fitzroy
Rivers have the greatest average flows, significant flood events only occur episodically
at intervals ranging between several years and a decade. Limited information suggests
that area-specific erosion is higher in the ‘wet’ catchments of the central GBR (16 to
19°S), but overall sediment and nutrient inputs are dominated by the large dry
catchments as a consequence of their larger average water flows.
The coastal region adjoining the DPAs is divided into a number of wet and dry
tropical catchments. Most catchments are small (< 10 000 km2), but the Burdekin (133
000 km2) and Fitzroy River catchments (143 000 km2) are among the largest in
Australia. Estimates of the long-term average volume of water discharged annually
into the whole of the GBRWHA by rivers range from 40 km3 (Furnas & Mitchell 1997)
to 84 km3 (Wasson 1997).
Approximately 37 % of this discharge originates from the Burdekin and Fitzroy Rivers
and 30% originates from the relatively small rivers in the Wet Tropics region (16°S to
19°S).
How far terrestrial runoff is transported in river discharge depends on the velocity of
the waterway, the size of the transported material and whether or not the material is
dissolved or in suspension. While sand and silt sized sediment fractions may be re-
deposited within the catchments during low flow events, most of the fine clay fraction
is transported downstream to the river mouth (Arakel et al. 1989). During major flood
events associated with tropical cyclones, the sediment re-deposited in the streams
may be resuspended and transported downstream. These major events are responsible
for almost all the transport of material from catchments to the inner lagoon (Cosser
1989; Furnas & Mitchell 1991; Hunter 1997; Bramley & Johnson 1996; Mitchell et al.
1997). Intense rainfall associated with tropical cyclones causes massive river flows
and flood plumes, which intrude into the GBR lagoon (Figure 4).
10Figure 4. Extent of cyclonic plumes in the coastal zone of the Great Barrier Reef World
Heritage Area
112.2.3 Cyclonic Flood Plumes
The buoyancy of low salinity water and geostrophic forces are major factors
controlling the movement of flood waters on the GBR shelf (Wolanski & Jones 1981;
Wolanski 1994; Wolanski & King 1997), but wind-forcing of surface water may be an
important factor during moderate and strong winds (Brodie & Furnas 1996). As a
result the direct effects on GBR ecosystems are primarily concentrated close to the
coast. For example, the flood plume following cyclone Violet was restricted to a
shallow, nearshore band by strong south-east tradewinds whereas in the relatively
calm conditions following cyclone Sadie, the flood plume extended seaward over
much of the continental shelf (Figure 4).
The annual discharge from the Burdekin and Fitzroy Rivers varies considerably from
year to year. Major flood events are separated by drier periods, often of many years,
with little river flow. During major floods, high discharge rates persist for several
weeks. Flood plumes extend for several hundreds of kilometres away from the river
mouth (Wolanski & Van Senden 1983; O’Neill et al. 1992) and low salinity water
masses can be identified for several weeks along the coast.
In the major flood events of 1979–80 and 1980–81 in the Burdekin and northern rivers,
low salinity waters were tracked along the central GBR shelf between the Burdekin
River mouth and Cairns, 350 km to the north, and as much as 40 km away from the
coast (Wolanski & Jones 1981; Wolanski & Van Senden 1983). Mostly, however, the
low salinity flood waters remained close to the coast, well away from outer shelf reefs.
High suspended sediment loads were restricted to the coast, with most fine
particulate matter settling out of the water column at salinities < 10 ppt, near the river
mouth (Wolanski & Jones 1981).
Most of the sediment transported by river systems is deposited within 10 km of the
coast. In particular, the northward facing embayments, trap large amounts of sediment
(Johnson et al. 1997; Woolfe & Larcombe 1998). Isotopic and geochemical markers
indicate that the bulk of terrestrial organic matter discharged from rivers is deposited
in coastal sediments (Gagan et al. 1987; Risk et al. 1994; Currie & Johns 1989; Pailles
et al. 1993; Walker & Brunskill 1997a, b). Only small amounts of terrestrial sediments
appear to reach the outer shelf reefs, primarily during major cyclonic floods when river
plumes can cover extensive areas of the shelf (Brodie & Furnas 1996; Devlin et al.
2002), and mid- and outer-shelf reef sediments contain very low proportions of
siliceous, terrestrially derived sediments (Okubo & Woolfe 1995).
Early observations of the presence of flood plumes in the GBR lagoon around Low
Isles in 1929 were made by Orr (1933) who noted that the adjacent Daintree River
was in flood. Widespread loss of coral cover associated with the major floods of 1918
(the ‘Mackay’ cyclone) in the Whitsundays area was reported by Rainford (1925) and
Hedley (1925).
2.2.4 Other Sources - Water Dynamics and Sediment Resuspension
The volume of the GBR lagoon, from the coast to the 100 metre isobath on the edge of
the continental shelf, is approximately 8000 km3. Water in the GBR lagoon typically
has a salinity of 34 to 36 ppt (Furnas & Brodie 1996; Andrews 1983), except during
monsoonal rainfall periods when salinity close to the coast may range from 28 to 33
ppt for long periods, and in major river plumes when salinity may range from 2 to 30
ppt (Brodie & Furnas 1996; Devlin et al. 2001).
Water circulation within the GBR lagoon is largely driven by tides and the dominant
south east tradewinds (Wolanski 1994). Exchanges of water between the GBR lagoon
and the Coral Sea occur through tidal exchange and episodic upwelling of Coral Sea
water along the edge of the continental shelf (Furnas & Mitchell 1997; Wolanski 1994).
Vertical mixing induced by wave action, currents and the reef matrix keep the water
12column well mixed. The general water flow on the outer GBR, south of 16°S, is to the
south. Inshore, where the effects of the south-east trade winds predominate, average
water flow is to the north (Wolanski & King 1997). Generally, a significant barrier
exists between mixing of inshore and offshore GBR waters due to the current regimes
(King 1995). This hinders the movement of materials, including contaminants, from
inshore to the mid-shelf area and from the Coral Sea to the inshore reefs. Flushing of
the GBR lagoon is limited by the enclosure formed by the main reef. Residence times of
water in the inner lagoon, while not precisely known, may be prolonged (Wolanski
1994). Suspended solids, and potentially nutrients and other contaminants may
remain in the inner lagoon, that is to the 20 metre isobath, for periods of weeks to
months due to recycling and resuspension processes (Wolanski 1994; Furnas et al.
1995).
It is assumed that suspended particles carried by terrestrial runoff are not transported
beyond the inner lagoon (Currie & John 1989; Larcombe & Woolfe 1999). Suspended
solids stay in the inner lagoon for prolonged periods due to wind-driven resuspension
in the shallow waters of the inner shelf (Wolanski 1994; Larcombe et al. 1995).
Suspended sediment concentrations of up to 50 mg/l in the upper water column and
200 mg/l near the bottom are common in areas such as Cleveland and Halifax Bays
under windy conditions (Larcombe et al. 1995). Additional particles that are rich in
organic material are formed during mixing processes in estuaries by aggregation and
microbial colonisation of fine particles (Ayukai & Wolanski 1997; Wolanski et al.
1997), and by planktonic biomass. During resuspension, significant amounts of
nutrients are released from the sediments and the sediment porewater (Ullman &
Sandstrom 1987; Chongprasith 1992). Nutrient release from suspended sediments
during storm events stimulates phytoplankton growth during subsequent days (Walker
& O’Donnell 1981) when chlorophyll a concentrations may reach 1.5 µg/l compared to
background concentrations of 0.4 µg/l. The concentration of phytoplankton, measured
as chlorophyll a concentration, is used as an integrative parameter to monitor nutrient
concentrations in the GBRWHA (Brodie et al. 1997; Steven et al. 1998). In cyclonic
wind conditions large masses of sediment are resuspended and moved (Gagan et al.
1987; Gagan et al. 1990). After a cyclone, the nutrients released by resuspension
stimulated a phytoplankton bloom in southern GBR shelf waters with chlorophyll a
concentrations reaching 18 µg/l (Furnas 1989).
Sediment resuspension and the coastal northward current flow are the principal
mechanism for the northward and shoreward transport of sediments along the GBR
(Orpin & Ridd 1996). These mechanisms concentrate materials, such as suspended
solids, nutrients, and associated contaminants in the inner lagoon.
During low flow conditions, either during the dry season or caused by flow restriction
from dams, weirs, etc., very little material is transported out of the rivers. This may
occasionally lead to pollutant concentration problems in sheltered bays and inlets,
which are not flushed out. Generally, however, the discharge into the sea is event
driven and largely dependent on large flood events during the summer (Bramley &
Johnson 1996; Mitchell et al. 1997).
2.3 Constituents of Terrestrial Runoff
The main constituents of concern in terrestrial runoff include nutrients and sediment,
heavy metals and other contaminants, freshwater, and highly acidic water and litter.
2.3.1 Nutrients and Sediment
The GBR is characterised by low nutrient concentrations so GBR ecosystems naturally
derive most of their nutrient supply from internal recycling processes (Furnas et al.
1995). ‘New’ nutrients are introduced into the GBR lagoon by river discharge and
13point sources (section 2.2). Rain, upwelling of the Coral Sea and nitrogen fixation by
cyanobacteria are natural sources of ‘new’ nutrients (Furnas et al. 1995).
In the central GBR it is estimated that terrestrial runoff of nutrients provides
approximately 41% of the ‘new’ nitrogen (N) and 60% of the ‘new’ phosphorus (P)
inputs to shelf waters from external sources (Figure 3, Furnas et al. 1995). These
terrestrial nutrient inputs enter the shallow coastal areas of the GBR lagoon that
comprise only a small percentage (< 10%) of the total GBR shelf area and water
volume. Consequently, any changes in water quality caused by terrestrial activities will
be most apparent in the coastal areas of the GBR lagoon.
The findings of several nutrient (N and P) monitoring programs in the GBR region over
the past 20 years provide a good overview of the ambient nutrient concentrations in
the GBR lagoon (Bellamy et al. 1982; Furnas & Mitchell 1984a, b; Furnas et al. 1988,
1990, 1995). Minimum concentrations of almost all measured nutrient species are
observed in the Far Northern Section of the GBRMP. This Section is adjacent to the
north-east Cape York catchment, an area predominantly used for cattle grazing at
low-stocking rates that remains relatively undisturbed (DPI 1993a). Elevated
concentrations of a number of nutrient species are found in the Torres Strait, the
Cairns Section and the Central Section of the GBRMP.
The water quality of the shelf area adjacent to Cairns and Innisfail (Cairns Section)
has been studied intensively and local cross-shelf gradients in nutrient concentrations
are evident (Furnas et al. 1995; Furnas & Brodie 1996; Furnas & Mitchell 1997). In
general the data indicate that in the absence of local river runoff, the very low
dissolved nutrient conditions which prevail in mid-shelf and lagoonal waters of the
GBR are also characteristic of shallow nearshore waters. However, particulate nutrient
concentrations are consistently higher inshore (Furnas et al. 1995, 1997); particulate
nitrogen (N) and particulate phosphorus (P) are approximately 30–50% and 70%
higher respectively (Furnas et al. 1997).
Dissolved nutrient concentrations from inshore waters, in the absence of local river
runoff, range from non-detectable to 2 µM for dissolved inorganic nitrogen (DIN) and
from non-detectable to 0.2 µM for phosphate (Furnas et al. 1995; Furnas & Brodie
1996; Devlin et al. 1997; Schaffelke et al. in press).
Sediment and nutrient runoff from the coastal catchments of Queensland have been
estimated using existing data and catchment models (Moss et al. 1992; Neil & Yu
1996; Rayment & Neil 1997). The most current and sophisticated modelling effort has
been completed within the National Land and Water Resource Audit (NLWRA) by
CSIRO Land & Water (NLWRA, unpub. Data; methodology in Prosser et al. 2001).
According to these latest estimates 12 million tonnes of sediment, 47 thousand tonnes
of nitrogen and 10 thousand tonnes of phosphorus are exported to the inner GBR
lagoon via river discharge annually. Even though there are large differences between
the catchment models employed (Wasson 1997) all estimates indicate an increase in
terrestrial nutrient and sediment delivery to the GBR of at least four-fold since
European settlement. A river monitoring program, presently being conducted by the
Australian Institute of Marine Science (M. Furnas, AIMS, pers. comm.) will supply
data for improved ground-truthing of the nutrient export estimates.
Cattle grazing is the largest contributor of nutrients and sediments to terrestrial runoff
(Figure 5). Even when there is minimal runoff from grazing lands they lose significant
amounts of sediment and associated nutrients in comparison with natural or
plantation forests and woodlands. Average soil erosion rates for Queensland grazing
lands range from 0 to 4 t ha-1 yr-1 (Elliott et al. 1996). The principal cause for nutrient
losses is the clearing of vegetation and overgrazing, which in turn leads to the loss of
nutrients naturally present in the soil (Prove & Hicks 1991). This is significant as
14extensive removal of grass and vegetation cover occurs in grazing lands particularly
during extended drought periods.
Forest
6%
Other ForestEvidence for elevated metal levels from past mining activity has been found off the
Burdekin River in Bowling Green Bay (Walker & Brunskill 1997a, b). Significantly
elevated mercury levels (up to 20 µg/kg) were found in sediment cores and this has
been linked to the use of mercury in gold recovery during the peak (1870–1890) of gold
mining in Charters Towers, a small town approximately 100 kilometres inland on the
Burdekin River. Sediment cores taken in the Hinchinbrook Channel and Missionary
Bay show close correlation between elevated mercury levels in marine sediments, and
the application of Shirtan mercury as a fungicide on cane land in the Herbert River
from 1950 to 1996 (Brunskill et al. unpub. data). Accumulated concentrations of
mercury in these soils have almost doubled since 1950. In harbour and port areas, such
as those of Townsville and Gladstone, very high concentrations of metals are often
found in sediments (Jones & Thomas 1988). This is usually attributed to ore spillage,
stormwater runoff and ship building and repair.
Once in the water column, heavy metals may be bioaccumulated by marine organisms
(Chester & Murphy 1990; Rainbow 1990). Elevated heavy metal concentrations,
particularly of cadmium, have been found in dugong tissues (especially liver and
kidney) from the GBR (Denton et al. 1980; Gladstone 1996) and in crustaceans
(prawns, crayfish and spanner crabs) from Torres Strait (Evans-Illidge 1997). These
are, however, believed to be naturally high and not associated with contamination
sources.
2.3.3 Other Contaminants
Organochlorines are carbon-based chemicals compounds containing chlorine. Many of
these compounds are artificial and have a wide range of industrial and agricultural
applications. They include pesticides and herbicides such as DDT, lindane, diuron
and 2,4-D and polychlorinated biphenyls (PCBs). Organochlorine pesticides were
widely used in Australia until the use of many were banned in the late 1980s. The
main organochlorine pesticide still in use today is the insecticide endosulfan.
Polychlorinated dibenzo-p-dioxins (PCDDs) and polychlorinated dibenzofurans
(PCDFs) form as unwanted by-products of processes such as waste incineration, coal
burning, metal smelting, car exhausts, pulp and paper manufacture and sugarcane and
trash burning (Anon. 1989; Müller et al. 1996a, b). They also occur as contaminants in
a range of herbicides and in polychlorinated benzene (PCB) compounds (Safe &
Hutzinger 1989).
Organochlorines enter the aquatic environment through terrestrial runoff, urban storm-
water runoff, and as aerosols (Clendening et al. 1990). Once in the water column,
organochlorines adsorb to fine particulates or are bioaccumulated into lipids in
aquatic biota (Olsen et al. 1982). The bioaccumulation of organochlorine pesticides
and PCBs has been linked to reproductive and immunological abnormalities in
terrestrial bird populations and in marine mammal populations (Boon et al. 1992).
Many of these compounds are also assumed to be carcinogens (Richardson 1995).
Herbicides have the potential to adversely impact seagrasses (section 3.2). Measurable
quantities of the herbicide diuron and of other pesticides have been detected in
sediments and seagrass at a number of locations along the GBRWHA coast and in
Moreton Bay (Haynes et al. 1999). Pesticide residues were also detected in estuarine
sediments and biota along the Queensland coast (Mortimer 2000) and in surface water
of streams in the Johnstone River catchment (Hunter et al. 1996). Cavanagh et al.
(1999), however, did not detect pesticide residues in coastal sediments in Bowling
Green Bay or around Hinchinbrook Island.
High levels of octa-chloro-p-dioxin (OCDD) were detected in intertidal and/or
estuarine sediments along the Queensland coast between Brisbane and Cardwell
although the source of the dioxin has not yet been clearly identified (Müller et al.
161999). The Queensland OCDD levels were higher than levels in areas that are regarded
as polluted such as waterways close to urban areas in Europe and the United States.
Polycyclic aromatic hydrocarbons (PAHs) are derived from petroleum products. They
are known carcinogens and mutagens (Clark 1992; Benlahcen et al. 1997) that are
easily bioaccumulated in some aquatic organisms (Connell 1995) and have been
implicated in a wide range of human health effects as well as disease problems in
aquatic organisms (Grimmer 1983; Plesha et al. 1988).
2.3.4 Freshwater
In Queensland catchments, as in many catchments overseas, the area of land covered
with vegetation has been reduced and replaced by consolidated surfaces in urban
areas, roads, and drainage schemes that result in higher volumes of water runoff.
Conversely, the presence of dams on many GBR rivers may moderate flows and an
estimated 13% (8 km3) of the average annual discharge from the GBR Catchment is
potentially captured in existing reservoirs (Gilbert et al. in press). The implications of
changes in mean freshwater flow and the impacts of river regulation on estuarine and
marine habitats are largely unknown (Robertson et al. 1996), however, low salinity
events from cyclonic rainfall floods have caused coral reef bleaching and mortality in
the GBRWHA (e.g. Berkelmans & Oliver 1999; Hoegh-Guldberg 1999).
2.3.5 Acid Sulfate Soils
Acid sulfate soils (ASS) is the common name for soils that contain iron sulphides. ASS
are potentially widespread in coastal Queensland especially below 5 AHD; an
estimated 2.3 million hectares of coastal lands contain actual or potential ASS (Powell
& Ahern 1999). These soils occur naturally in water-logged soils in low-lying coastal
areas and are harmless when they remain below the water table. When ASS become
exposed to air, by disturbance or drainage, the iron sulphides are oxidised and
produce sulphuric acid (White et al. 1996). Acid leaching leads to severe acidification
of adjacent waterways (pH as low as 2) as well as the mobilisation of toxic heavy
metals (iron and aluminium) naturally present in the soil. The impact on coastal biota
and habitats is severe, including fish kills and fish diseases (Sammut & Lines-Kelly
1997).
The more recent identification of the toxic cyanobacterium Lyngbya majuscula (forming
extensive benthic mats) as the cause of dermatitis in fisherman around northern
Deception Bay in south-east Queensland has raised further concerns about the effects
of ASS runoff (Dennison et al. 1999a). Blooms of Lyngbya majuscula in Queensland
coastal waters are triggered by dissolved iron runoff from acid sulfate soils and the
leaching of ‘coffee rock’, an organic iron-rich geological deposit formed in vegetated
sandy soils (Dennison et al. 1999b) and can cause severe damage to seagrass beds. In
addition to the contact dermatitis, Lyngbya has been linked to breathing irritation and
eye inflammation. Further investigation is required into the occurrence of these blooms
in the GBRWHA.
2.3.6 Litter
Stormwater discharge, particularly from urban areas, carries quantities of litter into
the GBR. Surveys of litter on GBR islands have shown that much of the material is
ship-sourced however a significant proportion may come from terrestrial sources
(Haynes 1997). As well as aesthetic concerns, litter may be implicated in the
entanglement of marine animals such as turtles (Carr 1987), birds (Laist 1987),
mammals (Beck & Barros 1991) and fish (Laist 1987).
17You can also read