A Road Safety Strategy for Solihull 2017-2030 - Involving local people in keeping Solihull safe - Solihull Council
←
→
Page content transcription
If your browser does not render page correctly, please read the page content below
Involving local people in keeping Solihull safe

A Road Safety Strategy for
Solihull 2017–2030

Involving local people in
keeping Solihull safe

Building Safer and Healthier Communities,
now and for the future

1
2
Involving local people in keeping Solihull safe

3
List of Contents
Our strategy on a page (executive summary)                                 5

Setting the Scene                                                          7
Background                                                                 7
Nationally                                                                 7
Regionally                                                                 8
Locally                                                                    8
Past Performances                                                          9
Financially                                                                9

Our challenges                                                             10
Quick wins – already achieved                                              10
Chart 1 – Killed and seriously injured road casualties trend (2000–2015)   10
Chart 2 – Components of collisions                                         11
Who is injured?                                                            11
Chart 3 – Solihull casualties by mode of travel                            11
Chart 4 – Solihull child casualties by mode of travel                      12
Chart 5 – Road traffic casualties in Solihull by gender/age (2013–2015)    12
Chart 6 – Full car driving licence holders in England by gender/age        13
Chart 7 – Road traffic casualties in Solihull by class/age                 13
Which road users are at more risk?                                         13
Which groups are at most risk?                                             16
Where do road traffic collisions occur?                                    19
Where do casualties live?                                                  20

This is where we want to be                                                21
Our targets                                                                21

This is how we will get there                                              24
Partnership working                                                        24
Smarter data analysis                                                      26
Behavior change                                                            27
Communication                                                              28
Maintenance                                                                29
Road Design                                                                31
Speed Management                                                           33
Connected and autonomous vehicles                                          36
Pedestrians                                                                37
Cycling                                                                    38
Motorcycling                                                               39
Young drivers                                                              39
Children                                                                   40
Older people                                                               40
Finance                                                                    40

Appendices                                                                 41
Appendix 1 – Action Plan                                                   41
Appendix 2 – (Local Safety Scheme Analysis (Single Sites and Routes))      45

4
Our strategy on a page
Setting the Scene
The development of this latest road safety strategy has been influenced by national, regional
and local policy objectives and forms an integral part of wider reaching transport plans
established in Solihull Council’s ‘Solihull Connected’ transport strategy.
Regionally there will be significant governance changes with the first Mayor for the West
Midlands being elected on 4 May 2017 and powers being moved from Whitehall to the new
West Midlands Combined Authority. These changes are likely to have a significant impact on
the delivery of transport initiatives including road safety.
Our challenges
Many of the quick wins have already been achieved and it is increasingly difficult to find
patterns in collisions that can be addressed through engineering measures.
Our main challenges are:
• The ‘Fatal 4’: (excess speed; use of mobile phones / electronic devices; failure to wear a
seatbelt and drink or drugs.)
• Child pedestrians aged between 10 and 15.
• Male cyclists between the ages of 30 and 60.
• Young male motorcyclists between the ages of 16 and 29.
• Young male drivers between the ages of 17 and 29.
Where we want to be
The target that we have adopted for the year 2030 is to reduce the 5 year annual average
number of people killed and seriously injured in road traffic collisions to 55% of the 2005 to
2009 average.
How we will get there
In our strategy we have taken into account the national strategic ‘safe system’ approach and
adapted it to suit the local needs of the Borough through a wide range of interventions:
• Working in partnership and playing to the strengths of the different agencies involved by
co-ordinating the use of complementary skills.
• Smarter data analysis of road traffic collisions and those involved is an essential part of
our strategy to reduce road traffic casualties.
• Behaviour change will be a key element to our success and increasingly programmes will
be based on psychological behavioural change.
• Communication and social marketing are very powerful tools and we aim to make better
use of these.
• Highway maintenance and road design schemes will be reviewed for opportunities to
improve road safety without any significant additional cost.
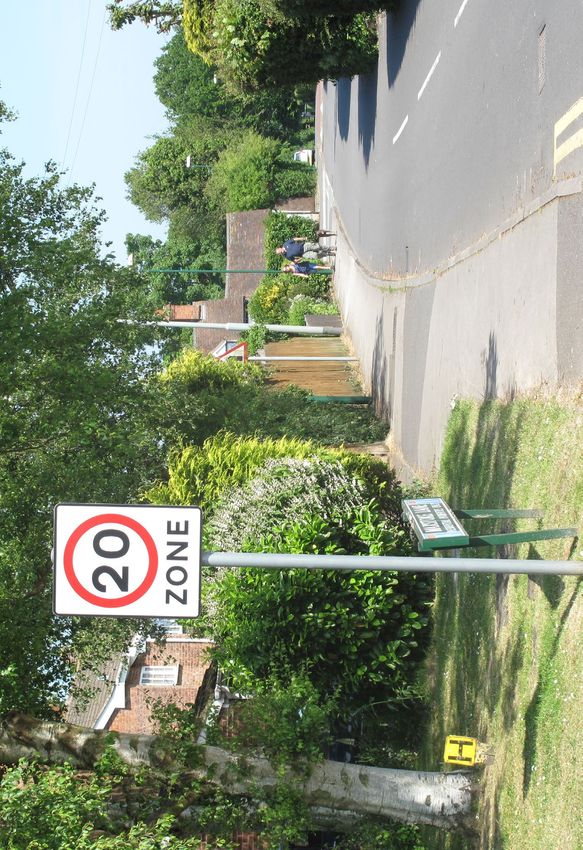
• Speed Management, particularly on urban roads where there are high numbers of
vulnerable road users will be an on going part of our work.
• Connected and autonomous vehicles are likely to play a significant part in reducing
casualties and we will investigate joint working with a vehicle manufacturer so that we are
well placed locally to reap the full benefits from this technology.
• Focusing on our challenges of the fatel four, child pedestrians, cyclists, motorcyclists and
young male drivers.
5
6

Setting the Scene
Background
This refreshed Road Safety Strategy for Solihull builds on the strengths and success of the
previous Strategy, published in 2012.

In this latest Strategy we take account of the most recent thinking and consider the emerging
national, regional and local issues that affect road safety delivery as well as taking account of
the lessons learnt over the past five years.

The strategy is an integral part of wider reaching transport plans and has a balanced
approach that takes account of other Council and Safer Solihull Partnership objectives;
particularly those relating to health and wellbeing. Within that context, the aim is to minimise
the number of people in Solihull who are injured in road traffic collisions, set out our
expectations on performance and show how road safety will be developed.

The Strategy will cover the period up to 2030, with a periodic review every five years to
support the lifespan of the document and provide a flexible response to emerging collision
types, trends and hot topics.

Nationally
On 11 May 2011, the Department for Transport (DfT) published a Strategic Framework for Road
Safety, which includes the Government’s key themes and a package of policies. There is a split
between national measures that the Government intends to take and areas where the policy
and delivery will reflect local priorities and circumstances. The Framework does not have any
overarching casualty reduction targets or definitive forecasts and accepts that predicting
future levels of road deaths and injuries is not straightforward. There is, instead, a Road
Safety Outcomes Framework, which sets out six indicators to be monitored at a National level
and three key indicators at a local level. These indicators are set out in more detail in the
section on Targets.

The Strategic Framework for Road Safety is available on the DfT’s website.

In December 2015 the Secretary of State for Transport presented to Parliament a British Road
Safety Statement ‘Working Together to Build a Safer Road System’.

The statement confirmed the government’s commitment to invest in road safety. It also set
out the context of road safety in Britain today and listed the government’s key priorities for
road safety. Adopting the Safe Systems approach was one of those key priorities and is a
theme that runs throughout the statement. The approach promotes a ‘five pillar’ strategic
approach for managing road safety as listed below: -

•   Pillar 1:   Road Safety Management
•   Pillar 2:   Safer Roads and Mobility
•   Pillar 3:   Safer Vehicles
•   Pillar 4:   Safer Road Users
•   Pillar 5:   Post Crash Response

The Working Together to Build a Safer Road System: British Road Safety Statement is available
on the DfT’s website.

7
Regionally
In June 2016 - the West Midlands Integrated Transport Authority, Centro and the West Midlands
Passenger Transport Executive were dissolved and replaced by the West Midlands Combined
Authority (WMCA) with the transport arm of the Combined Authority being led by Transport for
West Midlands (TfWM).

The WMCA strategic transport plan, ‘Movement for Growth’, sets out the long-term approach to
guide many transport improvements, to be made over a twenty year period. In that strategic
plan the future of road safety is recognised as being critical and includes a proposal for a new
road safety strategy which will be aimed at reducing by at least 40% the number of killed and
seriously injured road traffic collisions within ten years from a 2015 base, whilst increasing the
amount of cycling and walking in the metropolitan area.

The West Midlands ‘Movement for Growth’ strategic transport plan is available on the TfWM
website.

Locally
In August 2016 we published ‘Solihull Connected’ a new transport strategy for Solihull.

The document marks out our vision for how we will deliver transport infrastructure and
initiatives in the future, how we will accommodate growth in travel demand on our highway
network and how we will seek to maintain Solihull’s character.

The transport strategy provides a long-term strategic vision for how we manage the extra
travel demand brought about by the predicted economic and population growth, both in the
Borough and across the West Midlands.

Solihull Connected is aligned with the West Midlands Strategic Transport Plan, ‘Movement for
Growth’, which provides the strategic direction for transport across the region. Solihull
Connected takes that overall direction and shows how it can be applied within the Borough.

Solihull Connected recognises that the Council’s current Road Safety Strategy will have to be
refreshed and that the new Safety Strategy will be linked to the vision and policies set out in
Solihull Connected.

The Solihull Connected transport strategy is available on Solihull Council’s website: Solihull
Connected.

More recently we have published a Solihull Connected Delivery Plan which aims to turn the
Solihull Connected vision in to reality by identifying the specific transport priorities for
development to an investment-ready state. The Solihull Connected Delivery Plan introduces a
new initiative called the Community Liveability Programme which is about local transport
interventions, of small, impactful schemes that support local neighbourhoods and centres to
improve people’s everyday lives. The programme also links to wider agendas like health,
community engagement and place-making.

In support of this we are committed to promoting active travel, such as walking and cycling, as
part of the strategy to reduce obesity in children and adults in the borough. Active travel has
many benefits including the improvement of health and mental wellbeing, reduction in
congestion on the roads and reduction in environmental pollutants from exhaust fumes. We
will work in partnership with the Council’s Public Health team to promote active travel,
particularly to school and work, and will also work with them to promote road safety
messages through their commissioned services, such as Health Visiting and School Nursing.

8
Funding
The outcome of the government’s 2010 autumn spending review for the years 2011/12 through
to 2014/15 led to a reduction in the funding made available to local authorities, the fire
services and the police. In Solihull significant savings were made over the period covered by
the review.

The autumn 2015 review of government expenditure indicated a further reduction in the
overall funding to local authorities along with significant changes to the funding system. The
Revenue Support Grant for local authorities is being phased out and replaced by other
changes to local funding, including the retention of business rates.

These latest funding changes and reductions will require further savings with all areas of
expenditure being considered, including road safety. To minimise the impact of the savings
the Council will look to be even more innovative as it moves towards establishing a viable
self-sufficient budget.

Past Performance
The good news is that Britain’s roads are very safe by all international comparisons. In terms
of global road safety we remain second with only Sweden having a better record. (Working
Together to Build a Safer Road System) There were fewer people killed on British roads in 2013
than at any time since records began in 1927. (Reported road casualties in Great Britain 2015
–Table RAS41001)

Not only are Britain’s roads very safe but also Solihull is one of the best performing local
authorities having one of the lowest casualty rates for each mile driven. (Reported road
casualties in Great Britain 2015 –Table RAS41003)

In 2000, the Department for Transport (DfT) published its targets for reducing road casualties
by the year 2010 based on the 1994-1998 average. These were a:

•   40% reduction in the number of people killed or seriously injured.
•   50% reduction in the number of children killed or seriously injured.
•   10% reduction in the number of people slightly injured.

In Solihull we had already exceeded the national target of a 40% reduction in the number of
people killed or seriously injured in 2001 and by 2010 we had achieved a 65% reduction.

In 2008, we adopted Local Area Improvement Targets for the period 2008-11 which included a
more challenging local National Indicator (NI) 47 and an updated NI 48. Those were as follows:

•  NI 47 Killed and seriously Injured – A 7.5 % reduction between the 2005-07 average (83) and
   the 2008-10 average (77).
• NI 48 Children under the age of 16 killed and seriously Injured - A 3 year average of no
   more than 13 children killed or seriously injured based on an average of the three years
   2008-10.
While we did not meet those more challenging targets we continued our good long term
performance in reducing the number of people killed and seriously injured on our roads.

In 2012, the Solihull Road Safety Strategy (2012-2016) set a new target of reducing the five year
rolling average of killed and seriously injured casualties by 17.3% between the baseline 2005-
09 (average of 85) and the 2011-15 average. We exceeded that target and reduced the number
of people killed or seriously injured by 39% (a five year average of 52 people).

9
Our Challenges
Quick wins - already achieved
We have continued, in common with many local authorities across the UK, to make impressive
reductions in traffic-related injury, especially in the killed and seriously injured category.
Chart 1 illustrates our good performance in reducing Killed and Seriously injured casualties
over the last fifteen years, despite an overall increase in traffic.

Chart 1 – Killed and Seriously Injured (KSI’s) Road Casualties (2000 – 2015)

However, over the past few years we have found it increasingly difficult to find patterns in
collisions that can be addressed through engineering measures. Future casualty reductions
will be harder to achieve unless new approaches are used as many of the quick wins have
already been achieved.

Increasingly we need to place more emphasis on educating road users to change risky
behaviours. Most collisions are attributed to human error as demonstrated in Chart 2.
Aggression and a lack of empathy towards other road users are characteristic of the way too
many people travel and we need to try to utilise behaviour change techniques to tackle those
attitudes. In particular we will look to develop programmes that address the ‘Fatal 4’: excess
speed, use of mobile phones / electronic devices, failure to wear a seatbelt and drink or
drugs.

10
(Chart 2 – Components of collisions)

           Road                        Road env. & Road user     Road user 65%–77%
        environment                          16%–27%
            2-3%

                                              All Three
                                             0.3%–1.8%

            Road env. & Vehicle
                  0.1–3%

                                                                          Road user &
                                              Vehicle 2–3%                Vehicle 2–6%

We also need to understand that we can never entirely eliminate road collisions because
there will always be some degree of human error and work towards minimising injuries.

Who is injured?
If we look at the number of people injured in Solihull by mode of travel, car occupants are the
road user group with the greatest number of casualties each year. However, this is
unsurprising as cars account for around 80 per cent of the distance travelled.

When compared to the years 2008-2009 {A Road Safety Strategy for Solihull 2012-2016: Chart 2}
the proportion of pedal cyclist casualties has increased from 7% to 11%. The proportion of
casualties for other modes of travel has reduced or, in the case of pedestrians, remained the
same.

Chart 3 – Solihull Casualties by Mode of Travel (2013 - 2015)

11
When looking at child casualties under the age of 16, as Chart 4 demonstrates, the majority of
casualties are either as car occupants or pedestrians.
Chart 4 – Solihull Child Casualties by Mode of Travel (2013-2015)
Chart 5 below provides a demographic breakdown of the people injured from road traffic
collisions in Solihull. This shows that:
• Males and females are both most at risk of being injured in the 20 - 29 age groups.
• The proportion of male casualties is more than 30% higher than females despite the
overall population being evenly balanced. (If we look at killed and seriously injured
casualties the proportion of males is more than 100% higher than females).
Chart 5 – Road traffic casualties in Solihull by gender/age (2013-2015)
In 2015, 74% of the population in England aged 17 and over held a full car driving licence
compared with 48% in the mid 1970s with the increase in driving licence holding being
greatest among older age groups.
During the last 20 years the proportion of males holding driving licences has remained at
about 80% whereas for women it has continued to increase reaching 68% in 2015.
12Chart 6 – Full car driving licence holders in England by gender / age
Chart 7 below provides a breakdown by road user type and age of the people injured from
road traffic collisions in Solihull and shows that:
• The 10 to15 age group is at the greatest of being injured as a pedestrian.
• The group at the greatest risk of being injured as a vehicle or pillion passenger is the 16
to19 age group. (proportionately for the age range covered).
• The 20 to 29 age group is at the greatest risk of being injured as a vehicle driver or rider.
Chart 7 – Road traffic casualties in Solihull by class / age (2013-2015)
Which road users are at more risk?
To enable us to better understand and target a reduction in casualties for those people who
are at greatest risk, we have drawn on research carried out throughout the UK. {Reported road
casualties in Great Britain 2015}
Using that research we have looked at casualty rates in terms of the number of casualties per
mile travelled. In these terms, the road user groups are split into two clearly distinctive
groups. The first, with much higher casualty rates, are typically referred to as vulnerable road
users (usually defined as pedestrians, pedal cyclists, motorcyclists). All of these groups have
much higher casualty rates per mile travelled in comparison with the other road user groups,
as shown in Chart 8.
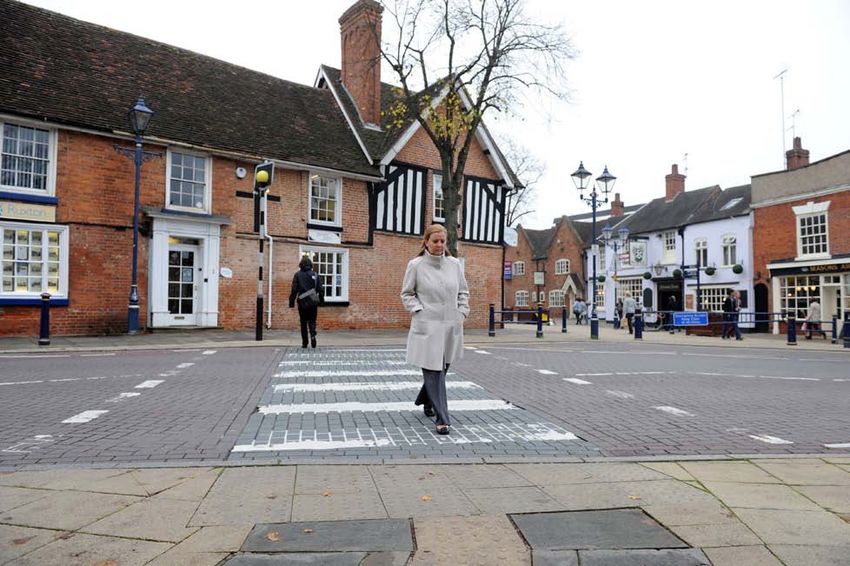
13Chart 8 – Casualty rates by road user type, Great Britain: 2014 (per billion passenger miles) Despite the elevated risks for vulnerable road user groups, it is important that we recognise the benefits of these modes of travel. Pedestrians Nationally, walking is the second most used mode of travel after the car accounting for 22% of trips and 3% of the distance travelled. Women make more walking trips than men generally, with the 21 to 29 age group having the greatest difference. In Solihull pedestrians represented 21% of all the people killed and seriously injured in road traffic collisions and 14% of all injuries with the highest risk group being young pedestrians between the ages of 10 and 15. 14
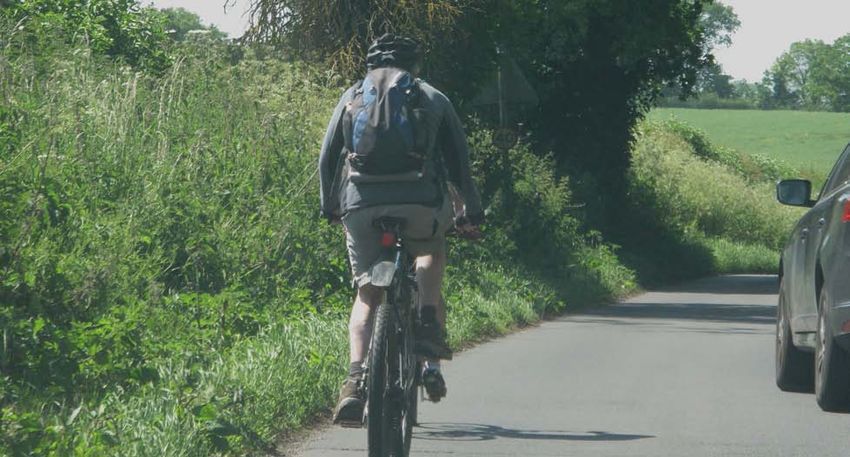
Cyclists
Nationally cycling only accounts for 2% of trips and 1% of the distance travelled but it
accounts for 14% of killed or seriously injured casualties. Along with other vulnerable road
users they do not have the protection of a vehicle body to help reduce the risk of injury.
Cyclists also tend to be harder for other drivers to see and are less likely to be able to
accelerate quickly to avoid obstacles and collisions.

Over the last twenty years the number of cycling trips has dropped by 14% but the distance
travelled by bicycle has increased by 16%. On average, men of all ages, make more cycling
trips than women and travel further on those journeys, with men accounting for 79% of the
distance travelled.

The majority (68%) of cycling is on urban roads and therefore it is not surprising that most of
the pedal cyclist casualties (81%) also occur on urban roads. However, over half (58%) of pedal
cyclist deaths happen on rural roads, which have higher speed vehicles.

Cycling has many benefits and the perceived disadvantages are far outweighed by the the
advantages. It is a form of transport that provides health benefits and is one of the easiest
ways to fit exercise into the daily routine. Cycling is also better for the environment and can
save money, fuel and time.

In Solihull, between 2013 and 2015 pedal cyclists represented 13% of all the people killed and
seriously injured in road traffic collisions and 11% of all injuries. The majority, (88%) of cyclists
injured are male.

Motorcyclists
Nationally motorcyclists have the highest casualty risk of all road user groups on account of
both their physical vulnerability and the elevated speed at which they can travel compared
with other vulnerable road user groups. Motorcyclists account for less than 1per cent of traffic
each year, but 19 per cent of fatalities. Consequently they are considerably over-represented
in collisions, more so than any other road user group.

Nationally, men account for 86% of the distance travelled on motorcycles and 94% of the
killed or seriously injured casualties. Riders under the age of 25 account for 33% of the killed

15
and seriously injured with those between16 and 20 having more casualties than any other age
group. A second peak in the number of killed or seriously injured casualties also occurs for
riders between the age of 41 and 50.

Motorcyclists are very exposed with relatively little protection, beyond clothing. It is hard to
introduce secondary safety features on motorbikes that will reduce injuries when collisions
occur.

Despite the elevated risks, motorcycling provides an efficient means of transport and can
support affordable social and economic inclusion.

In Solihull, between 2013 and 2015 motorcyclists represented 22% of all the people killed and
seriously injured in road traffic collisions but only 7% of all injuries. The highest risk group is
young male motorcyclists between the ages of 16 and 29, particularly those under the age of
20.

Which Groups Are Most at Risk

Young Drivers
Nationally young drivers are statistically over-represented in reported road collisions. In 2015,
there were 49 road deaths for every million people aged 17-24 compared with 27 deaths for
every million people for the whole population.
• Of all young drivers involved in fatal collisions nearly 79% were male.
• Young drivers are more likely to have collisions that result in either a fatal or serious
   injury at night (10pm -4am). The majority of young driver collisions occur in urban areas
   although the collisions in rural areas are more likely to be fatal or serious.
• Collisions involving young drivers are more likely to have contributory factors relating to
   speed, recklessness and vehicle control compared with older drivers.
• In Solihull there are 40% more collisions involving young drivers aged 17 to 29 than might
   be expected when compared with the rest of the West Midlands. {West Midlands Regional
   Summaries: Young Drivers}
• An assessment of the historic and projected trends indicates that the risk of young people
   in Solihull being involved in collisions will increase.

Chart 9 – Killed or seriously injured drivers by age, Great Britain: 2015
     (per million car driver licence holders)

16
Key factors that need to be taken into account: -
• Analysis of 2001–04 road traffic collisions {Ward et al., 2007a} shows a link between the low
socio-economic status of car occupants and the fatality risk. The analysis also raised a
number of key issues which offer some possible explanations for these differences:
• Speed – in the most deprived areas, there was twice the percentage of fatal crashes
involving excess speed compared with the least deprived quintile;
• Impairment – the areas with the most deprived Index of Multiple Deprivation (IMD) had
over one in five of their fatal collisions involving alcohol or drugs as a contributory factor
compared with one in six for the least deprived;
• Seat-belt wearing – the most deprived IMD areas had nearly twice the percentage of
non-seat-belt wearing fatalities compared with that of the least deprived areas, with the
difference being even more pronounced for passenger fatalities;
• Licence violations – fatalities involving driving licence violations were the most prevalent
in the lowest IMD areas, with the percentage of unlicensed driving being over six times
higher in IMD 1 compared with IMD 5; and
• Insurance violations – the recorded rate of insurance violations in fatal collisions in the
most deprived IMD 1 was over three times higher compared with the least deprived IMD 5.
In Solihull young car drivers aged 17 to 29 are 67% more likely to be involved in an injury road
traffic collision than might be expected based on their population when compared with all
adult drivers. Young male drivers, aged 17 to 29, account for 30% of all the adult drivers who
are killed or seriously injured in road traffic collisions.
Children
Nationally, 95% of pedestrian injuries occur on urban roads, with children being
disproportionately at risk (22% of killed and seriously injured pedestrians are between 8 and
15 years old).
Children are often taken to and collected from primary school by parents and the move to
secondary school is a time when children are generally given greater freedom to travel alone
or with friends for the first time. Unfortunately, statistics show that children are more at risk
of being involved in a road traffic collision during this transition from primary to secondary
school.
17When children travel by car their risk of death or serious injury is highest aged 14 and 15. Over
half of the 15 year olds killed and seriously injured in cars have a driver under the age of 21.
Research shows as children get older they are more likely to begin travelling with drivers only
a few years older and this is particularly the case for young teenage girls travelling in cars
driven by slightly older teenage boys.
There is also evidence that nationally a child from a low-income family is five times more
likely than a child from a high income family to be killed on the roads. Children living in
disadvantaged areas are more likely to live in households headed by single parents (where
parental age, education and literacy levels are typically low), with a parent with a long-term
health condition or disability (including a mental health condition) or in overcrowded
accommodation with a greater than average number of siblings {Towner et al., 2005}. In
addition, the lack of play space within the house may mean that children need to play out in
the streets more than those in other types of household or in other areas {Towner et al.,
2005}.
In Solihull 41% of children injured in road traffic collisions are pedestrians with the 10 to 15
age group being at highest risk.
Older People
Nationally the number of older people in Great Britain has increased at the fastest rate of all
the age groups, with 1.9 million more people aged 70 or over now compared with thirty years
ago.
The proportion of those aged 70 or over sustaining a road injury per year has remained
approximately the same over the last ten years while other age groups have had a decline.
The rapidly increasing population and increased likelihood of this age group to drive and be
more active than they were previously may be leading to the slower reduction in the casualty
figures for this age group compared with the others.
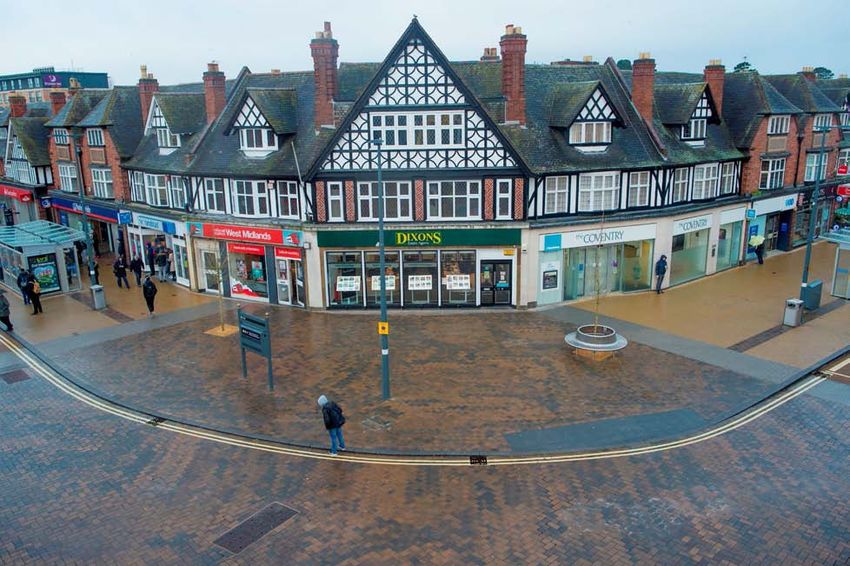
18While there is some evidence nationally of higher rates of pedestrian injuries (Lyons et al., 2003) among older people in disadvantaged areas, large gaps in knowledge exist that need to be addressed to enable proper programme planning and intervention to understand and address this. In Solihull older people, over the age of 60, account for 26% of the population and only 14% of road traffic casualties. The percentage of older people killed and seriously injured in road traffic collisions is much higher (21%). A possible explanation for this is the physical vulnerability of older people with them being less likely to recover from injuries. With the rapidly increasing older population, and the greater likelihood of this age group to drive and be more active, it is likely that their representation in the number of casualties will rise. Where do road traffic collisions occur? Plan 1 indicates the hotspots for all road traffic collisions that involve a person being injured are located in the west of the Borough particularly around: - • Solihull Town Centre. • A45 Coventry Road, just west of M42 junction 6. • A34 Stratford Road, within the Shirley area. Plan 1 – Locations of injury road traffic collisions (2013 – 2015) 19
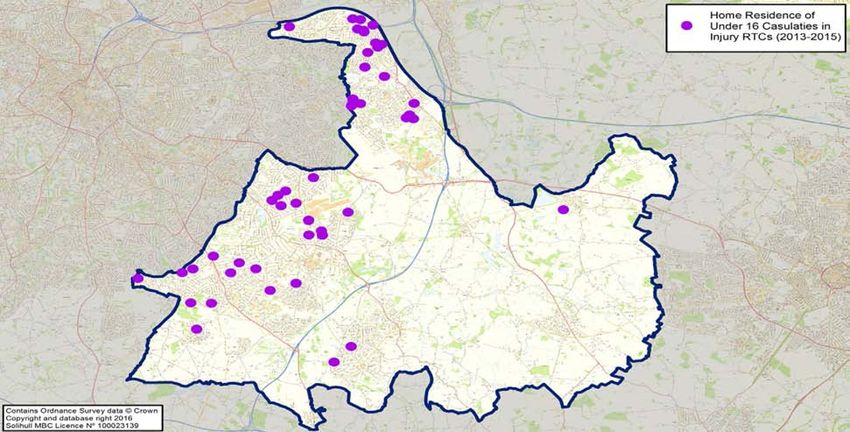
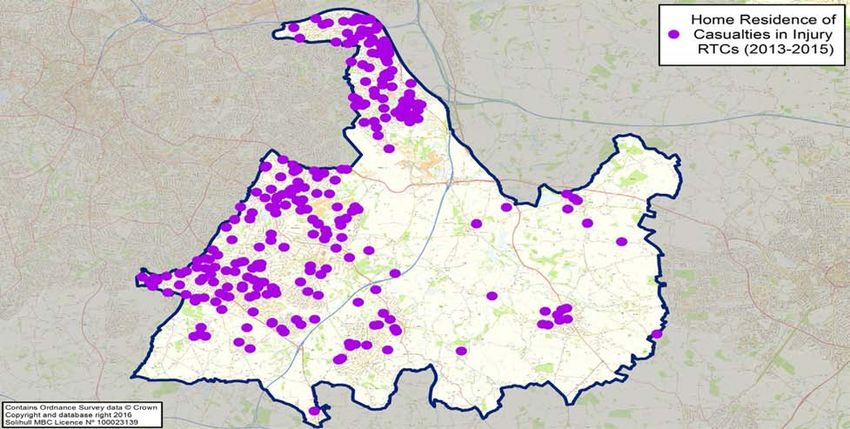
Where do casualties live?
Analysis shows that the home residences of those most likely to become a casualty are
located in the areas around: -
• Smith’s Wood.
• Kingshurst.
• Shirley.

Plan 2 – Home residence of casualties (2013 – 2015)

The home residence locations for casualties aged under 16 indicates a hot spot in north
Solihull particularly in Smith’s Wood and Kingshurst.

Plan 3 – Home residence of under 16 casualties (2013 – 2015)

20
Where we want to be
Over the past few years we have found it increasingly difficult to find patterns in collisions
that can be addressed through engineering measures. Future casualty reductions will be
harder to achieve unless we adapt to meet the emerging challenges. To do this we want to:
• Minimise the number of people in Solihull that are injured in road traffic collisions within
the framework of wider reaching transport plans and other Council and Safer Solihull
Partnership objectives.
• Build on and update the previous Solihull Road Safety Strategy retaining the parts that
remain valid but taking account of the ‘lessons learnt’ and the latest thinking.
• Encourage strong, good quality partnership working – playing to the strengths of the
different agencies involved and co-ordinating the use of complementary skills.
• Increasingly place more emphasis on utilising behaviour change techniques to tackle the
risky behaviours and attitudes displayed by too many road users.
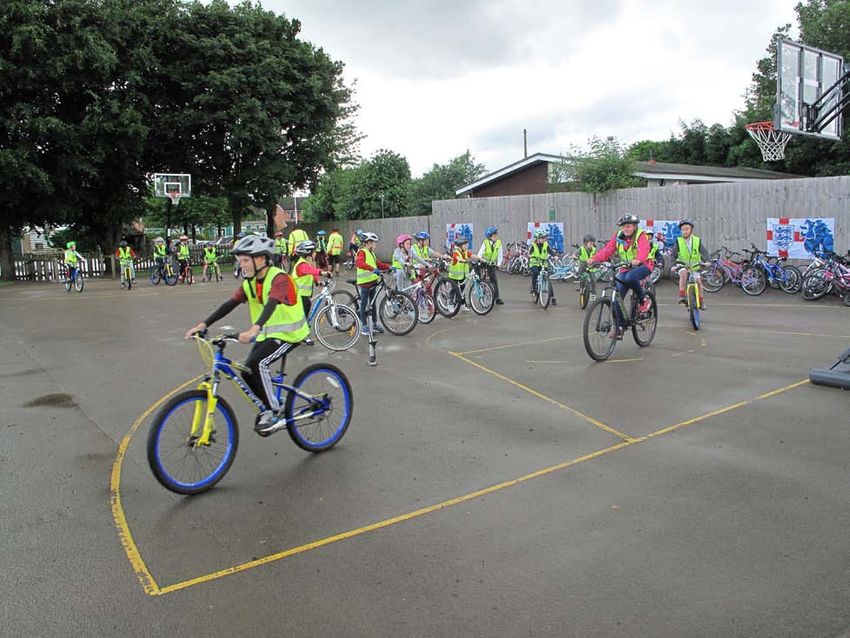
• Consider how road safety can be more widespread and integrated into related areas of
activity such as pedestrian and cycle training rather than being seen as a stand alone
function.
• Encourage the development of a broad based communication strategy that delivers the
right message, to the right people, in the right way and takes full advantage of social
media.
• Follow and promote a flexible data led methodology that takes account of the greatly
reduced number of killed and seriously injured road traffic casualties in Solihull.
Local Road Safety Outcomes
In developing our targets we have considered the regional road safety outcomes in the West
Midlands Strategic Transport Plan, ‘Movement for Growth’ and the National road safety
outcomes in the Strategic Framework for Road Safety.
The West Midlands Strategic Transport Plan, ‘Movement for Growth’ aims at a reduction of at
least 40% in the number of killed and seriously injured road traffic collisions within ten years
from a 2015 base, whilst increasing the amount of cycling and walking in the metropolitan
area.
The Strategic Framework for Road Safety accepts that predicting levels of road deaths and
injuries is not straight forward. It is, however, possible to make broad predictions of casualties
based on past casualty rates and trends, the expected effect of current measures and the
projections of traffic growth.
To produce national projections for road traffic casualties the DfT commissioned the
Transport Research Laboratory to produce forecasts and the target we have agreed is
generally in line with the National Central Projections but considers a five year average to
smooth out yearly variations.
Targets
Unfortunately, we will never entirely eliminate road collisions because there will always be
potential for some degree of human error. We also need to be aware that future casualty
reductions will be harder to achieve and that the remaining collisions will be the most
difficult to prevent.
In addition it has been known for a long time that police data does not provide a complete
record of all personal injury collisions and casualties. Nationally it is estimated that
somewhere in the region of 519,000 casualties go unreported each year.
21Comparisons of road collision reports with death registrations show that very few, if any, road traffic fatalities are not reported to the police. However, it has long been known that a considerable proportion of non-fatal casualties are not known to the police. Hospital, survey and compensation claims data all indicate a higher number of casualties than police collision records would suggest. That police data is not a complete record of all injury collisions should be borne in mind when using and analysing the reported road traffic casualty data. However, police data on collisions remains the most detailed, complete and reliable single source of information on road casualties covering the whole of Great Britain. A new data recording tool for police forces has been rolled out over 2015 and 2016. Surrey Police started using the new system, called CRASH (Collision Reporting And SHaring) in 2012. A number of other forces, including the West Midlands force, adopted it during November and December 2015. Although not apparent in the data for Surrey, there is some evidence that casualty records coming from CRASH have had a 2 percentage point swing from slight injuries to serious injuries. It is anticipated that the Department for Transport will provide more detail and analysis about the National implications of the move to CRASH when the 2016 statistics are reported in September 2017. Over time there may be improvements in reporting and the introduction of CRASH in the West Midlands Police area may lead to increased reporting regionally. Nevertheless, we have decided in principle to follow the local Key Indicators proposed in the Road Safety Outcomes suggested in the Strategic Framework for Road Safety. Our Targets Table 2 indicates the local target that we have adopted for the reduction in the number of people killed and seriously injured. The target is generally in line with the National Central Projections but considers a five year average to smooth out yearly variations. Table 2 – Our target reductions for killed and seriously injured casualties Year(s) 2005–09 average 2016–20 average 2021–25 average 2026–30 average Killed or 85 51 45 38 Seriously Injured Percentage -40% -47% -55% Change on 2005–09 average Table 3 provides a yearly ‘rolling average’ based on those targets. 22
Table 3 – Our rolling average target for reductions in killed and seriously injured

    Solihull’s Road Safety Target Reduction in the number of people killed and seriously injured
    Five Year         2012–16          2013–17         2014–18          2015–19     2016–20
    Average Base      Average          Average         Average          Average     Average
    Line 2005–09
    85                63               60              57               54          51

    Five Year         2017–21          2018–22         2019–23          2020–24     2021-25
    Average Base      Average          Average         Average          Average     Average
    Line 2005–09
    85                50               49              47               46          45

    Five Year         2022–26          2023–27         2024–28          2025–29     2026–30
    Average Base      Average          Average         Average          Average     Average
    Line 2005–09
    85                44               42              41               39          38

We will also monitor child casualties and the two local indicators suggested by the
Department for Transport to ensure that there is a reducing trend:

•        Rate of killed or seriously injured casualties per million people
•        Rate of killed or seriously injured casualties per billion vehicle miles

The data for the above casualty rates is produced annually in the Department for Transport
document ‘Reported road casualties in Great Britain’ which is published each September.

23
How we will get there
The 2012 strategy, although retaining the traditional three E’s – engineering, enforcement and
education, introduced the concept of a target-based approach to road safety looking at
specific groups, issues and risks.
We are now looking to develop our strategy to encompass parts of what is known as a ‘safe
systems’ approach promoted by the World Health Organisation (WHO) in their Global Plan for
the Decade of Action for Road Safety 2011-2020.
The safe systems approach is also one of the government’s key priorities for road safety and
is a theme that runs throughout the British Road Safety Statement ‘Working Together to Build
a Safer Road System’.
The approach promotes ‘five pillars’ for delivering and managing road safety as listed below:
• Pillar 1: Road Safety Management
• Pillar 2: Safer Roads and Mobility
• Pillar 3: Safer Vehicles
• Pillar 4: Safer Road Users
• Pillar 5: Post Crash Response
The goal of a safe system is to ensure that collisions do not result in serious human injury by
developing a road transport system that is better able to accommodate human error and take
into consideration the vulnerability of the human body. It recognises that:
• We can never entirely eliminate road collisions because there will always be the potential
for some degree of human error;
• When collisions do occur the human body is inherently vulnerable to death or injury; and
• Because of this, we should manage our infrastructure, vehicles and speeds to reduce
crash energies to levels that can be tolerated by the human body.
In our strategy we have taken into account the national strategic safe system approach and
adapted it to suit the more local needs of the Borough through a wide range of interventions.
The relationships to the ‘five pillars’ are indicated throughout except for Pillar 5, which relates
to post-crash emergency responses and longer term rehabilitation for crash victims and
therefore does form part of this strategy.
Working in partnership {Pillars 1, 2, 3 & 4}
The Borough’s Road Safety activities are delivered through a robust partnership that includes
Solihull Metropolitan Borough Council, West Midlands Police West Midlands Fire Service and
Solihull Advanced Motorists, affiliated to IAM RoadSmart (formerly called the Institute of
Advanced Motorists).
Whilst there is a strong partnership in place we will look to see if there are ways we can
improve partnership working and integration between the different organisations. We
recognise that each of the partners has an essential role to play and will work together to
build on, encourage and develop strong, quality partnership working – playing to the
strengths of the agencies involved and co-ordinating the use of complementary skills.
We also work with other groups, including neighbouring highway authorities, and in
developing our Safer Road Safety Group partnership we will also consider whether other
organisations, such as Highways England, should be invited to take part. Our partnership will
look to work with and respond appropriately to the new ways of working as they emerge.
24Partnership working case study
Multi Agency Vehicle Examinations
On a monthly basis Solihull Metropolitan Borough Council, West Midlands Police and West
Midlands Fire Service work in partnership, together with teams from other organisations, to
carry out a series of co-ordinated checks on vehicles and the occupants. The aim of the
examinations is to reduce crime and road traffic offences, promote road safety and educate
motorists with enforcement action being taken when appropriate.
Each of the individual teams that are invited, listed below, all have different powers, access to
different systems and provide differing levels of enforcement or education when it comes to
road safety.
• West Midlands Police – have the power to stop vehicles providing certain criteria are met
and, if appropriate, take enforcement action for traffic offences.
• West Midlands Fire Service Road Traffic Casualty Reduction Team – educate those that are
committing road traffic offences such as not wearing seat belts and incorrect child safety
seats / booster seats.
• Solihull Metropolitan Borough Council Licensing Team – have the power to inspect any
taxi, private hire vehicle or Hackney carriage and take action if the vehicle is not road
worthy. This may include suspending the driver or even revoking the driver’s taxi license
depending on the severity of the issue.
• Solihull Metropolitan Borough Council Trading Standards – have powers in relation to
overweight vehicles and can escort any vehicle that is suspected of being overweight to a
nearby weigh bridge for inspection. The team also inspect child safety seats to ensure
they meet all the current regulations around safety.
• DVSA (Driver & Vehicle Standards Agency) – have a team of officers who will carry out
vehicle inspections and issue prohibitions on vehicles that are not road worthy.
• DVLA (Driver & Vehicle Licensing Agency) – responsible for ensuring that vehicles are
licenced. A large number of motorists that drive vehicles without vehicle licences do not
25have insurance cover to drive the vehicle either.
• Her Majesty’s Revenue and Customs Officers – check vehicles to ensure they are using the
correct fuel and not evading any duty by using red diesel.
• Her Majesty’s Courts Warrants Officers – have details about people convicted at court, and
have subsequently not paid a fine with powers to arrest any individual that has not and
will not pay their fine.
• Immigration Enforcement Officer – have information to conduct citizenship status checks
on both EU and non-EU citizens to establish if a motorist is residing in the country
illegally.
Smarter data analysis {Pillars 1, 2 & 4}
The system
Analysis of road traffic collisions and those involved is an essential part of our strategy to
reduce road traffic casualties.
To analyse road traffic collisions at the moment we use a web based geographical information
system called Spectrum, which is supported by the West Midlands local authorities. The
system is maintained on their behalf by a consultancy under an agreement that runs until 1st
April 2018.
As that agreement comes to an end we propose to work with the West Midlands Combined
Authority to review the various collision analysis systems that are available to ensure that we
have the most effective and efficient system in place.
How we use data
Effective road safety planning depends on reliable evidence of the real problems, and
identification of both long and short term trends. We need to understand when and where
collisions occur, who is involved and what the consequences are. We will increasingly make
use of more sophisticated approaches to help us understand what groups are most at risk
and also how socio-demographic and lifestyle factors contribute.
Our studies need to take account of the greatly reduced number of road traffic casualties in
Solihull, particularly those who are killed and seriously injured, and the resources available
for road safety analysis. We also wish to have periodic reviews and a flexible response to
developing collision types, trends and hot topics that are identified through the data led
analysis.
To help us establish any emerging collision locations or routes we will, every two years, carry
out a study of all the road traffic collisions that have resulted in a person being injured and
all known collision “hot spots” in the Borough. Appendix 2 illustrates the outcomes from the
2016 study. As a result of those studies the difficult task of prioritising the locations for safety
improvement projects will be determined and considered for funding along with other
highway improvement projects.
In the interim years we will carry out studies that are tailored to identifying our highest risk
groups and road users as well as providing information about collisions on differing road
types and environments which will help target our activities to maximise the reduction in
casualties.
Fatal Collisions
Fortunately there are now very few fatal road traffic collisions in Solihull. However, when they
do occur we will work with the Police to investigate the circumstances and, if possible reduce
the likelihood of another similar incident.
26To help in those fatal collision investigations we will follow the protocol agreed between the
Police and the West Midlands local highway authorities which sets out the joint working
practices and procedures. The aim of this process is to: -
• Provide a detailed report of the highways infrastructure at the collision location.
• Identify any opportunities to improve road safety at the collision location.
• Improve communications between West Midlands Police and the relative highways
authority.
The police make arrangements with the relevant highway authority with the aim of jointly
attending the fatal collision scene within 10 days. The site meeting is used to discuss the
individual nature of the collision, the environment and any other relevant factors that may
have had a bearing on the incident. The highway authority will then prepare a written report
on the collision environment, which will be a part of the overall investigation.
Monitoring and Evaluation
Monitoring and evaluating our projects will help us assess how well we are doing and aid
continuous improvement. It is about asking what has happened, what has worked and what
has not worked. To monitor the impact of programmes our evaluation will include changes in
behaviour, attitudes, knowledge and/or skills. The knowledge we gain will enable us to create
more effective programmes in the future and to spend money in the best way.
Monitoring the progress and effectiveness of road safety programmes, whether engineering or
education measures, will be an integral part of a scheme or project. Whilst costs and outputs
are relatively straightforward to monitor, evaluating the impacts for individual programmes
can be more difficult. For instance, a particular campaign targeting local young drivers may
have a measureable impact if this was the sole intervention but in practice there will be a
number of other influences all taking place at the same time.
Behaviour Change {Pillar 4}
Research has shown that the most common techniques currently employed in road safety
education are associated with identifying risky behaviour and its consequences with most
interventions based on providing information.
They typically provide general information about the link between a target behaviour and the
adverse outcomes that might happen, such as greater risk of being hit by a car if you use a
mobile phone while crossing the road.
Increasingly we need to design programmes based on psychological behavioural change
techniques. There are many factors involved in developing these programmes including
encouraging people to think of themselves as a role model who should set a good example
and contemplate what others, their peers, think about the risky behaviour.
We will look to develop programmes that address the ‘Fatal 4’: excess speed, use of mobile
phones / electronic devices, failure to wear a seatbelt and drink or drugs.
Driver distraction is an issue that we will particularly want to address. Distraction associated
with the use of mobile phones is well known and recently has received a lot of publicity.
However, there are many other activities that drivers perform without realising that they are
not paying full attention to their driving and we will work through our partnership to raise
awareness of these problems.
27Behaviour change case study
How Safe Are You?
Awarded the prestigious Prince Michael International Road Safety Award, the ‘How Safe Are
You?’ initiative is a behaviour change programme aimed at Year 7 pupils travelling to
secondary school for the first time and has been running in Solihull since 2012. The core of
the initiative encourages youngsters to make eye contact with drivers before they step into a
road. The initiative also challenges the notion pupils may have that drivers are always
responsible for pedestrian collisions or that drivers always notice pedestrians and cyclists.
These pupils are often taken to and collected from primary school by their parents, but now
travel alone or with friends for the first time. It has been found that these pupils are more
likely to show risky behaviour on their journey to and from school, such as using their phones,
listening to music or generally chatting with friends instead of taking the time to look
properly when crossing roads. Statistics show that they are more at risk of being involved in a
road traffic collision during this transition from primary to secondary school.
This initiative stands out against the often shock tactics for road safety campaigns; instead it
targets the behaviour of young pupils which has a lasting positive effect. The presentation has
been professionally developed in conjunction with a behavioural psychologist and based on
statistical evidence. It is designed to promote behavioural change with students being
encouraged to develop their own opinions.
Recently the ‘How Safe Are You?’ year 7 programme has been complemented by the
introduction of another school transition project, ‘On the Move!’, aimed at helping children in
year 6, their last year of primary school, plan how they will travel to secondary school.
These programmes have been very successful in reducing road traffic casualties for this age
group and the intention is to continue delivering them to schools across the Borough.
Communication {Pillar 4}
The strategy
We will work to develop a broad based Communication Strategy which will recognise that our
communications need to be tailored to the target audience and deliver the right message, at
the right time and in the right way. To help us with this work we will collaborate with our
specialist communications teams.
We recognise that social marketing can be a very powerful part of behaviour change
programmes having a very influential impact on certain groups and we will aim to make better
use of these techniques. The strategy will help deliver that improvement by encouraging a
joined-up approach to communications that actively looks for opportunities to make the best
use of the media and emerging technology to deliver our messages and influence behaviours.
We will also make use of and support Department for Transport national ‘Think’ road safety
messages and publicity particularly when they align with ‘our challenges’.
Changing perceptions
The risk of being involved in a fatal or serious road traffic collision is far lower now than at
any since the 1930’s. However with the enormous increase in traffic, the general perception
seems to be that the risk of injury has increased in recent years. The risk in real terms is far
lower now but those perceptions of risk can deter people from walking and cycling. Our
communication strategy will also aim to dispel some of those perceptions and act as a
mechanism to co-ordinate with the work carried out by Solihull’s Sustainable Travel Team.
28Highway Maintenance {Pillars 1 & 2}
Resistance to skidding
It is important that road surfaces reaching the end of their serviceable skidding resistance are
detected and that appropriate action is taken.
To ensure that happens we will follow the West Midlands Skid Resistance Strategy. The aim of
the strategy is to provide guidance to ensure that the road surface provides adequate skid
resistance to drivers during wet conditions and to target maintenance to reduce related
collisions.
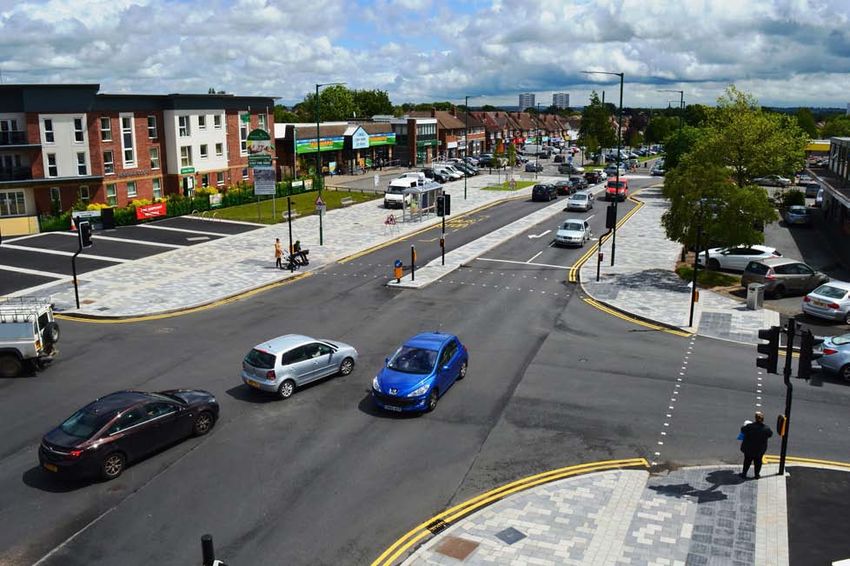
Road safety opportunities
When roads are being resurfaced there is an excellent opportunity, particularly with larger
schemes, to make changes to the road layout and to reallocate road space without any
significant additional cost. The existing carriageway markings do not need to be removed
which not only avoids unsightly and confusing scarring from the previous markings but also
saves money. The new surface also presents an opportunity to use contrasting aggregates to
create an impression of narrower running lanes which can help towards reducing traffic
speeds and providing space for cyclists.
The roads on the annual resurfacing programme will be reviewed and checked against the
injury collision data to see if there are any safety improvements that can be made. Where
there is no evidence of a historic road safety issue, the road will still be reviewed to see if
there are any opportunities to help vulnerable road users or promote cycling and walking.
Managing highway maintenance (Asset management)
We take an asset management led approach to highway maintenance which is aimed at
obtaining the optimum life from all our highway assets and ensuring that performance
requirements are met. The method is aimed at providing value for money by targeting and
timing maintenance programmes, including preventative maintenance, to improve skid
resistance and prolong the life of existing road surfaces.
Potholes
Potholes and other uneven road surfaces such as manhole covers are a potential factor in
collisions and can be particularly hazardous for people on bicycles or motorcycles. There are
systems in place to repair critical areas as quickly as possible and we will review this from
time to time to make sure that our surfacing programme keeps the number of potholes that
occur to an absolute minimum. The reviews will help us make sure that we are making best
use of any new materials and technologies used to repair potholes and reduce the risk of
them reoccurring. Similarly we will work with contractors to monitor the market for new road
resurfacing materials which are more enduring, to minimise the likelihood of potholes
forming, and have a durable skidding resistance.
29Street lighting Street Lighting is a highly visible and vital part of the street scene and has an important role to play in road safety. Information published by the Royal Society for the Prevention of Accidents in August 2015 recognises that the period between 7pm and 8am accounts for only 25% of all travel by car drivers but makes up 40% of car drivers’ fatal and serious injuries. The report mentions that pedestrians and vulnerable road users suffer from decreased visibility in the dark and ways of reducing risk to road users during those hours must be found. The role that street lighting can play in road safety is recognised in the Street lighting strategy which was published in 2012 and includes an upgrade programme of all street lighting to energy efficient LED technology. This upgrade will improve the lighting characteristics of the Borough’s roads and greatly enhance reliability. The annual energy bill will also be halved without having to resort to switching off any lanterns. Inevitably, road traffic collisions occur that involve items of street furniture such as street lighting columns. For most new lighting schemes on rural roads and on major urban roads, where appropriate, passively safe lamp columns to reduce the risk of injury will be installed. When lighting columns or road signs are damaged in road traffic collisions we will carry out an audit to see if there is a safer location for the column or post where it is less likely to be hit again. Other maintenance We will take measures to ensure we make best possible use of the resources available in the face of hazards caused by flooding as well as snow and icy conditions. We will reduce the risk of flooding by gaining a better understanding of the condition and capacity of our assets and improving them where necessary. We will also treat road and footway surfaces in accordance with our winter maintenance plan to prevent the formation of ice. We will also continue to use powers which impact on road safety such as those to cut back overhanging trees and bushes, as well as removal of illegal signs and abandoned vehicles. 30
Road Design {Pillars 1 & 2}
New developments
When assessing the highway safety implications of new developments, developers will be
required to meet and be guided by local and national policy.

In national policy terms, this means the National Planning Policy Framework and specifically
paragraph 32 which states:

“All developments that generate significant amounts of movement should be supported by a
Transport Statement or Transport Assessment. Plans and decisions should take account of
whether:

•    the opportunities for sustainable transport modes have been taken up depending on the
     nature and location of the site, to reduce the need for major transport infrastructure;
•    safe and suitable access to the site can be achieved for all people; and
•    improvements can be undertaken within the transport network that cost effectively limit
     the significant impacts of the development. Development should only be prevented or
     refused on transport grounds where the residual cumulative impacts of development are
     severe.”

Although the National Planning Policy Framework introduces a ‘severe harm’ test to refuse
development, it is clear that maintaining ‘safe and suitable’ access into site will continue to
be an important consideration in determining planning applications.

In local policy terms, this means Solihull Local Plan and specifically Policy P8 which states:

“All development proposals should have regard to transport efficiency and highway safety: -

•    Development will not be permitted which results in a significant increase in delay to
     vehicles, pedestrians or cyclists or a reduction in safety for any users of the highway or
     other transport network;
•    Travel demands associated with development should be managed to minimise detrimental
     impact to the efficiency of the highway network;
•    Ensure new development reduces the need to travel e.g. by promoting linked trips and
     encouraging mixed use development where appropriate;
•    Provision for parking and servicing will be required in accordance with a Supplementary
     Planning Document on managing travel demands associated with development.”

In assessing the safety implications of new development, developers will be required to take
an evidence based approach that considers local context and expected average trip demand
levels by all modes. This should consider pedestrian and cycle access to the development and
forecast traffic and parking generation.

Highway Improvement Schemes
When road improvement schemes are being considered, whatever the aim of the scheme, we
will investigate the collision record as part of the design process and, where possible, address
any safety issues. We will also consider whether it is possible to help vulnerable road users or
promote cycling and walking including measures that can help to control traffic.

Accepting that the feasibility of each location has to be assessed on its own merits, we will
aim to follow the Chartered Institution of Highways and Transportation advice and good
practice guide Street Design for All and the Department for Transport guidance Manual for
Streets 2 (or subsequent revisions). Within that context we will seek to maximise
opportunities to deliver high quality public realm in new future developments and major

31
You can also read