A Rough Google Earth Guide
←
→
Page content transcription
If your browser does not render page correctly, please read the page content below
A Rough Google Earth Guide

                                                                          November 2008

Reproduced from the Mercy Corps supported dissertation of Janet Crossley, M.Sc. in
Geographical Information Science by Research Dissertation, the University of Edinburgh,
(2008): Google Earth as a geospatial tool for development organizations: mapping climate
change vulnerability.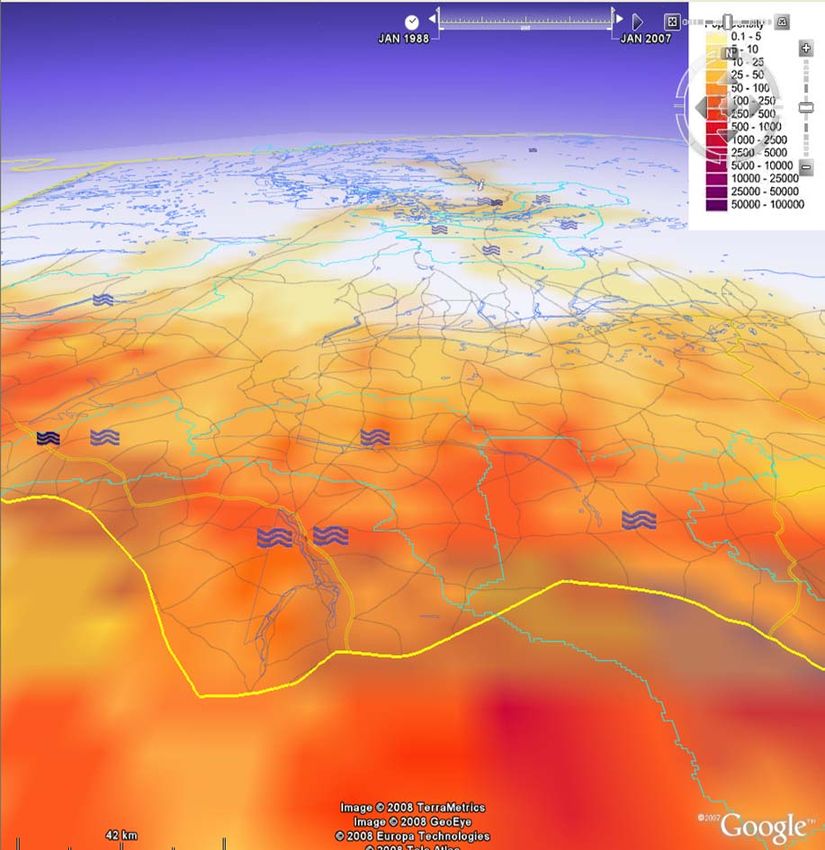
A Rough Guide to Google Earth

   Table of Contents
   I. Introduction                                                3
   II. Google Earth Features                                      4
        What is Google Earth?                                     ..
        Using This Guide                                          ..
   III. Personalizing Information                                 5
        Saving Files                                              ..
        User Features                                             ..
           Placemark                                              ..
           Paths                                                  ..
           Polygons                                               ..
           Image Overlay                                          7
        Attaching Text                                            8
        Transparency                                              ..
        Importing Data                                            ..
        Cartography                                               9
        Printing Maps                                             ..
   IV. Applications, Costs and Case Studies                      11
        Potential Applications and Costs                          ..
        Malaria Atlas Project (MAP)                               ..
        Jane Goodall Institute                                   12
        UNEP                                                      ..
        WaterAid                                                 13
        Climate Change Vulnerability Mapping                      ..
   V. Dealing with Spatial Information                           15
        Accuracy, Precision and Resolution                        ..
        Georeferencing                                            ..
        Issues                                                   16
        Metadata                                                  ..
   VI. Going Further with Google Earth                           18
        Editing KML                                               ..
        Time                                                      ..
        Regions and Levels of Detail                              ..
        Screen Overlays                                          19
   VII. References and Further Information                       21
        Google Earth and the Non-Profit Sector                    ..
        Google Earth Technical References                         ..
        General Mapping and Geographic Information Science        ..
        Useful Sources of Geographic Data                        22
   mercycorps.org                                            1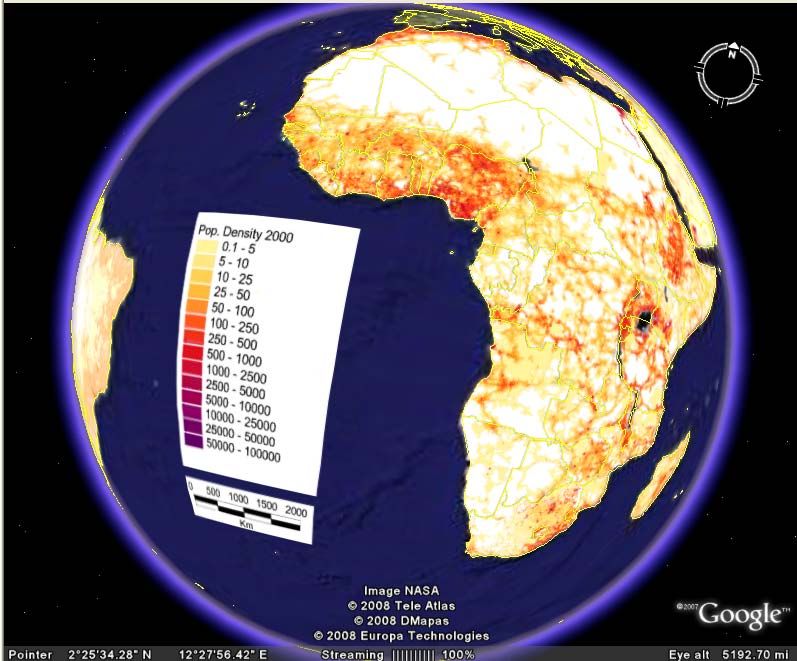
A Rough Guide to Google Earth
List of Figures
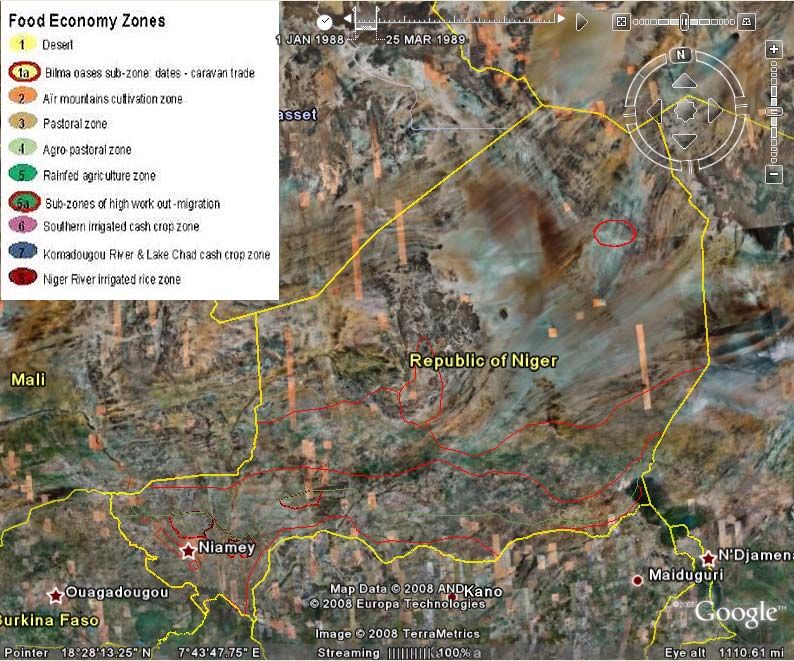
Figure 1: Niger Livelihood Zones and Administrative Borders 6
A. Polygons drawn properly
B. Polygons in outline only
Figure 2: UNEP/GRID Population Density as Image Overlay 7
Figure 3: A Topographic Map of Rwanda 8
Figure 4: Possible Map Symbols 9
Figure 5: Niger Roads and River Paths and Administrative Polygons 10
A. Color image
B. Black and white image
Figure 6: Niger Roads and River Paths and Administrative Polygons 11
A. Survey Placemarks by year
B. The limits of Pf Malaria as seen in Image Overlay
Figure 7: UNEP Atlas of Our Changing Environment Showing Sudan Satellite Imagery 12
Figure 8: WaterAid Placemark of a Project in Nepal 13
Figure 9: Niger Climate Change Vulnerability Maps 14
A. Combined data o flood events recorded in 1980-2000 and 2007 with a population
density Image Overlay to determine how many people might be affected by similar
flooding
B. A MAP project map combined with regional poverty statistics to gauge how expansion
of endemic malaria might affect Niger’s poor
Figure 10: Error in Livelihoods Zone Polygon Locations Displayed in Google Maps 15
Figure 11: Simple Cylindrical or Lat/Lon WGS84 Projection Used in Google Earth 16
Figure 12: Representation of Google Earth’s Region and Level of Detail Features 19
2 mercycorps.org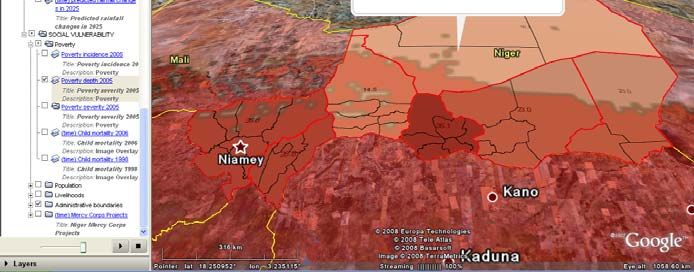
A Rough Guide to Google Earth

   I. INTRODUCTION
   What is Google Earth?
   Google Earth is a virtual globe program, allowing viewers to visualize data on top of displayed
   satellite images of the Earth’s surface. Launched in 2005 and released to the public in 2006, Google
   Earth fast became a household name hailed as a revolution for humanitarian development, much as
   Geographic Information Systems (GIS) were several decades ago. According to MapAction,
     “There seem at present to be two distinct groups of humanitarian practitioners: those who are
       already, albeit tentatively, exploiting Google Earth and related geospatial methods in their
       work, and those who will be, as soon as they see their first demonstration of its potential.”
                                                                                       (MapAction, 2008: 9)
   As a geospatial program installed on the computer, Google Earth users have access to detailed
   imagery constantly downloaded, as different areas are panned or zoomed. It is possible to use
   Google Earth without an internet connection, but functionality is limited to low resolution satellite
   imagery, imagery cached on the computer from recent use, and locally saved KML (Keyhold Markup
   Language) files.
   Google started the ‘Google Earth Outreach’ program in 2007 to help US and Europe-based non-
   profit organizations use Google Earth and Maps in their work. This program provides tutorials and
   case studies online, granting Google Earth Pro licenses to qualifying organizations interested in using
   Google Earth.
   Using This Guide
   There are currently several versions of Google Earth offered, ranging from a free Basic, to a
   Professional version available for US$400. This guide is designed for those who are using Google
   Earth Basic 4.2 for PC, and some notes may not apply to Plus/Pro or later free versions with
   improved features. It brings together detailed and reliable accounts of Google Earth features and
   issues as found across the internet. Sections I – IV are for the curious, reviewing program potential,
   pro’s and con’s, and providing an overview of how some organizations are starting to use it. Sections
   V – VII are for the convinced, including hints and tips, computer mapping concepts, and links to more
   information and data.

   mercycorps.org                                                     3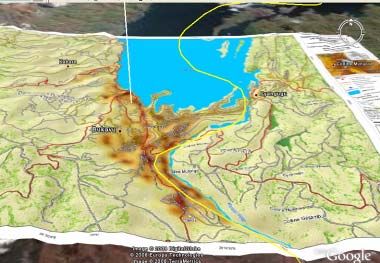
A Rough Guide to Google Earth

   II. GOOGLE EARTH FEATURES
   Base Imagery
   Google Earth compiles base layer imagery from satellite and aerial photography data sources. As
   sources range from one to three years old, there is some variation in quality of images and some
   areas may appear blurry, discolored, or covered in clouds. Generally, there is high-resolution imagery
   for populated areas, for example cities in the USA, and less quality images for less populated regions,
   for example the middle of the Egyptian Desert. Some remote areas, however, have high-level detail,
   while some urban centers do not, depending on the availability of images. Zooming in and out
   increases or decreases the level of feature details on a landscape. Where data are out of date, some
   feature details, including villages and small roads, may be missing or spatially inaccurate.
   Layers
   Google Earth uses a Layers feature to superimpose details of interest, for example Roads, Borders,
   Populated Places, Terrain, etc., onto base imagery. Google Earth also provides layer options for such
   features as current Weather, Conditions and Forecasts, Traffic patterns, and Places of Interest.
   Layers features can be turned on and off in the Layers panel (lower left menu).
   The Terrain Layers feature adds elevation data to Google Earth imagery, giving a 3D impression of
   the landscape. Elevation exaggeration can be altered in Tools > Options > 3D View. Google Earth
   bases their 3D imagery on digital elevation model (DEM) data collected by NASA’s Shuttle Radar
   Topography Mission.
   Tools
   The Ruler tool (icon found in the panel along the top of the image screen) allows users to measure
   the distance between two points or along a path. It is the only analysis tool available in Basic Google
   Earth. There are more measurement tools available in professional versions.

   4                                                   mercycorps.org
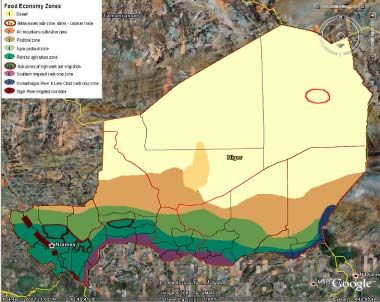
A Rough Guide to Google Earth

   III. PERSONALIZING INFORMATION
   Saving Files
   Google Earth saves files as KML or KMZ (zipped or compressed KML) files. Each file may contain,
   or link to, different combinations of user features. KML files are better for simple files with no
   attached images or features, while KMZ files manage and compress complex files with attached
   images, making them easier to share. KML files linked to other features such as Image Overlays (see
   User Features, below), photos in description balloons, and custom icons, incorporate these features
   into a KMZ file ‘wrapper’. Each linked feature increases the size of the file, which can rapidly
   become too large to share via email.
   It is possible to insert time information into KML files, telling Google Earth at what moment
   (TimeStamp), or over what period (TimeSpan), particular features should be visible. If a KML file is
   time-enabled, then a time slider will appear in the top right corner of the display. Feature visibility is
   controlled by adjusting the active time range, or playing through the timeline as an animation. The
   current Google Earth User interface does not allow editing of time information, but files saved as
   KML can be edited using a text editor (see §VI: Editing KML).
   Files not saved as KML or KMZ can be stored in My Places in the Places panel (middle left menu).
   Users can sort information, including basic user features, in My Places as in other desktop filing
   systems, by creating folders, dragging and dropping, cutting and pasting. Right clicking allows a file
   to be Renamed, Deleted, or Edited. Unlike KML or KMZ files, files stored in My Places are not
   easily accessible to move or share unless Google Earth is launched.
   User Features
   There are four types of basic user feature in Google Earth: (1) Placemarks, (2) Paths, (3) Polygons,
   and (4) Image Overlays (icons found in the panel along the top of the image screen).
   A Placemark is a single point with an identifying label. Clicking the icon provides users with a
   movable yellow pushpin to place on their identified location, and a dialogue box to enter Name and
   Description. Personalization options allow users to alter Altitude, Coordinates, Style, and Color.
   Custom icons can be selected to replace the pushpin, and adapted for Size, Color, and Transparency.
   The only aspect that cannot be personalized is the position of the text relative to the Placemark.
   A Path is a line made up of several points, generally used for roads, rivers, trails, or boundaries. It is
   drawn and edited similar to a Placemark, with option to change Color, Width, and Transparency. No
   options for custom line patterns exist. Mistakes are undone by right clicking on the Path. With Path,
   width remains the same regardless of the level of zoom. If confusing to view on screen, another
   option exists by using Regions (see §VI: Regions and Levels of Detail), but it is not as user friendly.
   A Polygon is a shape defined by several points, and is created and edited in the same way as a Path.
   Polygons can be either filled or outlined, with personalized color options (see Figure 1-A). At
   creation, in the dialogue box it is necessary to specify how the polygon relates to the landscape
   (ground level, or a fixed elevation at sea level or above ground).
   While Polygons are for displaying spatial information, Google Earth does not support them well. It
   is difficult to get different Polygon layers to display in the correct overlapping order, and, where
   altitude is specified, base imagery sometimes shows through. If the screen or graphics card of the
   computer is small, then clamped filled polygons are displayed as outlines only (see Figure 1-B). It is
   also difficult to work with attribute data as is possible with other ‘proper’ GIS programs, for Google
   Earth shows all information, or none at all. These issues may be solved in future releases of Google
   Earth (MapAction 2008).
   mercycorps.org                                                       5
A Rough Guide to Google Earth

   Figure 1: Niger Livelihood Zones and Administrative Borders

             A. Polygons drawn properly

             B. Polygons in outline only
                                     Source: FEWSNET livelihood zone and SALB border shapefiles converted to KML

   6                                                     mercycorps.org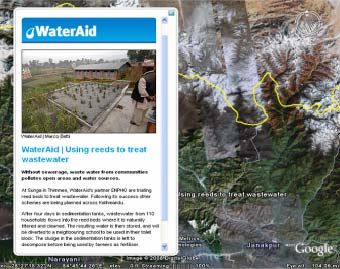
A Rough Guide to Google Earth

   An Image Overlay is a graphic or map layered on top of the base imagery. This is useful to combine
   existing public maps with other information about an area, or incorporate GIS data. Creation of
   Image Overlay requires specifying a link with other saved or web-based images. Images can be
   adjusted for Size, Shape, and Location until they overlay the correct area. To correctly line up with
   Google Earth imagery, overlayed maps and other images must be aligned to North and be in the
   same WGS84 projection (see §V: Georeferencing). Misalignment is more noticeable with larger areas.
   When using PNG (Portable Network Graphics) images, it is possible to set some areas as
   Transparent using a graphics program like Photoshop, before loading them into Google Earth. This
   is both effective and allows unnecessary parts to be removed that might distract from important
   information (see Figure 2). Overlaid images can also be combined with the 3D Terrain function (see
   Figure 3). Note, however, that Image Overlays are memory intensive, and images larger than 2000 x
   2000 pixels will reduce the performance of Google Earth.
Figure 2: UNEP/Grid Population Density Data Imagery

           Data imagery applied as an Image Overlay with transparent regions
                            Source: Andy Nelson, UNEP/GRID Sioux Falls (2004) Population Density for Africa in 2000,
                                         http://www.na.unep.net/ms_demo2/population/metadata/afpopd00.png

   mercycorps.org                                                           7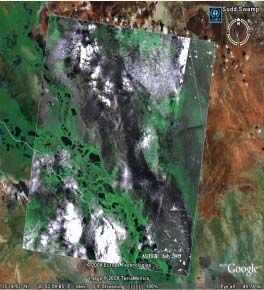
A Rough Guide to Google Earth

   Figure 3: A Topographic Map of Rwanda

             Image Overlay over 3D terrain
                                                      Source: RESPOND-SERTIT (2006) Rwanda and Congo Reference
                                                              topographic map with general population distribution
                                             http://respond-int.org/respondlive/viewmapdetails.html?map_id=671

   Attaching Text
   Text can be attached to all of Google Earth user features in Description. This information can then
   be accessed either by clicking on the shape (for Placemarks), or on the description in the My Places
   folder (for Paths, Polygons, and Image Overlays). The Description balloon can include text, images,
   basic html tables and web blinks, and can be formatted using html tags (e.g., bold,
   italic, underline) to make it more attractive and readable (see §VII: WaterAid).
   Transparency
   The Transparency function in Google Earth allows users to explore the relationships between
   different layers of information. A slider found at the bottom of the Places panel adjusts the level of
   transparency of selected Placemarks, Paths, Polygons, Image Overlays, or the contents of folders.
   Importing Data
   Other geographic data types are available to work with in Google Earth. The most common is ESRI
   shapefile, used by ArcGIS software. Conversion between shapefiles and KML is straightforward and
   getting easier as KML is now approved by the Open GeoSpatial Consortium as an open standard.
   An online conversion tool for KML, shapefiles, and MapInfo files, is available at
   http://geoconverter.hsr.ch. This tool also performs projection transformations. The free GIS
   software MapWindow has another conversion extension available to buy called Shape2Earth, which
   is not as straightforward. GPS data can be converted using an online GPS Visualizer tool, found at
   http://www.gpsvisualizer.com/map?form=googleearth. If many Placemarks are used that need to
   have a similarly formatted balloon image, text and links, a tool called Spreadsheet Mapper 2.0 is
   available at http://earth.google.com/outreach/tutorial_mapper.html. Spreadsheet Mapper offers six
   different balloon templates and up to 400 Placemarks, publishable directly from a single spreadsheet.
   A Google account is required to download and use this tool.
   8                                                  mercycorps.org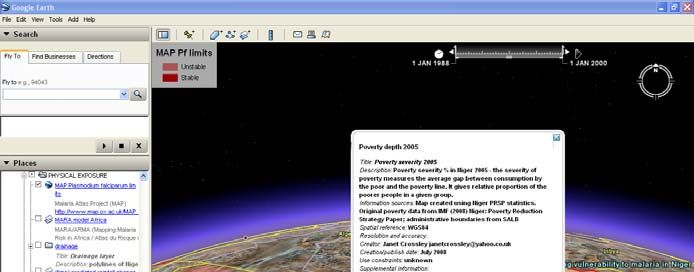
A Rough Guide to Google Earth

   Cartography
   Cartographic techniques are limited to those available in Google Earth. Dotted lines, patterned
   Polygons, and forms of shading are not possible. Many alternatives to automatic yellow pushpins
   and other symbols, however, are available, and can improve the presentation and interpretation of
   maps and KML files. Computer mapping enables easy adaptation of symbols and features according
   to use and presentation. Symbols can be created, saved as PNG files, and given transparent
   backgrounds in Photoshop or other programs, to make them more effective and readable. To
   facilitate quick understanding and comprehension of information, it is best if symbols conform to
   generally accepted mapping conversions (blue water, green forests, etc.). Potentially useful symbols,
   based on OCHA mapping guidelines (2006), are included in Figure 4.
                                      Source: OCHA (2006) OCHA Map Construction Guidelines, Field Style Sheet V1.

   Printing Maps

   Figure 4: Possible Map Symbols
   Symbols based on OCHA guidelines                                                     Climate change symbols

             Capital city             Main road 2                    Job creation                   Drought

             Main city                Local road                     IDPs                           Flooding

                                      International
             Town                                                    Health                         Landslides
                                      border

                                      Water &                        Food & food                    Sea-level
             Village
                                      sanitation                     security                       rise

                                      Environmental
             Main road 1                                             Fisheries                      Malaria
                                      projects

   Google Earth satellite base imagery does not make good non-interactive maps. Many places are hard
   to recognize from above as they are missing much of the ‘human geography’ of the landscape
   (MapAction, 2008). Traditional dark cartographic symbols like those in Figure 4 are difficult to
   distinguish against dark ground colors. One solution is to create more traditional maps by having a
   white Polygon over area of interest, with pertinent features and symbols drawn on the Polygon (see
   Figure 5-A).
   While users of Google Earth can interact with data, turning layers on and off as needed, it is
   important to remember that printed hard copies display all information and can look cluttered and
   confusing if too much information is on one map. Printing in color (see Figure 5-A), versus printing
   or copying in black and white (see Figure 5-B), requires checking to ensure that different symbols are
   distinguishable. When printing in Google Earth it is best to use the [Print Screen] button and paste
   graphics into another program, such as Paint, to ensure that legends or description balloons are
   printed in full. Keeping maps simple and specific is the best and most effective strategy.

   mercycorps.org                                                           9
A Rough Guide to Google Earth
Figure 5: Niger Roads and River Paths and Administrative Polygons
A: Color image
B: Black and white image
Source: Digital Chart of the World and SALB shapefiles converted to KML
10 mercycorps.orgA Rough Guide to Google Earth
IV. APPLICATIONS, COSTS, AND CASE STUDIES
Potential Applications and Costs
Potential GIS applications, according to a Mercy Corps GIS decision-making guide (Steenbergen,
2006), include planning, estimate creation, monitoring and evaluation, public information, and donor
reporting. While Google Earth is not a conventional GIS, with more focus on geovisualisation and
limited spatial analysis capabilities, all GIS applications except ‘estimate creation’ can be done to an
extent with Google Earth. Proper GIS software is required for analysis of relationships between
features and areas, and cost calculations.
Because Google Earth is interactive, fun to use, and looks good, it easily grabs people’s attention. To
promote use of the program, Basic Google Earth is free, and Professional versions are free through
Google Outreach grants. Google Earth basic features are easy and simple to use by a wide audience,
but for anything more sophisticated, a deeper knowledge of KML is needed.
KML is not difficult, but it is time consuming, and hidden costs associated with use and publication
exist (Currion, 2008). KML and KMZ formats are improvements over standard GIS shapefiles, for
both shapes and associated information are sharable. There is an increasing amount of spatial
information available free on the web (see §VII). Google Earth allows users to add to, and annotate,
other people’s maps and information, and to combine separate files into one new KML or KMZ file.
Most of this information, however, is not sophisticated. Collecting detailed data for a specific project
may have high financial (to buy high-resolution data) and time (to take GPS measurements) costs.
The Malaria Atlas Project (MAP) - publishing modeling results and encouraging research
The objective of the Malaria Atlas Project is to develop a detailed model of the spatial limits of
Plasmodium falciparum and P. vivax malaria globally, and where they are endemic. Published KMZ files
on the project website have Image Overlays of model results, as well as time-enabled Placemarks
showing location and dates of parasite rate surveys conducted (see Figure 6). Information provides
users with an understanding of the density observation maps are based upon, and where the data
gaps are.
Figure 6: Niger Roads and River Paths and Administrative Polygons
A. Survey Placemarks by year B. Limits of Pf Malaria as Image Overlay
Source: http://www.map.ox.ac.uk/MAP_data.html
Jane Goodall Institute - aiding participation in conservation planning
mercycorps.org 11A Rough Guide to Google Earth
The Jane Goodall Institute in Mahale Mountains National Park, Tanzania, collects GPS data each
year of park boundaries, streams,
roads, villages, water sources, field
pictures, and chimpanzee
sightings. The Google Earth
Terrain feature makes the hills and
valleys easily recognizable to local
community members with limited
experience using 2D maps, aiding
discussions of land use. The
Greater Mahale Ecosystem KML
was the main tool used to map
villager knowledge of current and
historical elephant movement
paths in the national parks and
Photo Source: Jane Goodall Institute
other nearby habitats, shown in
http://earth.google.com/outreach/cs_jgi_gombe.html
this photo of a villager pointing out chimpanzee habitat.
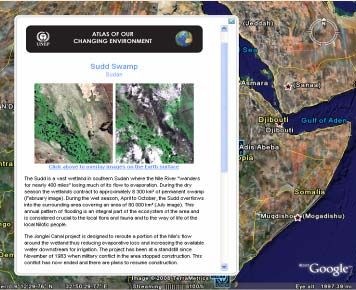
UNEP - environmental advocacy and monitoring of large-scale changes
The United Nations Environmental Program uses Google Earth to circulate images and stories from
its Atlas of Our Changing Environment through the Global Awareness feature in the Layers panel. It
overlays satellite images and aerial photographs to show large-scale environmental changes visible
from space, for example deforestation and lake level changes. UNEP applies images as Overlays,
alongside Placemarks and description bubbles, which tell an image story (see Figure 7).
Figure 7: UNEP Atlas of Our Changing Environment Showing Sudan Satellite Imagery
A. UNEP Placemark showing images B. Sudd Swamp Image Overlay
Source: Google Earth Global Awareness feature > UNEP: Atlas of Our Changing Environment
12 mercycorps.orgA Rough Guide to Google Earth
WaterAid – promoting projects
WaterAid is a Non Governmental Organization (NGO) taking part in Google Outreach with KML
content featured in the Global Awareness feature > WaterAid. WaterAid uses Google Earth as an
awareness-raising tool, publishing Placemarks for featured projects. Description balloons have
images as well as information about each project (see Figure 8).
Figure 8: WaterAid
Placemark of a
Project in Nepal
Source: Google Earth Global Awareness feature > WaterAid
Climate Change Vulnerability Mapping – combining different data
Climate Change Vulnerability Mapping explores ways to map climate change vulnerability using
Google Earth and free internet data. By combining social and environmental data, maps of climate
change vulnerability are constructed, and predictions of future climate change made. Interactive
maps allow users to explore information about an area and look at ‘what if ’ scenarios. They can also
add their own observations and recombine different databases to create different maps. Figure 9
shows two maps of information collected about Niger. One issue with data recombined from
various sources is user confusion. To ensure users understand the various sources, and limitations,
the balloon to the right of Figure 9-B displays the metadata (data about data) for this particular
KML layer.
mercycorps.org 13A Rough Guide to Google Earth
Figure 9: Niger
Climate Change
Vulnerability
Maps
A. Combined data of flood events recorded in 1980-2000 and 2007 with
a population density Image Overlay to determine how many people
might be affected by similar flooding
B. A MAP project map combined with regional poverty statistics to
gauge how expansion of endemic malaria might affect Niger’s poor
14 mercycorps.orgA Rough Guide to Google Earth
V. DEALING WITH SPATIAL INFORMATION
Accuracy, Precision and Resolution
In Google Earth, how close a represented value is to the true value determines accuracy, and the
number of decimal places gauges precision. For example, a coordinate point may be recorded as
either 36.1, or 36.130293, with greater precision in the second coordinate. If the accurate location of
the feature is actually at 41.0, however, then both coordinates are inaccurate.
Google Earth records coordinates at extremely high levels of precision, with 13 decimal places.
While this appears to be more accurate, it is misleading. Issues of inaccuracy are frequent, for
Google Earth is not pegged to one particular scale, as a paper map is, but can zoom in far beyond
the scale at which points were created. The Niger livelihood zones Polygons, for example, appear
accurate when viewed at country-level, the scale at which they were created, but if zoomed in closer,
errors become visible (see Figure 10).
Figure 10: Error in Livelihoods Zone Polygon Locations Displayed in Google Maps
Source: FEWSNET livelihoods zone map manually digitized in KML.
Resolution refers to level of detail. The finer or higher the resolution, the more information is
represented. Display resolution is the density of pixels that compose an image. Spatial resolution is
the size of the smallest detail that can be distinguished. Examples of spatial resolution are pixel size
from satellite imagery, or the size of the smallest discernable feature on a map. Sometimes the level
of detail is obvious. For example, a climate change model showing global results in coarse grids.
Note that the way data are presented can often disguise low-resolution information.
Georeferencing
The Earth is not actually a sphere but a rather lumpy ellipsoid. A datum is a mathematical
simplification of the shape of the Earth, which defines how latitude, longitude, and elevation values
are associated with particular points on the surface of the Earth. There are several versions, but
Google Earth uses WGS84 (the World Geodetic System of 1984).
The way features and information are assigned locations on or near the Earth’s surface is called
Georeferencing. Creating Google Earth features defines spatial positions of points using three
values: latitude (x), longitude (y) and altitude. While this seems straightforward, complicated
technicalities are involved. It is useful to be familiar with these, especially when combining different
spatial data created using different methods.
mercycorps.org 15A Rough Guide to Google Earth
In order to transform the 3D Earth into a 2D map, some distortion of areas, distances, angles, and
directions occurs. A projection is a particular way of compromising to achieve this flattening,
causing particular distortions in particular parts of the world, according to what is least important to
users. Google Earth uses a Simple Cylindrical projection, also known as Lat/Lon WGS84, for its
imagery base. Lat/Lon WGS84 is a map projection where the meridians and parallels are equidistant
straight lines crossing at right angles, and where distortion increases away from the Equator (see
Figure 11). Information created using different projections may not be positioned correctly when
added in Google Earth. It may be possible, however, to re-project Placemarks, Paths and Polygons to
Lat/Lon WGS84 using other software (see §III: Importing Data).
Figure 11: Simple Cylindrical or Lat/Lon WGS84 Projection Used in Google Earth
Source: Google Earth User Guide. (2008) http://earth.google.com/userguide/v4/google_earth_user_guide.pdf
Copyright
According to Google Earth,
“You can personally use an image from the application (for example on your website, on a blog or in
a word document) as long as you preserve the copyrights and attributions including the Google
logo attribution. However, you cannot sell these to others, provide them as part of a service, or use
them in a commercial product such as a book or TV show without first getting a rights clearance
from Google.”
(http://earth.google.com/support/bin/answer.py?answer=21422&topic=1141)
There are large amounts of data, images, and maps available for non-commercial use over the
internet from organizations and institutions including the UN. When using data or images from
other sources in KML/KMZ files, original sources must be fully acknowledged or redistributed
under different levels of Creative Commons licenses. Information is available at
http://creativecommons.org/about/licenses/meet-the-licenses. When in doubt about rules or
copyrighted work, it is best to err on the side of overcautious, and ask.
Metadata
Google Earth and KML/KMZ support sharing of spatially referenced information between
individuals and organizations. As data are shared, however, important information about its source,
quality, age, etc., often gets lost, resulting in unsuitable use. One fear GIS professionals have about
Google Earth is that it will encourage poor practice in managing geospatial data (Currion, 2008).
Maps are often arcane images accorded undue respect and credibility (Monmonier, 1991). Neat
visual effects can mask patchy or misrepresented data and create a misplaced sense of certainty. For
this reason, it is a good idea to create metadata for maps or KML features, so that users will have all
the facts they need to judge a presentation. One way of doing this is including details in a feature’s
Description. A basic html template to create formatted metadata might look like this:
16 mercycorps.orgA Rough Guide to Google Earth
Title: insert title here
Description: insert short description here
Information sources: insert details of data collection and original sources here
Spatial reference: insert datum and projection details here
Resolution and accuracy: insert resolution/accuracy/potential error details here
Creator: insert name and organization here
Creation/publish date: insert date here
Use constraints: insert any instructions about allowed/disallowed use here
Supplemental information: insert other information here
mercycorps.org 17A Rough Guide to Google Earth
VI. GOING FURTHER WITH GOOGLE EARTH
Editing KML
Like HTML and XML, KML has a tag-based structure, with a < > to start and a to end each
section. Google Earth and Google Maps browsers read this structure to display information. A basic
KML file showing one Placemark looks like this:
simple placemark number 1
13.0768120079388,21.3453918072462,0
Additional KML instructions about a feature, for example, Color, Transparency, Time, or
Description, can be added into the KML section after the and before the
tags. The first two lines and the last line are required for the file to be recognized by
Google Earth as KML. It is possible to view and edit raw KML files using TextPad or other free text
editor programs.
Comprehension of KML ‘language’ is not required for most Google Earth applications. For more
advanced actions, however, a working knowledge of the structure of KML enables users to make
changes that are more sophisticated. For example, time elements and regions can be introduced (see
below).
The following sections provide a taste of some basic KML applications. For detailed instructions,
refer to KML tutorials and KML Reference.
Time
One potentially useful feature of Google Earth is that Placemarks, Paths, Polygons, and Image
Overlays can be assigned a time value. This tells Google Earth at what point, or from when, the
information is valid. It is then possible to play through a time sequence to show change, or select
particular periods of time to display. Examples of valid dates include:
• Year 2001
• Month and year 02/2001
• Date and month and year 25/02/2001
Using KML structure, inserting time values looks like these:
insert start date here
or insert date here
insert start date here
Regions and Levels of Detail
Regions allows you to load and display data at defined levels of zoom. Data are only loaded and drawn
when viewable on the screen, a helpful feature with performance of large datasets. Regions also allows
specific levels of detail from different data to be defined (see Figure 12). Fine details are only loaded
when zoom is large enough for them to be visible and make sense. The default values indicating active
18 mercycorps.orgA Rough Guide to Google Earth
to infinite size are -1, or as far as it is possible to zoom in, and 0, or as far as zoom out goes.
Figure 12:
Representation of Google Earth’s Region and Level of Detail Features
Source: Google Earth (2008) KML Reference http://code.google.com/apis/kml/documentation/regions.html
Below is an example of KML structure designating a rectangle just around Niger. When the country
fills the computer screen at 1000 pixels, the roads connecting to this region become visible, increasing
in detail to 1500 pixels.fraction of the screen width/height as the main unit. An example looks like this:
A Rough Guide to Google Earth
Map Legend
A key to the map symbols
http://myserver/myimage.jpg
20 mercycorps.orgA Rough
A Rough
Guide
Guide
to Google
to Google
Earth
Earth
VII. REFERENCES AND FURTHER INFORMATION
Google Earth and the Non-Profit Sector
Currion, P. (2008) Map = Action. http://www.humanitarian.info/2008/04/17/map-action/
Goodchild, M.F. (2008) ‘What does Google Earth mean for the Social Sciences?’ In Dodge, M.,
McDerby, M. and Turner, M., editors, Geographic Visualization. Chichester: John Wiley & Sons
Ltd., 11-23.
Google Earth (2008) Google Earth Outreach Tutorials. http://earth.google.com/outreach/tutorials.html
MapAction (2008) Google Earth and its potential in the humanitarian sector: a briefing paper. 1-10.
http://www.mapaction.org/images/stories/google_earth_and_its_potential_in_the_humanitaria
n_sector.pdf
Pintea, L. (2008) Google Earth Outreach Case Study: Jane Goodall Institute — Conservation in the
Greater Gombe Ecosystem. http://earth.google.com/outreach/cs_jgi_gombe.html
Singh, A., Anthony, M.L. and Pengra, B. (2008) Google Earth Outreach Case Study: UNEP: Atlas of
Our Changing Environment. http://earth.google.com/outreach/cs_unep.html
Steenbergen, R. (2006) Geographic Information Systems: A decision making guide. Mercy Corps,
Portland, Oregon.
WaterAid (2008) WaterAid on Google Earth awareness layer.
http://www.wateraid.org/uk/about_us/newsroom/6540.asp
Google Earth Technical Information:
Google Earth (2008) Google Earth User Guide.
http://earth.google.com/userguide/v4/google_earth_user_guide.pdf
Google Earth (2008) Developer’s Guide: Time and Animation.
http://code.google.com/apis/kml/documentation/time.html
Google Earth (2008) Developer’s Guide: Working with Regions.
http://code.google.com/apis/kml/documentation/regions.html
Google Earth (2008) KML Reference. http://code.google.com/apis/kml/documentation/regions.html
General Mapping and Geographic Information Science
Burrough, P.A. and McDonnell, R.A. (1998) Principles of Geographical Information Systems. Oxford:
OUP.
Longley, P.A., Goodchild, M.F., Maguire, D.J. and Rhind, D.W. (2001) Geographic Information Systems
and Science. Chichester: John Wiley & Sons.
OCHA (2006) OCHA Map Construction Guidelines, Field Style Sheet V1.
http://www.humanitarianinfo.org/IMToolBox/index.html
Monmonier, M. (1991) How to Lie with Maps. Chicago, London: The University of Chicago Press.
mercycorps.org 21A Rough Guide to Google Earth
USGS (2000) Map Projections. http://erg.usgs.gov/isb/pubs/MapProjections/projections.pdf
Useful Sources of Geographic Data
FEWSNET (Food security, livelihoods and drought – satellite images, map images and shapefiles).
http://www.fews.net/pages/default.aspx?l=en
Global Resource Information Database (GRID) – Europe. (Environmental and human-related
datasets). http://www.grid.unep.ch/data/data.php
GRID Arendal Maps and Graphics Library. (Maps and graphics). http://maps.grida.no/
MAP Malaria Atlas Project. (KMZ maps of spatial distribution of malaria and surveys undertaken).
http://www.map.ox.ac.uk/MAP_data.html
King’s College London - Geodata portal. (Environmental change KMZ files).
http://www.kcl.ac.uk/schools/sspp/geography/research/emm/geodata
ReliefWeb Map Centre (Maps created for disaster relief).
http://www.reliefweb.int/rw/rwb.nsf/doc114?OpenForm
RESPOND (maps as pdfs and KML Image Overlays to support humanitarian relief & DRR
activities). http://www.respond-int.org/respondlive/index.html
Digital Chart of the World - Penn State University (Old 1:1,000,000 scale vector world basemap).
http://www.maproom.psu.edu/dcw/
UN Second Administrative Level Boundaries. (Subnational administrative boundaries shapefiles).
http://www.who.int/whosis/database/gis/salb/salb_home.htm
UNEP/GRID Global Risk Data Platform PREVIEW. (Hazard records and risk raster data & images).
http://www.grid.unep.ch/activities/earlywarning/preview/data/index.php
UNEP/GRID Sioux Falls Clearinghouse. (Population data and selected USGS and NASA datasets).
http://www.na.unep.net/datasets/datalist.php
22 mercycorps.orgUnited States Mercy Corps 3015 SW 1st Ave. Portland, OR 97201, USA +1.800.292.3355 tel +1.503.796.6844 fax mercycorps.org United Kingdom Mercy Corps Scotland 17 Claremont Crescent Edinburgh, Scotland, UK, EH7 4HX +44.131.558.9244 tel +44.(0)131.558.8288 fax mercycorps.org.uk mercycorps.org 23
You can also read