A Scenario-Based Assessment to Inform Sustainable Ponderosa Pine Timber Harvest on the Black Hills National Forest - Russell T. Graham, Mike A ...
←
→
Page content transcription
If your browser does not render page correctly, please read the page content below
Forest Service
                                  U.S. DEPARTMENT OF AGRICULTURE

Rocky Mountain Research Station                             RMRS-GTR-422   February 2021

     A Scenario-Based Assessment to Inform
     Sustainable Ponderosa Pine Timber
     Harvest on the Black Hills National Forest
     Russell T. Graham, Mike A. Battaglia, and Theresa B. Jain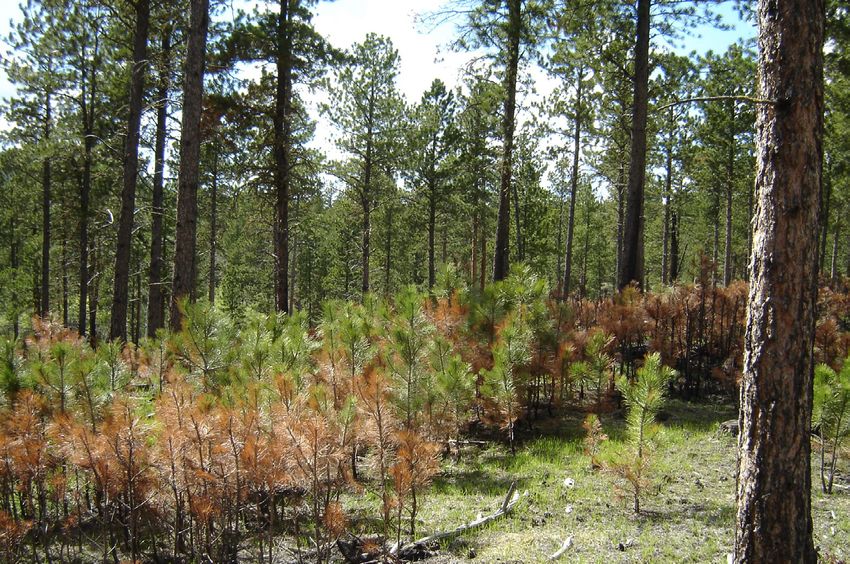
CORRIGENDUM
There was an error in table 7, page 32 of RMRS-GTR-422, published in February 2021.
The value in this table for the growth rate of 2.73%, mortality 1.52%, and harvest level
of 181,000 CCF/yr has been corrected. The incorrect value of -672,999 was changed to
the correct value of -555,559 in July, 2021.
Graham, Russell T.; Battaglia, Mike A.; Jain, Theresa B. 2021. A scenario-based assessment to inform
sustainable ponderosa pine timber harvest on the Black Hills National Forest. Gen. Tech. Rep. RMRS-
GTR-422. Fort Collins, CO: U.S. Department of Agriculture, Forest Service, Rocky Mountain Research
Station. 61 p. https://doi.org/10.2737/RMRS-GTR-422
Abstract
Since 2000, the Black Hills National Forest (BHNF) has experienced several disturbances
that have reduced standing live sawtimber volume which will affect future harvest
levels. To evaluate options concerning the future timber management program, we
conducted a quantitative analysis to determine how mortality from these disturbances
and potential growth rates will impact short-, mid-, and long-term sustainable
sawtimber harvest levels of ponderosa pine (Pinus ponderosa var. scopulorum Dougl.
ex Laws.). In 2019, there was 5,995,428 CCF (hundreds of cubic feet) standing live
ponderosa pine sawtimber within the suitable timberlands. The current harvest level
in the BHNF Forest Plan of 181,000 CCF/yr is not a sustainable option. Over the next
several decades, if mortality rates stay below 1.04%, harvest levels of 72,400 and 90,500
CCF/yr appear to be sustainable if all suitable timberlands are available for harvest.
History shows that allowing the forest to recover after large disturbances provides
opportunities to adjust future harvest levels. Also, tending of young forests can promote
recovery and produce sawtimber volume more quickly.
_____________________________
Keywords: ponderosa pine growth and mortality, disturbance, growth and yield, scenario planning
Cover: Upper left: Ponderosa pine advanced regeneration beneath an overstory that was killed by
mountain pine beetle. (Photo by Russell Graham, Rocky Mountain Research Station, USDA Forest Service)
Upper right: An even-aged ponderosa pine stand that was not impacted by mountain pine beetle. Stands
with this density are still susceptible to mountain pine beetle and limit successful establishment of
ponderosa pine seedlings. These dense stands provide opportunities for future harvests. (Photo by Mike
Battaglia, Rocky Mountain Research Station, USDA Forest Service)
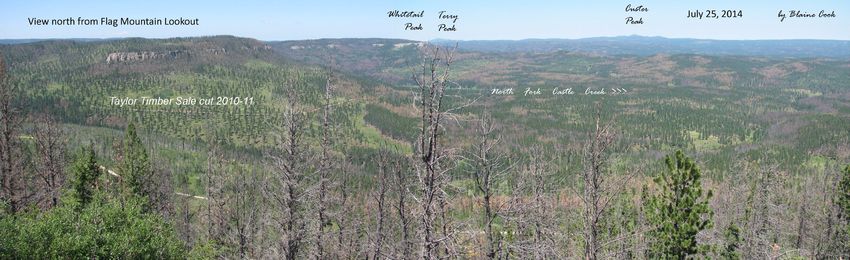
Middle: A landscape view of the Black Hills looking north from Flag Mountain Lookout, Mystic Ranger
District in 2014 showing the widespread impact of mountain pine beetle mortality (orange/brown areas)
in dense forests. Forested stands managed at lower densities demonstrated lower mountain pine beetle
mortality (Taylor Timber Sale). (Photo by Blaine Cook, Black Hills National Forest, USDA Forest Service)
Bottom left: A harvest operation in a ponderosa pine stand on the Black Hills Experimental Forest. (Photo
by Russell Graham, Rocky Mountain Research Station, USDA Forest Service)
Bottom right: Ponderosa pine timber being processed at the Spearfish Forest Products, Inc mill in
Spearfish, SD. (Photo by Mike Battaglia, Rocky Mountain Research Station, USDA Forest Service)
All Rocky Mountain Research Station publications are published by U.S. Forest
Service employees and are in the public domain and available at no cost. Even
though U.S. Forest Service publications are not copyrighted, they are formatted
according to U.S. Department of Agriculture standards and research findings and
formatting cannot be altered in reprints. Altering content or formatting, including
the cover and title page, is strictly prohibited.
The use of trade or firm names in this publication is for reader information and
does not imply endorsement by the U.S. Department of Agriculture of any product
or service.
ii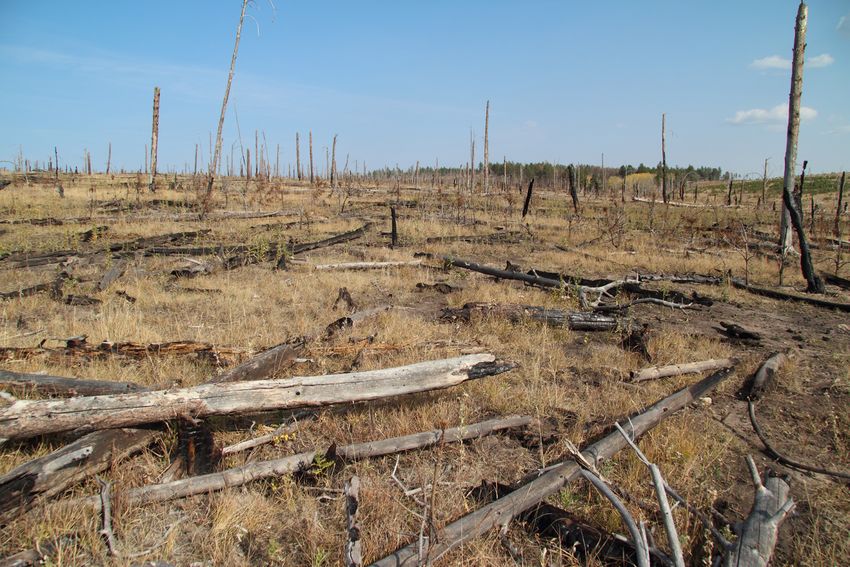
Authors
Russell T. Graham (deceased) was a Research Forester (Silviculturist) with the USDA
Forest Service, Rocky Mountain Research Station, Moscow, Idaho. He started his Forest
Service career in 1966 as a high school student working on the Bear Lodge Ranger
District, Black Hills National Forest. His research activities included studying the role
that coarse woody debris plays in forests, addressing large-scale ecosystem assessment
and planning, describing northern goshawk habitat, and evaluating the impacts of
major wildfires. Russell Graham passed away on August 29, 2020. Russell was leading
our team; in his stead we continued to prepare this report and carry forward his vision
and subsequent legacy.
Mike A. Battaglia is a Research Forester (Silviculturist) with the USDA Forest Service,
Rocky Mountain Research Station, Fort Collins, Colorado. His research focuses on
developing and implementing innovative management strategies to enhance forest
resiliency to disturbances and evaluating the subsequent ecological impacts of these
activities.
Theresa B. Jain is a Research Forester (Silviculturist) with the USDA Forest Service,
Rocky Mountain Research Station, Moscow, Idaho. Her research focuses on developing,
implementing, and evaluating alternative silvicultural systems and methods for
addressing multiple management objectives.
Each of the authors has had a unique familiarity with the Black Hills. Russell Graham
grew up in Sundance, Wyoming, and his first job for the Forest Service was on the Bear
Lodge Ranger District. Russell also supported the Forest Service with his continued
research on the Black Hills producing several notable publications on goshawks, long-
term studies of thinning in ponderosa pine, and mountain pine beetle dynamics. Mike
Battaglia’s Ph.D. work was within the Black Hills; he is currently the Scientist-in-
Charge of the Black Hills Experimental Forest and continues to have an active
partnership with the Black Hills National Forest. During the bark beetle infestation,
Theresa Jain implemented the free selection silvicultural system on the Black Hills
Experimental Forest and worked with Northern Hills Ranger District staff during sale
preparation. Because of this connection to the Black Hills, we were honored to be
approached by the USFS Rocky Mountain Region and Black Hills National Forest to
prepare this report.

Acknowledgments
This report would not have been possible without the valued contribution from
the Northern Research Station Forest Inventory and Analysis (FIA) staff, including
Charles H. (Hobie) Perry, Charles Barnett, Elizabeth Burrill, Dale Gormanson, Mark
Hatfield, Mike Maki, Dacia Meneguzzo, Patrick Miles, Scott Pugh, Paul Sowers, Brian
Walters, James Westfall, and many others. In addition, we would like to thank Blaine
Cook (retired), Jeff Underhill, and Ken Marchand of the Black Hills National Forest
by providing timely answers to our many questions. We appreciate the support we
received from Alison Hill, Research Program Manager for Forest and Woodland
Ecosystems Research Program; Scott Baggett, Station Statistician; Patricia Cohn, Group
Leader of Publishing Services; Frances Smith, Visual Information Specialist of
                                            iii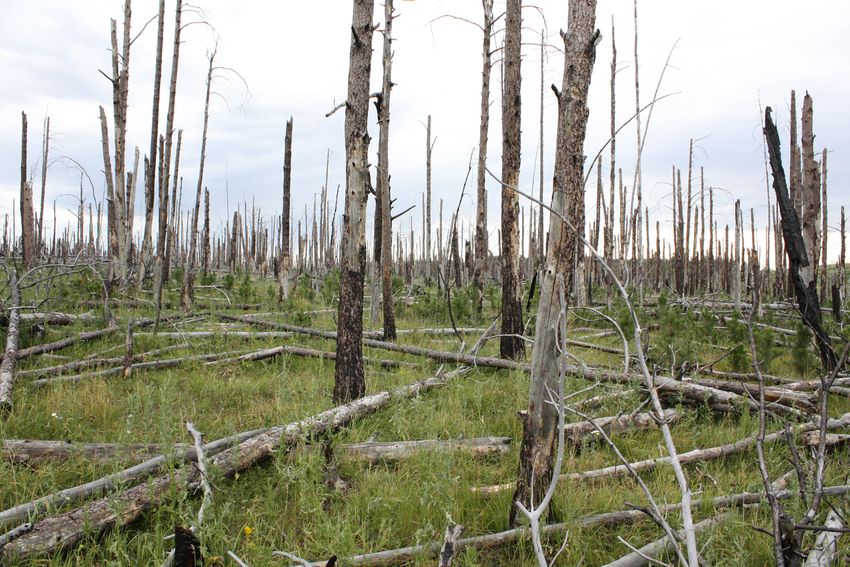
Publishing Services; Jennifer Hayes, Assistant Station Director for Science Application
& Communication; and Lane Eskew for editing the manuscript. In addition to these
individuals, the comments we received from the technical reviewers and the blind
peer reviewers were invaluable during our revision and we appreciate their efforts
in providing a thorough review. We also thank the stakeholders, who depend on the
Black Hills National Forest as a source of their livelihood and is their home, for their
willingness to invest the time to review and comment on our draft report. We used and
appreciated their input and valuable insight during the revision process.

                                           iv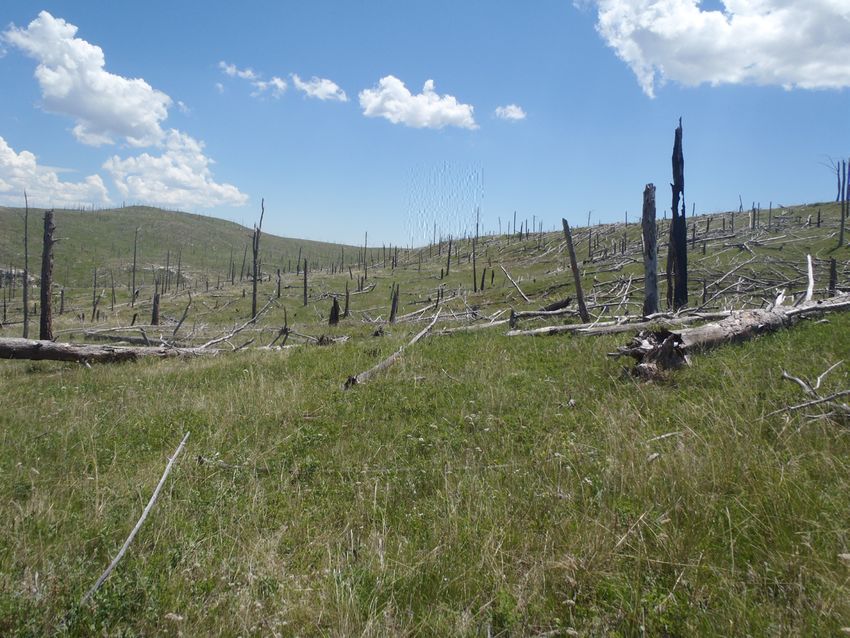
Table of Contents

Executive Summary.................................................................................1
Introduction.............................................................................................2
   The Setting................................................................................................. 2
   Recognizing an Information Need.......................................................... 8
Approach................................................................................................. 11
   Understanding Disturbance and Tree Mortality................................. 11
            Pathogens, Animal Damage, and Weather..................................................... 11
            Mountain Pine Beetle........................................................................................ 12
            Wildfires............................................................................................................... 13
            Mortality Trends Across the Interior West...................................................... 14
   Changing Climate................................................................................... 15
   Assessing Past FIA Reports.................................................................... 18
   Growth, Mortality, Harvests, and Standing Live Tree Inventory
   Over Time................................................................................................. 22
Scenario Development.......................................................................... 27
   Gross Growth Rates................................................................................ 28
   Mortality Rates ....................................................................................... 28
   Harvest Levels ........................................................................................ 29
Scenario Outcomes................................................................................ 30
Moving Forward..................................................................................... 38
   Management Opportunities.................................................................. 39
Conclusion.............................................................................................. 45
References.............................................................................................. 46
Appendix A: Land Area ......................................................................... 56
Appendix B: Expanded Graphs From Figure 13.................................. 58
   Growth Rate 2.33%.................................................................................. 59
   Growth Rate 2.54%.................................................................................. 60
   Growth Rate 2.73%.................................................................................. 61

                                                                      v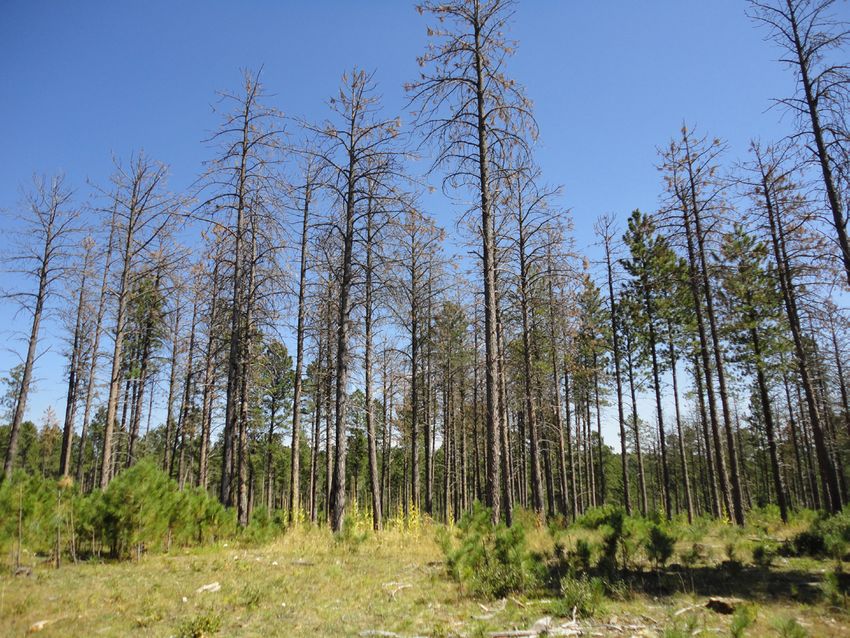
Page intentionally left blank

              vi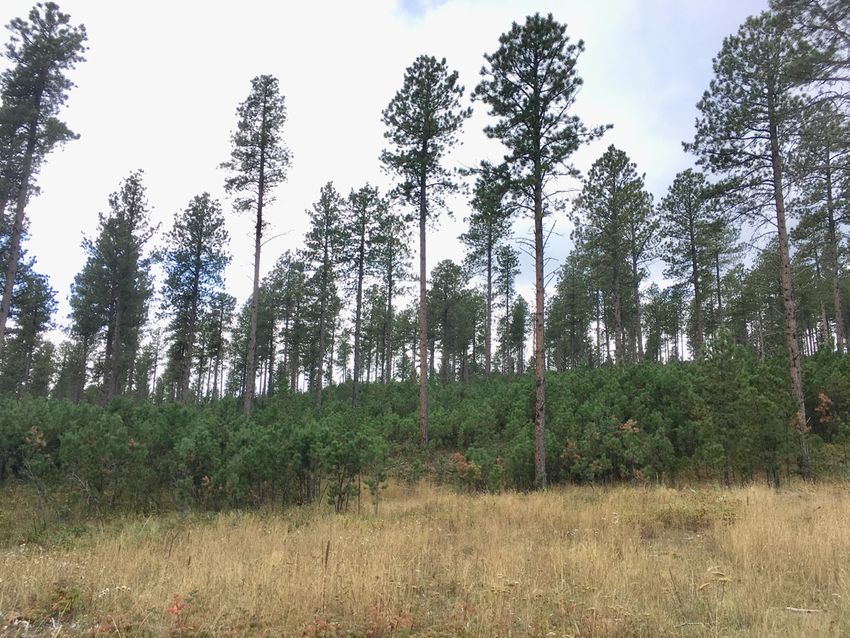
Executive Summary
Since 2000, the Black Hills National Forest (BHNF) has experienced several
disturbances that have reduced standing live sawtimber volume which will
affect future harvest levels. We conducted a quantitative analysis to determine
how mortality from these disturbances and potential growth rates will impact
short-, mid-, and long-term sustainable sawtimber harvest levels of ponderosa
pine (Pinus ponderosa var. scopulorum Dougl. ex Laws.) on the BHNF. More
specifically, we estimated: (1) a sustainable timber harvest now and into the
future, (2) how current harvest levels compare to alternative future harvests,
and (3) the standing live sawtimber inventory volume needed to sustain the
current Forest Plan sawtimber allowable sale quantity (ASQ) of 181,000 CCF/
yr (hundreds of cubic feet). To provide plausible volume growth and mortality
estimates, we: (1) evaluated disturbance related mortality in ponderosa pine
forests within the Black Hills and across the Interior West using past Forest
Inventory and Analysis (FIA) resource bulletins and (2) considered potential
future climate and its influence on disturbance and potential mortality. From
these assessments, 60 scenarios were developed and used to inform future
potential changes (5, 20, and 80 years) in standing live sawtimber volume by
varying degrees of mortality rates, growth rates, and harvest levels.
In 2019, the USDA Forest Service Northern Research Station Forest Inventory
and Analysis (NRS-FIA) estimated that there were 5,995,428 CCF standing
live ponderosa pine sawtimber within the suitable timberlands of the BHNF.
The current harvest level in the BHNF Forest Plan of 181,000 CCF/yr is not a
sustainable option. Sustaining harvest levels of 181,000 CCF/yr with mortality
rates of 0.26% would require standing live sawtimber volumes of 7,327,950
to 8,743,950 CCF, depending on growth rate evaluated. If mortality rates are
0.60% to 1.04%, standing live ponderosa pine sawtimber volumes would
require 8,497,670 to 14,031,000 CCF, respectively. Over the next several
decades, if mortality rates stay below 1.04%, harvest levels of 72,400 and
90,500 CCF/yr appear to be sustainable if all suitable timberlands are available
for harvest. These estimates provide a range of outcomes on the potential to
sustain ponderosa pine sawtimber harvests over 5, 20, and 80 years; however,
monitoring is crucial to obtain realized mortality and growth rates so harvest
levels can be adjusted over time. History shows that allowing the forest to
recover after large disturbances provides opportunities to adjust future harvest
levels. Also, tending of young forests can promote recovery and produce
sawtimber volume more quickly. It is important to understand that the scenario
estimates we reported assume that all the estimated standing live ponderosa
pine sawtimber volume within the suitable timberlands is available for harvest
and does not include other resources that are identified in the 2007 Black Hills
National Forest Land and Resource Management Plan Phase II Amendment.

USDA Forest Service RMRS-GTR-422 2021                                              1
Introduction
            The Setting
            Located on the eastern edge of the Rocky Mountains, the Black Hills, Bear Lodge,
            and Elk Mountains make up the Black Hills region, which are isolated mountain
            ranges surrounded by the Great Plains of the United States. Over two-thirds of
            the Black Hills are in southwestern South Dakota, while the neighboring Bear
            Lodge Mountains and remaining areas are in northeastern Wyoming. These
            mountains, collectively referred to as the “Black Hills,” have a total land base
            of about 6,000 square miles: about 125 miles from north to south and about 60
            miles from east to west (fig. 1). Across this large area, elevations range from
            3,800 feet to 7,244 feet with distinct geomorphologic features that influence
            soils, site productivity, and vegetation. Although nearly 1.5 million acres of the
            area are dominated by ponderosa pine (Pinus ponderosa var. scopulorum Dougl.
            ex Laws.) forests (fig. 2), white spruce (Picea glauca (Moench) Voss), quaking
            aspen (Populus tremuloides Michx.), along with isolated lodgepole pine (Pinus
            contorta Douglas ex Loudon var. latifolia (Engelm.) and limber pine (Pinus
            flexilis James) (Shepperd and Battaglia 2002; Walters et al. 2013) are present.

            Figure 1—The Black Hills National Forest (BHNF) is approximately 1.2 million acres and is located in
            northeastern Wyoming and western South Dakota. This isolated mountain range is surrounded by the
            Great Plains and is dominated by ponderosa pine. The area is a popular destination for tourists due to the
            proximity of Custer State Park and several National Parks and Monuments.

2								                                                                      USDA Forest Service RMRS-GTR-422 2021
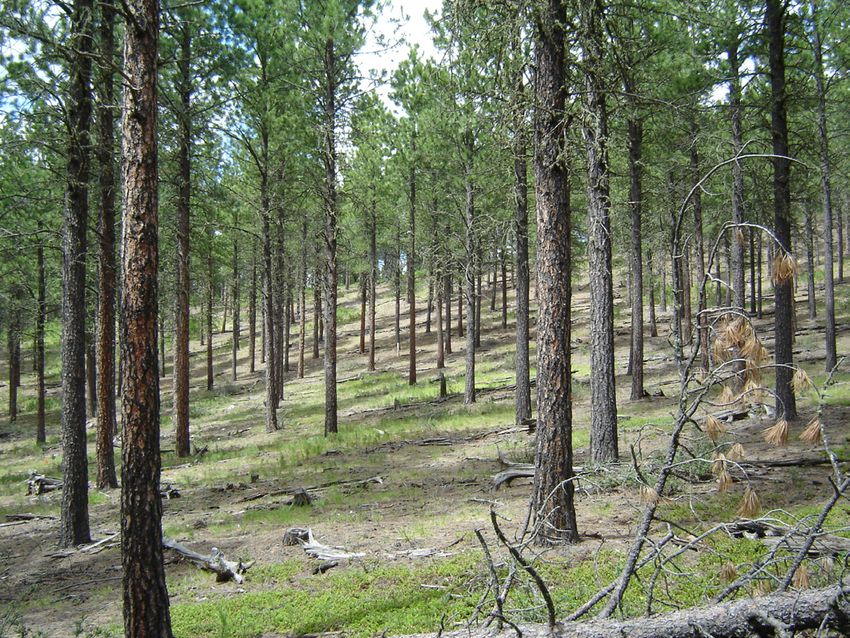
Figure 2—A landscape dominated by dense ponderosa pine forests. USDA Forest Service photo by Mike
Battaglia.

The Black Hills has a continental climate, with cold winters and hot summers.
Although precipitation patterns differ along elevational and latitudinal
gradients, in general, northern locations and higher elevations receive more
precipitation than southern locations and lower elevations (Shepperd and
Battaglia 2002). While precipitation falls year-round, most of the moisture
occurs from March to August (Western Regional Climate Center 2020). Abundant
ponderosa pine seed crops occur every 2 to 5 years that coincide with summer
moisture leading to prolific seedling establishment (fig. 3).

Figure 3—Prolific ponderosa pine regeneration typically observed across the Black Hills. USDA Forest Service
photo by Mike Battaglia.

USDA Forest Service RMRS-GTR-422 2021                                                                          3
This region has a well-developed road system and gentle topography that is
            well-suited for mechanized and efficient timber harvesting. Typical site index
            (base age 100) within the Black Hills ranges from 36 to 75 feet (Myers and Van
            Deusen 1960a). These forests produce high quality ponderosa pine lumber,
            geographically have access to midwestern U.S. lumber markets, and have
            sustained a viable timber industry for over 100 years (Boldt and Van Deusen
            1974; Freeman 2015; Shepperd and Battaglia 2002).
            This area is often referred to as the “Beautiful Black Hills” because of its
            geographic diversity, canyons, and unique rock formations that are interwoven
            within a scenic forest. The Black Hills region is home to the Black Hills National
            Forest (BHNF), Mount Rushmore National Memorial, Devils Tower National
            Monument, Custer State Park, Crazy Horse Memorial, Wind Cave National Park,
            Jewel Cave National Monument, Spearfish Canyon Scenic Byway, and the George
            S. Mickelson 108-mile biking and hiking trail. With so many places to experience
            the outdoors, these isolated mountains are a popular tourist destination that
            supports a strong and vibrant local economy (Stubbles 1992). The Black Hills
            and surrounding prairie are also a popular hunting destination where state
            residents and nonresidents alike are drawn to hunt elk (Cervus elaphus nelson),
            white-tailed deer (Odocoileus virginianus dakotensis), mule deer (Odocoileus
            hemionus), pronghorn antelope (Antilocapra americana), turkeys (Meleagris
            gallopavo merriami), and other small and large game animals.
            Disturbances are major determinants of forest structural diversity and
            composition within the Black Hills (Shepperd and Battaglia 2002). Weather
            (e.g., wind, hail, tornados, and snow), wildfire, insects, parasites, pathogens,
            and animals individually and in combination kill trees, create openings, and
            promote vegetative diversity (Lundquist 1995). Of these disturbances, insects,
            wildfire, and weather have been the most noticeable causes of tree mortality
            (Brown et al. 2008; Graves 1899; Ludlow 1875; Negrón et al. 2008; Shepperd and
            Battaglia 2002). The forests of the Black Hills have experienced cyclic mountain
            pine beetle (Dendroctonus ponderosae; MPB) epidemics (fig. 4), impacting
            different locations with various amounts of severity (fig. 5). In addition to
            MPB, frequent wildfires also burned the forests of the Black Hills (fig. 6);
            these wildfires are ecologically important in perpetuating regeneration and
            contributing to the development and disturbance resilience of ponderosa pine
            forests (Fiedler and Arno 2015). Before European settlement, average wildfire
            return interval ranged from 10 to 31 years, depending on elevation (Brown and
            Sieg 1996; Brown and Sieg 1999; Brown et al. 2008; Hunter et al. 2007). However,
            with the onset of fire exclusion, logging, and grazing in the early 1900s, fire
            frequencies decreased resulting in an increase in forest density and contiguous
            multistoried stands (Brown and Cook 2006; Grafe and Horsted 2002; Hunter et
            al. 2007).

4								                                                     USDA Forest Service RMRS-GTR-422 2021
Figure 4—Within the forests of the Black Hills, there has been a continuous endemic and several epidemics of mountain pine beetles over the last 129 years (see Graham et al. 2016, fig. 31). From 2000 through 2017, over 8,000,000 trees were estimated to have been killed. Values reported are the 5-year moving average. At the beginning of the 21st century, standing live ponderosa pine volume was at its highest levels in recorded time. These high volumes provided forested stand and landscape conditions that were classified at moderate to high hazard for MPB and wildfire (USDA FS 2013). In addition, results from long-term and recent studies across the BHNF showed that current high stand densities were susceptible to MPB and needed to be lowered across the landscape (Graham et al. 2016; Negrón et al. 2008; Negrón et al. 2017; Schmid et al. 2007). During this same time period, the BHNF started to experience an MPB epidemic (fig. 5) and several large mixed severity wildfires (fig. 6). Within the wildfire perimeters, areas with low stand densities burned less severely (Lentile et al. 2006). This local information combined with the incorporation of reducing surface fuel loads, increasing height to live crown, decreasing crown density, and maintaining large fire-resistant trees (Agee and Skinner 2005) provided additional science-based guidance for forest management that would help reduce MPB and wildfire hazard. USDA Forest Service RMRS-GTR-422 2021 5
Figure 5—The most recent (i.e., 1998) MPB epidemic started with many isolated areas of endemic MPB
            populations throughout the Black Hills. As the endemic populations increased in numbers, the MPB spread
            throughout the central and northern Black Hills. Notably, the MPB infestation was less in Wyoming portions
            of the Black Hills and Bear Lodge Mountains (see Graham et al. 2016, figs. 65–69, for details on the extent
            and impact of mountain pine beetles in the Black Hills). This disturbance can have a substantial impact on
            post-disturbance recovery.

            Figure 6—Spatial representation of wildfires in the Black Hills since the late 1800s (USDA FS 2020c). Wildfires
            in the Black Hills have been increasing since 2000, with more acres burned between the years 2000 to 2017
            than from 1960 to 1999.

6								                                                                       USDA Forest Service RMRS-GTR-422 2021
In response to the increased MPB and wildfire activity, the USDA Forest Service (USFS) adjusted its timber sale program to reduce forest susceptibility to these disturbances (Thom et al. 2020). Based on USFS timber volume sold records, from 1997 to 2011, an average of 154,543 CCF/yr (hundreds of cubic feet) of sawtimber was sold (file on record at BHNF). In 2010, a collaborative approach including local, state, and federal agencies, conservation/natural resource districts, private industry, landowners, and citizens was formed to create the Black Hills Regional Mountain Pine Beetle Strategy (Thom et al. 2020). This strategy coordinated efforts across all lands and provided education and monetary resources to shift and coordinate management strategies to reduce MPB mortality (Thom et al. 2020). Through this collaborative effort, the BHNF developed the landscape-level Mountain Pine Beetle Response Project (USDA FS 2012a) to lower forest density through mechanical harvest to reduce tree mortality. This approach led to landscape-level treatments that lowered stand densities to minimize MPB mortality and reduce wildfire hazard (USDA FS 2012b). Between 2012 and 2017, approximately 188,000 acres of ponderosa pine sawtimber was commercially harvested across all land ownerships, with the majority of the acres treated occurring on National Forest lands (Thom et al. 2020). Based on USFS timber volume sold records, from 2012 to 2017, an average of 193,107 CCF/yr of sawtimber was sold (file on record at BHNF). While sawtimber harvest volumes were increasing, most treated stands were adjacent to MPB infested stands rather than in the infested stands themselves (fig. 7); the combination of MPB and harvesting of green trees contributed to the reduction of the standing live sawtimber volume on the BHNF. Figure 7—Mountain pine beetle impacted ponderosa pine sawtimber that was not harvested. USDA Forest Service photo by Mike Battaglia. USDA Forest Service RMRS-GTR-422 2021 7
Recognizing an Information Need
            Land use and natural disturbances constitute the fabric of the Black Hills
            forests. This public land is administered and managed by the USFS BHNF. Over
            the past century, the BHNF maintained an active timber program that helped
            support mining, paper, and lumber industries (Freeman 2015). For much of the
            1900s, harvesting was extensive, often with logs processed with portable mills
            that were moved to harvest areas. The Multiple Use—Sustained Yield Act of
            1960 affirmed the USFS’s commitment to produce timber. The act required “the
            achievement and maintenance in perpetuity of a high level or regular periodic
            output of the various renewable resources of the national forests without
            impairment of the productivity of the land” (Multiple Use—Sustained Yield Act
            of 1960). As a result, timber harvesting began to increase in the 1960s on the
            BHNF
            (Swanson 2012). Today, the USFS mission is to “sustain the health, diversity,
            and productivity of the Nation’s forests and grasslands to meet the needs of
            present and future generations” (USDA FS 2020a). For many people, this
            forested island in the Great Plains is a special place and balancing land use is at
            the forefront of actions by local to national stakeholders and land managers
            (Stubbles 1992; USDA FS 2016). The Black Hills are cherished, valued, and used
            by a wide range of stakeholders including tourists, miners, hunters, loggers,
            and ranchers. The Black Hills provide a sense of place for local to international
            citizens and are a sacred place for Native Americans. There is strong interest to
            develop management options that can maintain a vibrant and sustainable
            timber industry in the Black Hills while also supplying abundant scenery,
            wildlife and domestic animal habitat, and recreational opportunities.
            Over the last two decades (2000–2020), multiple disturbances have changed the
            forest characteristics of the Black Hills (figs. 5 and 6). Recognizing these
            changes, in June 2017 the BHNF Leadership convened a working group to
            develop questions of interest on how these changes may impact the ability of
            the BHNF to provide forest products to the timber industry. These questions
            centered on developing a comprehensive understanding of the forests growing
            on BHNF suitable timberlands (Appendix A). This working group consisted
            of BHNF staff, industry representatives, and representatives from the South
            Dakota and Wyoming State Foresters’ offices. The working group and the
            leadership of the BHNF recognized an information need that required a
            rigorous inventory of the forest resources of the Black Hills and agreed to have
            the Forest Service’s Northern Research Station Forest Inventory and Analysis
            Program (NRS-FIA) provide the data for the assessment.

8								                                                      USDA Forest Service RMRS-GTR-422 2021
Therefore, the working group agreed to assess the current trends in forest
standing live volume, growth, and mortality of the BHNF using an FIA sampling
design and data collection protocol. As a result, from 2017 through 2019, the
NRS-FIA inventoried the forests of the BHNF. Rather than using the normal plot
intensity of one plot for every 6,000 acres, they increased the number of plots to
one for every 3,000 acres and measured them over a 3-year period. The working
group agreed to have the NRS-FIA use data from this survey to address the
following questions:
• What is the standing live volume estimate?
• What is the annual gross growth estimate?
• What is the annual net growth estimate?
• What is the net growth to removal ratio?
• What is the ability to produce an available sustained yield on the
Forest (timberlands/suitable base) for the next decade and what is the
methodology for producing this estimate?
Upon reviewing these questions, the leadership of the BHNF asked the USDA
Rocky Mountain Research Station (RMRS) to form a team to address the
following questions:
1. What impact does the current 2019 forest condition (i.e., standing
volume, mortality, and growth) have on the out-year timber program of
harvesting at current levels compared to other harvest level scenarios
using probable growth and mortality estimates?
2. What is a sustainable timber harvest estimate for the BHNF using the
2019 NRS-FIA data assuming rational tree mortality and growth rates
informed by those of the past?
3. What would be the standing inventory volume necessary using
reasonable growth and mortality estimates to sustain a sawtimber
allowable sale quantity (ASQ) of 181,000 CCF?
USDA Forest Service RMRS-GTR-422 2021 9To address the three questions, we needed estimates of volume growth and
mortality rates (hereafter referred to as growth and mortality rates). We
assessed past FIA resource bulletins and data to provide historical context and
variability of standing live volume, growth and mortality rates, and harvest
levels. We also evaluated the role that various disturbances contributed to
mortality within the Black Hills and in ponderosa pine forests across the
Interior West. Finally, we considered potential future climate to incorporate an
element of uncertainty in mortality rates. These assessments, when combined,
provided the framework to develop 60 scenarios to inform future potential
changes in standing live sawtimber (> 9 inches diameter at breast height; d.b.h.)
volume by varying degrees of mortality and growth rates and harvest levels.
We report 5-year trends to address question 1 (above). We report 20-year and
80-year trends to address question 2. To determine the level of standing live
sawtimber volume required to sustain 181,000 CCF/yr for each growth and
mortality rate (question 3), we determined at what volume would net growth
equal harvest level.
10 USDA Forest Service RMRS-GTR-422 2021Approach Understanding Disturbance and Tree Mortality Ponderosa pine mortality from pathogens, animals, insects, weather, and wildfire varies over space, time, and intensity in the Black Hills (Graham et al. 2016; Shepperd and Battaglia 2002). Although most historical mortality information is descriptive, these observations indicate that disturbances have always shaped the character of the Black Hills forests. For example, Ludlow (1875), when he accompanied General Custer to the Black Hills in 1874, observed large tracts of pines likely killed by insects and large fires burning in the prairie and forests that were either ignited by lightning or Native Americans. Graves (1899) described several expanses of ponderosa pine trees killed by insects and wildfire when he surveyed the Black Hills Forest Reserve. The Bureau of Entomology and Plant Quarantine provided intermittent reports on forest insect and disease conditions in the United States in the 1930s. Forest Service Research Stations and Forest Service Regional staffs in the 1950s (Ostmark and Wilford 1956; Wilford 1951) and Forest Health and Protection began providing similar information in the 1990s (Liebhold et al. 2016; O’Neil 1993). Pathogens, Animal Damage, and Weather Ponderosa pine regenerates profusely in the Black Hills creating multistoried structures that contain numerous and often dense patches (e.g., thousands of trees per acre) of suppressed saplings (< 5 inches d.b.h.) and seedlings (< 4.5 ft tall), making them vulnerable to a wide range of mortality agents. Saplings are killed by root and stem pathogens (e.g., Armillaria spp., red rot [Dichomitus squalens mellea], western gall rust [Peridermium harknessii]), and needle cast (Elytroderma deformans). Similarly, animal damage can also contribute to ponderosa pine mortality such as mice (Microtus spp., Peromyscus spp.), cottontail (Sylvilagus floridanus similis) and jackrabbits (Lepus townsendii), which can girdle and kill seedlings. Deer (Odocoileus spp.), elk (Cervus spp.), cattle (Bos spp.), and sheep (Ovis spp.) also damage and kill ponderosa pine trees by trampling, rubbing, and browsing but the amount of trees killed does not appreciably modify stand structures (Boldt and Van Deusen 1974). Weather, in the form of wind, snow, ice, tornados, and hail, intermittently damages and kills ponderosa pine trees throughout the Black Hills. These events can occur both singly and in concert with other endemic damaging agents. Straight-line winds kill individual trees yearly and tornados are known to kill small (e.g., 10 to 15 acres) patches to large (e.g., 7,000 acres) areas of trees occasionally. Also, large (≥ 1 inch diameter) hail associated with thunderstorms can defoliate and damage sapling- to pole-sized (5 to 8.9 inches d.b.h.) trees (Boldt and Van Deusen 1974; Shepperd and Battaglia 2002). Damage from wind and snow can bend and break sapling-sized trees and break or topple USDA Forest Service RMRS-GTR-422 2021 11
pole-sized trees (Collins and Green 1988; Johnson and Averill 1983; Lundquist
             2007; Lundquist and Negrón 2000). As a result, weather and mortality caused by
             diseases and animals were the major contributors to tree mortality observed in
             the Black Hills during the 1980s through the 1990s (table 1).
             Table 1—Volume mortality rates based on standing live volume of growing stock trees (> 5 inches d.b.h.),
             throughout the last several decades in the Black Hills region. Values of mortality category (rounded to
             2 significant digits) are based on the proportion that each disturbance contributed to the overall total
             mortality rate. Values might not add up due to rounding.

                            Mortality                                                                  Mortality (%)
                              rate      Insect       Fire     Disease       Weather         Other      without insect
                 Year         (%)        (%)         (%)        (%)           (%)            (%)          included
                 1962a        0.15       0.03        0.00       0.08      Not reported       0.03            0.12
                 1984b        0.26       0.03        0.03       0.00           0.17          0.03            0.23
                 1999   c
                              0.27       0.03        0.03       0.03           0.19          0.00            0.24
                 2011d        1.24       0.80        0.13       0.00           0.27          0.04            0.44
                 2019e        3.07       2.60        0.20       0.05           0.20          0.02            0.47
             a
               1962: Mortality and standing live volume based on softwoods across all land ownerships in South Dakota on
             suitable timberlands (data source: Choate and Spencer 1969).
             b
               1984: Mortality and standing live volume based on ponderosa pine across all land ownerships in South
             Dakota on suitable timberlands (data source: Collins and Green 1988). Mortality by disease was 0.002).
             c
              1999: Mortality and standing live volume based on ponderosa pine on the Black Hills National Forest (South
             Dakota and Wyoming) on suitable timberlands (data source: DeBlander 2002). Mortality by disease was 0.025
             and fire was 0.025.
             d
               2011: Mortality rate was based on ponderosa pine on the Black Hills National Forest in South Dakota on
             suitable timberlands. Walters et al. 2013 reported mortality of 1.04%, which included Wyoming and South
             Dakota; however, when FIA provided the values for 2011 by mortality category, it was only for South Dakota
             lands.
             e
               2019: Mortality and standing live volume based on ponderosa pine on the Black Hills National Forest (South
             Dakota and Wyoming) on suitable timberlands (source: USDA FS 2019).

             Mountain Pine Beetle
             The Black Hills have experienced MPB epidemics periodically somewhere
             on the Forest approximately every 20 years, with notable events in the early
             1900s, the late 1960s to the early 1980s, and the most recent epidemic from
             2000 through 2017 (fig. 4; Graham et al. 2016; Lessard et al. 1987; Thompson
             1975). Ponderosa pine tree susceptibility to MPB is related to stand density and
             tree diameter (Graham et al. 2016; Negrón et al. 2008). Mountain pine beetles
             can attack pole-sized ponderosa pine trees but prefer sawtimber-sized trees
             (Graham et al. 2016; Negrón et al. 2008; Negrón et al. 2017; Schmid et al. 2007).
             From 1960 through 1999, it is estimated that MPB killed 5,733,550 ponderosa
             pine trees (Graham et al. 2016; Lessard et al. 1987). During this period, insect
             mortality contributed 0.03% to the total mortality rate (table 1). In the 1960s
             through mid-1970s, mortality caused by MPB was most evident in the northern
             Black Hills (Thompson 1975). By the mid-1970s, tree mortality from MPB was

12								                                                                     USDA Forest Service RMRS-GTR-422 2021
clearly evident along the Wyoming and South Dakota border, south and west of Spearfish, South Dakota, and within portions of the southern Bear Lodge Mountains, near Sundance, Wyoming (Fuller and Hostetler 1980; Gillman and Bailey 1977; James and Linnane 1979; Raimo and Sharon 1981). By the early 1980s, mortality caused by MPB decreased in the South Dakota Black Hills but mortality from MPB were observed in the Bear Lodge Mountains in Wyoming (Johnson and Averill 1983; Lessard and Fuller 1982; Lister and Hildebrand 1984). During that time, a major contribution to the high mortality rate of 4.19% reported for ponderosa pine by Green and Conner (1989) was caused by MPB. From 2000 to 2017, approximately 8,631,500 ponderosa pine were killed by MPB (Graham et al. 2016; Harris 2016, 2017, 2018) (fig. 4). This recent epidemic occurred within the central portions of the BHNF (fig. 5). Total insect mortality in 2011 accounted for 0.80% of the 1.24% annual tree mortality rate (table 1). In contrast, total insect mortality contributed 2.60% of the 3.07% mortality rate recorded in 2019, demonstrating the full impact of the 2000 through 2017 bark beetle epidemic. As of 2019, the MPB epidemic has subsided in the BHNF (Harris 2019). Wildfires Prior to European settlement (circa 1875), wildfires burned in the forests of the Black Hills on average every 10 to 31 years depending on elevation (Brown and Sieg 1996; Brown and Sieg 1999; Brown et al. 2008; Hunter et al. 2007). While ponderosa pine is considered a fire-adapted species, seedling- and sapling- sized trees are still susceptible to low-intensity surface fires (Battaglia et al. 2009). Pole- and sawtimber-sized trees are also susceptible to wildfire if the fire is intense enough to scorch a substantial amount of the foliage, consume the foliage, and/or kill the cambium (Keyser et al. 2006). By the early 1900s, European settlement of the Black Hills and the rise of the gold mining industry resulted in the suppression of fires to protect the towns and timber (Freeman 2015). Fire suppression, along with timber harvesting activities, altered the structures of the forests by removing the large diameter tree component, increasing small tree densities, and decreasing the amount of open-canopied forests (Boldt and Van Deusen 1974; Brown and Cook 2006; Grafe and Horsted 2002; Shepperd and Battaglia 2002). Wildfire ignitions are common within the Black Hills and have the potential to burn thousands of acres. For example, from 2000 to 2019, approximately 100 fires burned each year on public lands within the Black Hills, but most remained small and were suppressed (NIFC 2020). However, under conducive weather conditions, large wildfires can occur (fig. 6). From 1960 to 2019, across the Black Hills region, 547,449 acres burned, with over 75% of the burned area occurring in the last 20 years. Before 2000, wildfires burned 141,481 acres, averaging 3,628 acres per year. However, most of these fires were not extensive USDA Forest Service RMRS-GTR-422 2021 13
nor did they burn in areas where the FIA plots were located (Choate and
             Spencer 1969; Collins and Green 1988; DeBlander 2002; Green and Conner 1989).
             As a result, the contribution wildfire made to the total annual mortality from
             the 1960s through 1990s ranged from 0.00 to 0.03% (table 1). From 2000 through
             2017, a total of 406,331 acres burned, averaging 22,574 acres burning per year
             with wildfire contributing 0.13% to 0.20% of the total annual tree mortality in
             the Black Hills (table 1). Included in that 406,331 acres was the 2000 Jasper Fire,
             which burned 83,500 acres in the south-central Black Hills. Although DeBlander
             (2002) commented that over 130,000 acres of the BHNF had been impacted by
             large fires, the mortality caused by these fires was not included in the report
             since the measurements were made before the wildfires. However, Walters et
             al. (2013) did report tree mortality from the Jasper fire as well as other wildfires.
             During the last 20 years, the increase in the extent and severity of wildfires
             burning the forests of the Black Hills in the 2000s and 2010s is reflected in the
             higher tree mortality rates (fig. 6; table 1).
             Mortality Trends Across the Interior West
             Recent mortality in ponderosa pine forests is not limited to the Black Hills
             region. FIA resource bulletins have reported increases in ponderosa pine
             mortality across the Interior West of the United States over the past few decades
             (Goeking 2015). Mortality rates ranged between 0.12 (Utah) to 1.30% (Montana)
             with an average mortality of 0.79% (table 2). Wildfires, followed by insects and
             disease, were the main contributor of mortality on a land area basis across the
             Interior West (DeRose et al. 2018; Goeking and Menlove 2017; Shaw et al. 2018;
             Thompson et al. 2017; Werstak et al. 2016; Witt et al. 2018, 2019). Several studies
             have reported that the number of wildfire events, along with the amount of
             acres burned, have increased across the western United States and Canada
             (Coop et al. 2020; Hanes et al. 2018; Parks and Abatzoglou 2020; Westerling
             2016). In addition, increases in tree mortality due to increased regional
             warming and drought stress have been observed across unmanaged older
             forests in the western United States (van Mantgem et al. 2009).

14								                                                       USDA Forest Service RMRS-GTR-422 2021
Table 2—Volume gross growth and mortality rates for Interior West states from the 2000s to mid-2010s.
Data is based on Forest Inventory Analysis annual forest inventory of ponderosa pine growing stock (> 5
inches d.b.h.) on national forest lands that were classified as timberland. The mortality rate is primarily a
result of insects and fire across all ownerships.
Sampling Gross growth rate Mortality rate
State period (%) (%) Source
Arizona 2001–2014 1.5 0.90 Shaw et al. 2018
Colorado 2004–2013 1.4 0.88 Thompson et al. 2017
Idaho 2006–2015 1.7 1.22 Witt et al. 2018
Montana 2006–2015 1.7 1.30 Witt et al. 2019
New Mexico 2008–2014 1.6 0.73 Goeking and Menlove 2017
Utah 2003–2015 1.3 0.12 Werstak et al. 2016
Wyoming 2011–2015 2.2 0.36 DeRose et al. 2018
Average — 1.63 0.79 —
Changing Climate
Since the beginning of the 20th century, South Dakota has observed a 2 °F
increase in average annual temperature (Frankson et al. 2017; Rice et al. 2018).
Most of this temperature increase has taken place in the winter and spring
months as well as nighttime temperatures throughout the year. By the middle
of the 21st century, it is predicted that mean annual temperatures will exceed
those of the past 100 years. Projected precipitation estimates are less certain,
but current models suggest an increase in precipitation during the winter
and spring months (Frankson et al. 2017). While precipitation is expected
to increase during these cooler months, the increase in temperature would
influence the moisture deficit during the summer months and increase the
vulnerability to periodic drought. Future droughts that coincide with warmer
temperatures, often referred to as “hot droughts,” are expected to happen as
well. During these hot droughts, evapotranspiration demand increases while
soil moisture and fuel moistures decreases (Frankson et al. 2017).
How might these climate change projections impact wildfire, MPB, and
ponderosa pine mortality in the Black Hills region? Warmer temperatures
throughout the year may result in earlier snowmelt and longer growing
seasons. Moreover, higher temperatures in winter may shift snow to rain. These
changes in growing season and precipitation type could result in fire seasons
starting earlier and ending later, a situation that is being observed across the
western United States (Coop et al. 2020; Rocca et al. 2014; Westerling 2016;
Westerling et al. 2006). These changes may increase fire frequency (Rocca et
al. 2014), increase wildfire extents (Parks and Abatzoglou 2020), and prolong
fire seasons (Brown et al. 2004). These events may diminish regeneration and
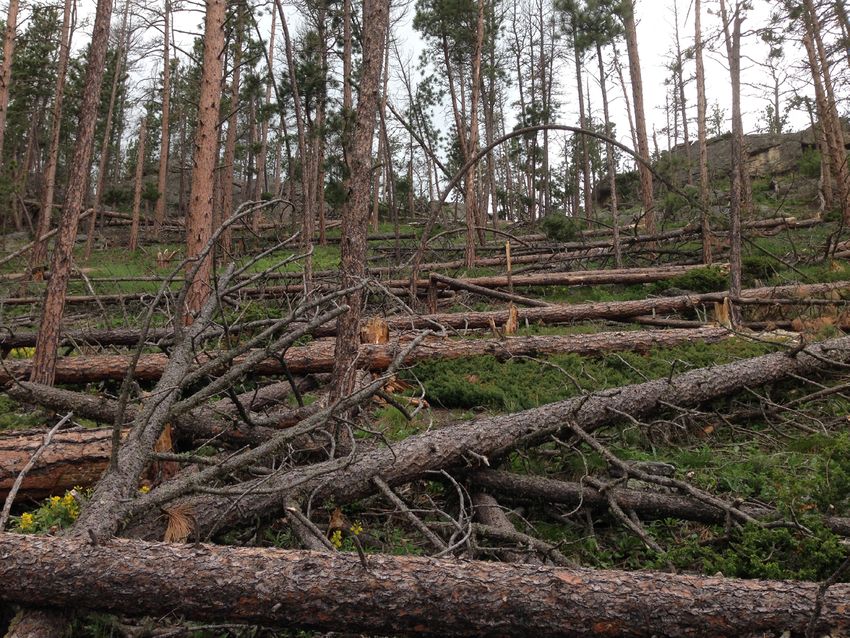
USDA Forest Service RMRS-GTR-422 2021 15growing stock potential. For example, 20 years after the 2000 Jasper Fire, large areas of high burn severity still have limited or no ponderosa pine regeneration establishment (fig. 8; Keyser et al. 2008; Lentile et al. 2005; Lentile et al. 2006; Ziegler et al. 2017); similar occurrences are being observed across the western United States (Coop et al. 2020). Furthermore, in these high-severity burned areas, surface fuels are increasing from the dead and down trees (fig. 9a; Keyser et al. 2008) and a reburn in this area could result in adverse post-fire outcomes (fig. 9b; Coop et al. 2020; Stevens-Rumann et al. 2012). Mountain pine beetle impacted areas that have not burned also can produce a fire hazard due to their heavy fuels (fig. 10; Sieg et al. 2016). Warmer temperatures directly impact MPB population dynamics (Bentz et al. 2010). Mountain pine beetles are often in the larvae stage during the cold, winter months. While the larvae can cold harden to survive the cold winter temperatures, extreme cold temperatures can reduce MPB populations (Bentz and Mullins 1999). However, with warmer winter temperatures, MPB will not succumb to this mechanism of population control. These factors could lead to more frequent outbreaks. If these estimates come to fruition, then mortality rates could exceed the historically lower rates observed in the 20th century. Figure 8—Many high-severity burned areas in the 2000 Jasper Fire footprint have still not revegetated with ponderosa pine seedlings after 20 years. Instead, these areas are dominated by graminoids, forbs, ponderosa pine snags, and downed woody debris. USDA Forest Service photo by Mike Battaglia. 16 USDA Forest Service RMRS-GTR-422 2021
9a

          9b

Figure 9—(a) A high severity burned area in the 2000 Jasper fire footprint that has revegetated with
ponderosa pine seedlings post-wildfire. Notice the abundant ponderosa pine seedlings surrounded by
standing snags and downed woody debris. (b) This photograph is 1 year after the area reburned in a fire.
Notice the high seedling mortality, reduction in ponderosa pine snags, and reduction of downed woody
debris. Fires occurring in these types of fuel complexes are expected to result in high tree mortality and
other adverse outcomes. USDA Forest Service photos by Mike Battaglia.

USDA Forest Service RMRS-GTR-422 2021 							                                                                17
Figure 10—A typical fuel complex observed in mountain pine beetle impacted stands that were not harvested. Fires occurring in these types of fuel complexes are expected to result in high tree mortality and other adverse outcomes. USDA Forest Service photo by Mike Battaglia. Assessing Past FIA Reports Since 1930, the FIA mission is to manage and update a comprehensive inventory and analysis of the present and future conditions of the renewable resources of the forest and rangelands of the United States (USDA FS 2018a). The FIA program and data collection protocol have evolved over the years. For example, data collected in the 20th century was based on periodic surveys on forested lands every 10 years, one state at a time, progressing from state to state until all forested land within each unit’s region were inventoried (Frayer and Furnival 1999). The specific measurement years and protocols varied among states; therefore, each report provided the methods and definitions. Beginning in 2000, the FIA program implemented an annualized inventory, referred to as the “annual” inventory, which is nationally consistent with sampling across land ownerships and forest types spatially and temporarily unbiased (Goeking 2015). It is important to note that the periodic and annual inventory data are not directly comparable, but both provide good descriptions of forest resources (Goeking 2015). Since different inventory methodologies were used, values from the periodic (pre-2000s) and annualized (post-2000s) inventories may have discrepancies in broad-scale estimates. This doesn’t negate the data from periodic inventories, since it is the best available information from that 18 USDA Forest Service RMRS-GTR-422 2021
time, but it does suggest that users of this older data need to be careful in its
interpretation and not use it to quantify trends. Instead, we used these data to
provide context and identify mortality and gross growth rates to inform our
scenario development. Jointly, the USDA RMRS Interior West (IW-FIA, Ogden,
Utah) and the NRS-FIA (St. Paul, Minnesota) units were and are currently
responsible for the BHNF inventories. Below is a list of the reports and the
information we obtained from them to provide historical context of mortality
and growth.
Using data collected from 1960 through 1962, within the boundaries of the
BHNF and Custer National Forest (NF), Choate and Spencer (1969) described
the forestland conditions of western South Dakota. Rather than establishing
new random plots, they visited 137 locations that were established from 1953
through 1954. They used a nested rectangular plot design to describe growing
stock (≥ 5.0 inches d.b.h) reported in cubic feet for trees with a 1-foot stump to a
4-inch top. The estimates derived from this report are based on softwoods that
included both ponderosa pine and white spruce. The amount of growing stock
volume killed by fire, insects, disease, animals, weather, and suppression was
estimated on each plot. Timber removals were approximated from timber and
mill residue production of local wood processing plants.
Collins and Green (1988) described the forest resources collected from 1979
to 1983 of South Dakota west of the 103rd meridian. The area they included
incorporated 90% of the forestlands of South Dakota, of which 58% are NFS
lands (BHNF and Custer NF) and the remaining amounts on private and other
public forest lands. It was not clear if this included lands withdrawn by statute
or administrative regulation. They described metrics including mortality and
growing stock volume (≥ 5 inches d.b.h) on stands with at least 10% of trees in
these size classes and had a 1-foot stump to 4-inch top diameter (outside bark).
The estimates derived from this report are based on softwoods, which included
both ponderosa pine and white spruce.
DeBlander (2002) described data collected in 1999 on BHNF forestlands
in Wyoming and South Dakota. Phase one of the survey used grid points
systematically located every ≈ 0.6 miles (1,000 meters) across all lands within
the BHNF. A second sampling phase selected one of these plots every ≈ 3 miles
(5,000 m) stratified by ownership and vegetation type. Two-hundred and five
plots were sampled on the NFS lands; of these, 173 were forest, 22 were both
forest and nonforest, and 10 were nonforest. In 1995, a mapped plot design
was adopted by FIA nationwide that was used in this survey. At each location,
four, 1/24th acre plots were used to describe growing stock (≥ 5.0 inches d.b.h.)
of trees that had a 1-foot stump to a 4.0-inch outside bark top. Tree mortality
was estimated for both standing and down trees that died in the past 5 years.
Estimates derived from this report are for ponderosa pine only. In addition, the

USDA Forest Service RMRS-GTR-422 2021                                                  19
estimates include values from all lands administered by the BHNF, including
             reserved lands, which made up 1% of the total land base.
             Annualized inventory was reported by Walters et al. (2013). Volume estimates
             came from the 5-year (2007 to 2011) inventory period for the South Dakota
             portion of the BHNF, and the 2005 data collected in Wyoming. Under annualized
             inventories, growth, removals, and mortality (GRM) are estimated using two
             time periods. For South Dakota, these time periods were from 2002 to 2006 and
             2007 to 2011. For Wyoming the time periods were 2000 and 2005. An annualized
             measurement scheme was conducted using remotely sensed data and data
             from one plot, consisting of 4-subplots, established every 6,000 acres. The four
             subplots are measured on a 5-year rotating basis. Estimates derived from this
             report are for ponderosa pine (≥ 5 inches d.b.h.) only on BHNF nonreserved
             lands.
             The 2019 (2017 to 2019) data were specific inventories requested by the BHNF
             from FIA to address changes in forest conditions observed most noticeably
             by recent MPB and wildfire activity (figs. 5 and 6). The data have been quality
             checked by NRS-FIA but have not been published (data on file). Data for these
             measurements cover both South Dakota and Wyoming portions of the BHNF.
             Tree growth, mortality, removals, and standing live volume for ponderosa
             pine trees > 5 inches d.b.h. and sawtimber-sized trees (> 9 inches d.b.h.) were
             described. Merchantable volume for trees > 5 inches d.b.h used a 4-inch top and
             sawtimber volumes were computed to a 7-inch top. Both merchantable volume
             classes used a 1-foot stump.
             Values for the 2019 data came from three sources: (1) plots that were
             remeasured from previous FIA inventories that fell within the normal
             measurement cycle (panel base plots); (2) plots that were remeasured from
             previous FIA inventories but that were measured ahead of schedule (off-panel
             base plots); and (3) new plots that were installed in 2017 and 2018 field seasons
             to increase the sample size and spatial extent (one plot every 3,000 acres; 2X
             PLOTS). Data from panel base plots and off-panel base plots (table 3) were used
             to calculate GRM because these values require two separate measurements over
             a time period (Time 1 and Time 2). Typically, the time period between the two
             measurement periods is on a 5- to 10-year measurement cycle, depending on the
             state. However, the 2019 final inventory for the analysis used in this document
             includes repeat measurements that vary in time between measurements to
             facilitate the most-up-to-date estimates. For example, the 2019 GRM estimates
             include plots that were initially measured (Time 1) between 2011 and 2016 and
             remeasured (Time 2) between 2017 and 2019 for a total of 225 plots (table 3).
             Estimates of volume do not require two separate measurements over a time
             period. Therefore, the panel base plots, the panel off-base plots, and the 2X
             PLOTS contributed to estimates of volume for a total of 438 plots. Although

20								                                                    USDA Forest Service RMRS-GTR-422 2021
the 2X PLOTS that were established in 2017 and 2018 did not contribute to
the GRM estimates, the BHNF has the option to remeasure these new plots to
get additional GRM estimates to reduce sampling error in the future. These
measurements would be useful to detect any additional mortality or the
anticipated decline in mortality related to MPB.
Table 3—The number of plots measured for 2017 and 2019 evaluation for the off-panel base and panel
base plots. Walter et al. 2013 reported growth, removals, and mortality measured prior to 2012. The 2019
evaluation includes plots remeasured from 2011 through 2016 for growth, removals, and mortality.
Time 1
Time 2 Plot establishment year
Year and plots
remeasured 2005 2006 2007 2008 2009 2010 2011 2012 2013 2014 2015 2016 Total
Before 2012* 20 3 38 45 40 37 38 221
2017 evaluation
2011 20 3 — — — — — — — — — — 23
2012 — — 38 — — — — — — — — — 38
2013 — — — 45 — — — — — — — — 45
2014 — — — — 29 — — — — — — — 29
2015 — — — — 11 17 2 — — — — — 30
2016 — — — — — 20 7 — — — — — 27
2017 — — — — — — 29 — — — — — 29
Total 20 3 38 45 40 37 38 — — — — — 221
Established plots
before 2017 — — — — — — 56 38 45 29 30 27 225
2019 evaluation
2017 — — — — — — 29 — — — — — 29
2018 — — — — — — 15 20 — — — — 35
2019 — — — — — — 12 18 45 29 30 27 161
Total — — — — — — 56 38 45 29 30 27 225
*Reported by Walters et al. 2013.
It should be noted that the 2017 evaluation presented in this document was
summarized and presented to the stakeholder group in 2018 to provide
preliminary results and progress; however, these data were not the complete
data set until the 2019 evaluation data was added to be used for the final
analysis.
As shown by the previous reports, BHNF FIA data from 1962 through the
present covered a wide variety of areas, used various sampling methods,
presented different forest metrics, and assessed different time frames.
USDA Forest Service RMRS-GTR-422 2021 21These data provide context that can be used in helping to understand how the
forests of the Black Hills have changed and provide insights of how they may
change and be managed in the future.
Growth, Mortality, Harvests, and Standing Live Tree Inventory
Over Time
Standing live tree inventory changes through time because of tree growth,
mortality, and harvest between measurement periods. Gross growth is defined
as the annual increase in tree volume in the absence of mortality and harvest.
Gross growth includes accretion plus gross ingrowth (see Box 1 for detailed
definitions and calculations), net growth is gross growth minus mortality, and
net change is net growth minus harvest (Bechtold and Patterson 2005).
The FIA resource bulletins provided some challenges in interpretation. Choate
and Spencer (1969) and Collins and Green (1988) only reported acreage of South
Dakota and their estimates include ponderosa pine and white spruce together
as softwoods. DeBlander (2002) and Walters et al. (2013) reported ponderosa
pine and white spruce separately for the entire BHNF, which includes acreage
in South Dakota and Wyoming. The FIA estimates prior to the year 2000 used
periodic inventory to gather inventory data that include resource bulletins by
Choate and Spencer (1969), Collins and Green (1988), and DeBlander (2002).
The years when data were collected were not at regular intervals through time.
The older resource bulletins reported volume in cubic feet for growing stock (>
5 inches d.b.h). However, when sawtimber-sized trees (> 9 inches d.b.h.) were
reported separately, the data were in board feet. The 2017 and 2019 data were
reported in both board feet and cubic feet.
Even with these identified nuances among the resource bulletins, they do
provide general estimates of standing live volume, growth, and mortality on the
Black Hills for growing stock > 5 inches d.b.h. (table 4; fig. 11). Over the past 60
years, gross growth, based on the percent of the standing live inventory, ranged
between 2.33% and 2.74%. While mortality rates from the 1960s to 1990s were
0.16% and 0.27%, mortality rates started to increase in the 2000s, with values of
1.04% in 2011, 2.72% in 2017, and 3.07% in 2019. From 1962 to 1999, net growth,
as a percentage of standing live volume, was positive with rates of 2.20% to
2.57%, which reflected the high gross growth and low mortality rates of those
measurement periods. Although the 2011 measurement period still showed
a positive gross growth of 2.66%, it coincided with a higher mortality rate of
1.04%, resulting in a decline in net growth to 1.62% (table 4). By 2017, gross
growth was 2.74%, but mortality was 2.72%, resulting in a 0.02% net growth. In
the most recent 2019 measurements, gross growth had decreased to 2.33% while
mortality increased to 3.07%, resulting in a net growth of -0.75% (table 4).
22 USDA Forest Service RMRS-GTR-422 2021You can also read