A semi-supervised self-training method to develop assistive intelligence for segmenting multiclass bridge elements from inspection videos
←
→
Page content transcription
If your browser does not render page correctly, please read the page content below
Journal Title
                                                                                                                                            XX(X):1–15
                                         A semi-supervised self-training method                                                             ©The Author(s) 2020
                                                                                                                                            Reprints and permission:
                                         to develop assistive intelligence for                                                              sagepub.co.uk/journalsPermissions.nav
                                                                                                                                            DOI: 10.1177/ToBeAssigned

                                         segmenting multiclass bridge elements                                                              www.sagepub.com/

                                                                                                                                              SAGE
                                         from inspection videos
                                         Muhammad Monjurul Karim1 , Ruwen Qin1 , Zhaozheng Yin2 and Genda Chen3

                                         Abstract
                                         Bridge inspection is an important step in preserving and rehabilitating transportation infrastructure for extending their
                                         service lives. The advancement of mobile robotic technology allows the rapid collection of a large amount of inspection
                                         video data. However, the data are mainly images of complex scenes, wherein a bridge of various structural elements
                                         mix with a cluttered background. Assisting bridge inspectors in extracting structural elements of bridges from the
arXiv:2109.05078v2 [cs.CV] 14 Sep 2021

                                         big complex video data, and sorting them out by classes, will prepare inspectors for the element-wise inspection to
                                         determine the condition of bridges. This paper is motivated to develop an assistive intelligence model for segmenting
                                         multiclass bridge elements from inspection videos captured by an aerial inspection platform. With a small initial training
                                         dataset labeled by inspectors, a Mask Region-based Convolutional Neural Network (Mask R-CNN) pre-trained on a
                                         large public dataset was transferred to the new task of multiclass bridge element segmentation. Besides, the temporal
                                         coherence analysis attempts to recover false negatives and identify the weakness that the neural network can learn to
                                         improve. Furthermore, a semi-supervised self-training (S3 T) method was developed to engage experienced inspectors
                                         in refining the network iteratively. Quantitative and qualitative results from evaluating the developed deep neural network
                                         demonstrate that the proposed method can utilize a small amount of time and guidance from experienced inspectors
                                         (3.58 hours for labeling 66 images) to build the network of excellent performance (91.8% precision, 93.6% recall, and
                                         92.7% f1-score). Importantly, the paper illustrates an approach to leveraging the domain knowledge and experiences
                                         of bridge professionals into computational intelligence models to efficiently adapt the models to varied bridges in the
                                         National Bridge Inventory.

                                         Keywords
                                         Transfer learning, temporal coherence, self-training, active learning, human-in-the-loop, AI-human collaboration, bridge
                                         inspection, multiclass segmentation

                                         Introduction                                                    [4] and inspection results vary largely among inspectors. To
                                                                                                         make inspection faster, cheaper, safer, more objective, and
                                         The U.S National Bridge Inventory has over 600,000              less interruptive to traffic, methods to automate the bridge
                                         highway bridges. 39% of these bridges are over 50               inspection have been developed. Recently, mobile robots
                                         years old, and almost 9% are structurally deficient and         such as Unmanned Aerial Vehicles (UAVs) have been proven
                                         require significant repair [1]. Rehabilitation, maintenance,    to be very helpful in dangerous, dull, or dirty applications
                                         and rebuilding efforts are necessary for preserving the         [5]. Collecting inspection video data using aerial platforms
                                         transportation infrastructure throughout the United States.     reduces or eliminates the labor-intensive onsite inspection
                                         For example, National Bridge Inspection Standards require       process and allows inspectors to assess bridges from a safer
                                         that each bridge should be inspected every two years            location. Yet, the use of robotic inspection platforms has
                                         to ensure no cracks, rust, or other damages [2]. The            solved just part of the above-discussed issues, efficient,
                                         conventional bridge inspection requires a crew of inspectors,
                                         heavy equipment with a lifting capability, access to
                                         dangerous heights, and the closure of the road during
                                         the time of inspection. These make the bridge inspection        1 Department of Civil Engineering, Stony Brook University, Stony Brook,

                                         one of the most dangerous and costly operations in              NY 11794, USA
                                                                                                         2 AI Institute, Department of Computer Science, Department of
                                         the state Departments of Transportation. Results of the
                                                                                                         Biomedical Informatics, Stony Brook University, Stony Brook, NY 11794,
                                         visual inspection are inaccurate and vary largely among
                                                                                                         USA
                                         different inspectors although the image-reference approach      3 Department of Civil, Environmental and Architectural Engineering,

                                         is developed to guide the inspection [3].                       Missouri University of Science and Technology, Rolla, MO 65409
                                            Research has taken place to develop safer and more           Corresponding author:
                                         efficient bridge inspection methods. Some adopted a             Ruwen Qin, Department of Civil Engineering, Stony Brook University,
                                         completely manual approach for the bridge routine               Stony Brook, NY 11794, USA.
                                         inspection, which requires a large number of inspector hours    Email: ruwen.qin@stonybrook.edu

                                         Prepared using sagej.cls [Version: 2017/01/17 v1.20]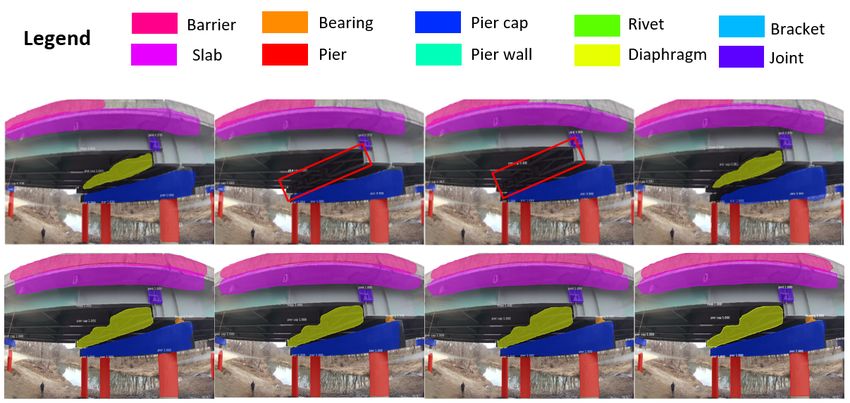
2                                                                                                              Journal Title XX(X)

reliable analysis of inspection video is another important           multiclass object detection and segmentation relies on large-
task.                                                                scale dense annotations for model training. Yet annotating
                                                                     a huge amount of training data for bridge inspection is not
   Letting inspectors watch the collected videos for hours and
                                                                     only labor-intensive but expensive as it needs the knowledge
days are inefficient. It is desired that a tool can be developed
                                                                     of domain experts [24]. To truly assist bridge inspectors
to assist inspectors in extracting structural elements from the
                                                                     in their jobs, the burden of data annotation should not be
inspection videos and sorting them out by classes. Given
                                                                     completely passed to them. The efforts that domain experts,
a such tool, inspectors can concentrate on the element-
                                                                     such as inspectors, contribute to the deep learning model
wise inspection. Besides, the rating of a bridge needs to
                                                                     development must be well controlled and best utilized.
be provided by a comprehensive assessment that evaluates
                                                                     The strict budget for inspector-annotated training data and
the impact of defects on specific elements of the bridge
                                                                     the high requirement on model performance motivate the
[6, 3, 7]. This requires to spatially relate detected defects with
                                                                     combination of self-training and active learning to create a
bridge elements where the defects are located. The above-
                                                                     new model training approach, which are delineated in the
mentioned approach to the bridge condition evaluation
                                                                     next section.
suggests that an important step of analyzing the inspection
video data is to extract and index images of bridge elements.           This paper proposes a cost-effective method to create an
After that, defect evaluation and interpretation will take           assistive intelligence model for detecting and segmenting
place.                                                               multiclass structural elements from bridge inspection videos
                                                                     captured by an aerial inspection platform. Achieved job
   Extracting structural elements from the inspection videos         efficiency and the quality of the model let inspectors
and sorting them out by classes is a very challenging task           truly benefit from the technology advancement in their
for practitioners. On the one hand, there could be hours of          jobs. The assistive intelligence model is not an artificial
videos that need to be analyzed for every individual bridge          intelligence model isolated from users. Instead, inspectors
of inspection. Watching hours of video to locate the desired         provide their expertise to guide the development of a deep
regions of interest is very cumbersome work for a human.             neural network, which assures the network quickly converges
Humans are prone to fatigue. Studies have shown that the             to a satisfactory tool for assisting themselves in analyzing the
human visual inspection accuracy declines easily in dull,            videos of any intended bridge of inspection. Filling the gaps
endlessly routine job [8, 9]. The inspector could easily miss        identified in this paper, the proposed method has anticipated
elements in big video data, left there without an examination.       technical contributions in three-fold: (i) a quick transfer of
Fatigue and boredom developed from repetitively watching             an existing deep learning network to the task of detecting
hours of video data induce the bias in assessing the bridge          and segmenting multiclass structural elements from bridge
elements and evaluating the condition of the whole bridge.           inspection videos, (ii) the use of a lightweight temporal
On the other hand, bridge inspection videos captured by              coherence analysis to recover false negatives and identify
aerial inspection platforms are mainly images of complex             weakness that the network can learn to improve, and (iii)
scenes, wherein a bridge of various structural elements              the development of a semi-supervised self-training (S3 T)
mix with a cluttered background. Assisting inspectors in             algorithm that keeps human-in-the-loop to efficiently refine
analyzing the big complex video data is greatly desired to           the deep neural network iteratively.
improve their job efficiency. The development of sensing                The remainder of this paper is organized as the following.
technology and deep learning methods has significantly               The related work is discussed in the next section. Then, the
advanced the image analysis for defect detection [10, 11,            proposed method to create the assistive intelligence model is
12, 13, 14, 15, 16]. Yet, methods to create deep learning            delineated. After that, results from evaluating the proposed
models for defect detection and classification are not directly      method and the developed model are discussed. In the end,
applicable to the research problem of this paper for various         conclusions and future work are summarized.
reasons. For example, many of the models require to take
close-up images in a nearly uniform testing background
where defects are relatively large and clear to analyze.             Literature Review
Although deep learning models for segmenting multiclass
                                                                     Being an important step before the detailed damage
objects from images are well developed in computer vision,
                                                                     assessment, extracting regions of interest from inspection
extracting multiclass bridge elements from inspection videos
                                                                     video data is receiving attention from the bridge health
captured by aerial robotic platforms is not a completely
                                                                     monitoring community. A few studies have developed a
solved problem.
                                                                     strong base for infrastructure component recognition using
   A few studies have developed a strong base for                    computer vision. For example, Narazaki et al. [17] used
infrastructure component recognition using computer vision           multi-scale convolutional neural networks to perform the
[17, 18]. Extracting bridge structural elements from videos          pixel-wise classification and smoothed the segmentation
captured by aerial inspection platforms are facing additional        result using conditional random forest. They used the scene
challenges [19]. These include, but not limited to, motion           classification result to help reduce false positives of bridge
blur, partial or full occlusion, illumination variation,             components in complex scene images. Recently, authors
background variation, and so on. So far, some studies                from the same research group [18] further examined two
[20, 21, 22, 23] have reported their successful experiences,         semantic segmentation algorithms and three approaches
for example, utilizing the temporal information of objects           to integrating a scene classifier and a bridge component
in video data. But the additional computational cost is              classifier. This study found that the sequential configuration
expensive. The high accuracy of deep learning models for             outperforms other configurations if the input is complex

Prepared using sagej.cls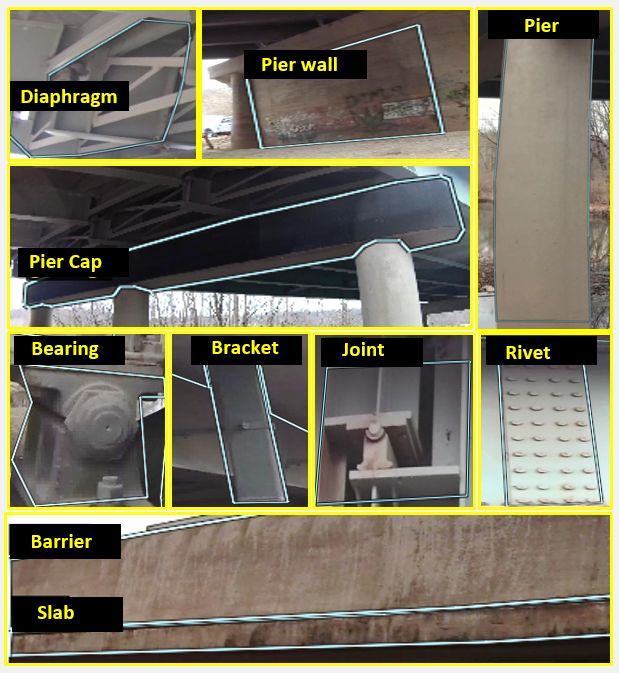
Karim et al.                                                                                                                   3

scene images. Yeum et al. [19] discussed various difficulties     more training samples. This technique has been applied to
in analyzing inspection video data collected by aerial            a variety of image/video processing applications [36, 37] to
platforms and proposed a Convolutional Neural Network             reduce the effort of human annotation. While most semi-
(CNN) based approach to locate and extract regions                supervised learning methods save the data annotation effort
of interest from images before performing the damage              compared to supervised learning, their performance is still
detection. The study demonstrated the implementation of           not good enough. The primary reason for this challenge is the
the developed neural network in finding candidate image           quality of the automatically annotated data. The inclusion of
patches of welded joints of the truss structure. It also showed   some samples mislabeled by the network itself may sharply
that detecting highly relevant structural elements can greatly    deteriorate the training process.
reduce the false positive and false negative detection in the        Recently, a promising approach named active learning has
following step of damage assessment. Yet, detecting and           been proposed to reduce the annotation cost for training
segmenting multiclass structural elements from inspection         deep neural networks [38]. The essence of active learning
videos collected by aerial platforms is still not solved          is to train a network by actively selecting training samples
completely.                                                       from a pool of unlabeled data, which will be labeled by
   On multiclass object detection, the Region-based CNN           a human annotator to re-train the model. The fundamental
(R-CNN) [25] has shown success in many applications.              assumption underlying this approach is that selecting fewer
The R-CNN uses the selective search [26] to generate              but informative data and allowing the model to learn with it
region proposals to find objects in an image. The Faster          may achieve greater performance than training the network
R-CNN [27] was proposed to make the R-CNN faster. It              using a large amount of labeled data. The performance
offers improvements in both speed and accuracy over its           of active learning depends on the samples selected from
predecessors through the shared computation and the use           the unlabeled data. Traditional sampling methods do not
of a neural network to propose regions. Then, the Mask R-         always guarantee to provide the most representative training
CNN [28], an extension of the Faster R-CNN, was proposed          samples in support of active learning because of the dataset
to perform the bounding box regression and the pixel-level        diversity and limited knowledge about the dataset. Many
segmentation simultaneously. The R-CNN and Mask R-                strategies have been developed for sampling data from
CNN models work well in detecting objects from static             unlabeled data for active learning [38]. Uncertainty sampling
images. But results may not be consistent when they process       is the most widely used strategy, which queries for samples
video data. Therefore, the temporal coherence information of      that it is most unsure about. For example, Tian et al.
objects in successive frames has been introduced to address       [39] used clustering and the fuzzy-set selection method to
the issue of inconsistent detection [20, 21, 22], wherein         choose the most uncertain and informative samples. This
the tubelet and optical flow are used to propagate features       method increases the training sample diversity. The use
from one frame to another. Temporal coherence analysis            of active learning in image classification has been widely
methods in the literature are computationally expensive           explored [40, 41]. However, the potential of active learning
due to the requirement for repeated motion estimation and         is less thoroughly explored in the more complex task of
feature propagation. Seq-NMS [23] has a modification only         instance segmentation that usually has a relatively higher
in the post-processing phase and, thus, it is faster than         annotation cost. Morrison et al. [42] considered both spatial
others. However, seq-NMS tends to increase the volume             and semantic uncertainties of prediction using the dropout
of false positives because it neither puts any penalty on         sampling. By adding dropout layers to the fully connected
false positives nor adds additional constraints to prevent the    layers of the network, multiple times of inference over
occurrence.                                                       the same image are made to measure the segmentation
   Creating a deep neural network usually requires a huge         uncertainty. A similar approach was adopted by Gal et al.
amount of annotated data for model training. The manual           [43] who used multiple forward passes with dropout at the
annotation of data is not only a costly process but often         inference (Monte Carlo dropout) to obtain better uncertainty
prone to errors. To overcome this issue, transfer learning is     estimates for instance segmentation. Yang et al. [44] trained a
introduced to structural damage detection [29, 30, 31, 32].       set of fully convolutional networks iteratively and estimated
With transfer learning, only a relatively small dataset is        uncertainty and similarity from an ensemble of networks
needed to refine an existing deep network, which reduces the      to determine new data for annotation. The above-discussed
training time while keeping a good performance. Another           studies demonstrated that determining the most informative
way to tackle this annotation problem is to use semi-             samples for active learning is complex. Besides, uncertainty-
supervised learning that requires some labeled and some           based approaches can be prone to querying outliers [45].
unlabeled training data. Papandreo et al. [33] developed          Simple but effective methods for recommending new data
a method requiring a small number of strongly annotated           for annotation are greatly desired.
images and a large number of weakly annotated images for
training. They used an expectation maximization method to
                                                                  Methodology
generate the pixel-level annotation from weakly annotated
training data. Mittal et al. [34] proposed an approach that       The proposed method to create the assistive intelligence
relies on adversarial training with a feature matching loss       model for the multiclass bridge element segmentation is
to learn from unlabeled images. Some researchers used the         illustrated in Figure 1. First, a pre-trained Mask R-CNN
self-training, a wrapper based semi-supervised method [35],       has been chosen. Then, a small set of initial training data,
which starts training a network with only a few annotated         which are annotated by the inspector, is used to fine-tune
samples and then let the network automatically annotate           the network to transfer it for the new task of multiclass

Prepared using sagej.cls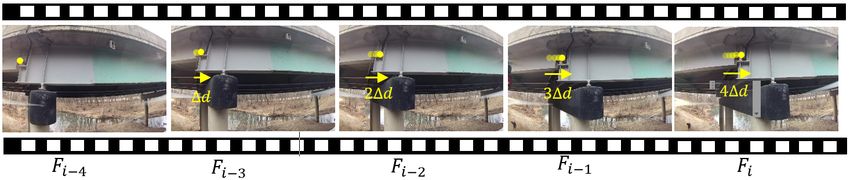
4 Journal Title XX(X)
Figure 2. The architecture of Mask R-CNN that performs the
Figure 1. Overview of the proposed S3 T method with
detection and segmentation of multiclass bridge elements.
human-in-the-loop.
Training the Mask R-CNN for the new task of multiclass
bridge element segmentation. The transferred network will bridge element segmentation from the scratch requires a
be improved iteratively until it achieves the satisfactory large volume of annotated data to achieve a satisfying
performance. The shaded portion in Figure 1 is the iterative prediction accuracy. This task does not have a large volume
process for performance boosting. In each iteration of the of annotated data for model training. To obtain high quality
semi-supervised self-training (S3 T) with human-in-the-loop, annotated data for this task requires the knowledge of
the network that has not reached the satisfied performance professionals in the domain of study. Only bridge inspectors
will be applied to an unlabeled testing dataset to obtain are confident in annotating bridge elements from the
the detection and segmentation results. Temporal coherence inspection videos. In this study, transfer learning is first used
analysis of the results is performed to recover false negative to tackle this challenge, which improves learning of the new
results that are hard data for the network. After that, a task by transferring knowledge from a related task that has
small set of the recovered hard data is selected as additional already been learned [46].
training data that are removed from the unlabeled testing The Mask R-CNN in this study was initialized by adopting
dataset. The additional training data is then split into two the ResNet-50 feature extractor [47] whose weights have
subsets, one has been automatically annotated by the network been pre-trained on the Microsoft COCO dataset consisting
trained from the current iteration and the other subset of more than 120,000 labeled images and around 1.5 millions
is manually re-annotated by the inspector. The additional of object instances in 80 categories [24]. Then, transfer
training data along with the initial small training dataset is learning was used to adapt this feature extractor to the setting
then used to re-train the Mask R-CNN in the next iteration of bridge inspection. Specifically, the ResNet-50 was fine-
to boost its performance. The S3 T method let the inspector tuned using a small set of training data (T0 ) with a portion
annotate selected samples that the current network failed to collected from the intended bridges of inspection. The detail
detect. Through learning from its weakness, the performance of the fine-tuning process will be presented in the next
of the network increases quickly after a few iterations. section.
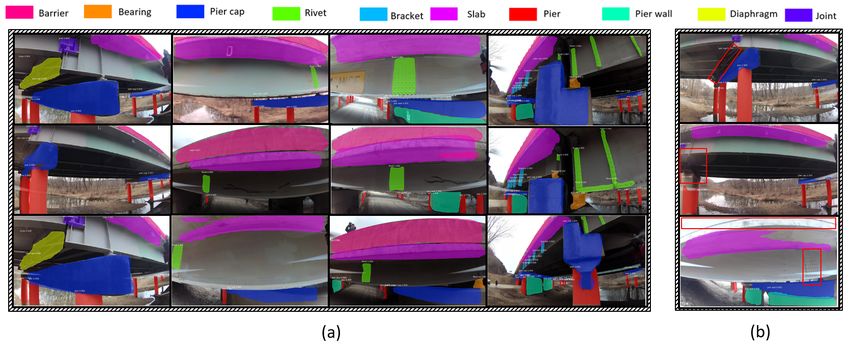
Temporal Coherence Analysis for Recovering
Adapting the Deep Neural Network to a New False Negative Results
Task Through Transfer Learning
Mask R-CNN is a static image detector in that it processes
This study chose a Mask R-CNN as the tool for detecting individual images independently. When it is applied to
and segmenting bridge elements from inspection video data. frames of a video stream, false negative results are likely to
Figure 2 illustrates the structure of the Mask R-CNN. Video happen due to sudden scale changes, occlusion, or motion
data are input into the network frame by frame following blur. This study used the temporal coherence information
their order on the timeline. The backbone of the network of objects in successive frames to recover false negative
is a feature extractor that generates the feature map of detections and segmentations.
each input image. A region proposal network (RPN) creates Consider a video clip that consists of a series of N frames,
proposal boxes named anchors and predicts the possibility indexed by i. In each frame the network returns Mi objects
of an anchor being a bridge element. Then, the RPN ranks with segmentations, indexed by j. An object in a frame is
anchors and proposes those most likely containing bridge highly likely to present in its neighboring frames within a
elements, which are termed RoIs. A layer named Region of range of displacement. Let, oi,j designate object j in frame
Interests Align (RoIAlign) extracts the region of interests i. The center of the bounding box for oi,j is specified by
(RoIs) from the feature map, aligns them with the input its coordinates Ci,j = (xi,j , yi,j ). In p frames, Ci,j may
image, and converts them into fixed-size region feature shift to a surrounding pixel within a spatial displacement
maps. The fixed-size feature maps of RoIs are fed into of p∆d where ∆d is the maximum displacement between
two independent branches: the network head branch that two consecutive frames. ∆d is affected by both intrinsic and
performs the classification and bounding box generation, extrinsic camera parameters, as the Appendix explains. ∆d is
and the mask branch that independently generates instance proportional to the focal length of camera and the maximum
masks. Readers interested in the detail of Mask R-CNN can displacement of the moving camera between capturing two
refer to the work by He et al.[28]. successive frames of image; it is inversely proportional to
Prepared using sagej.cls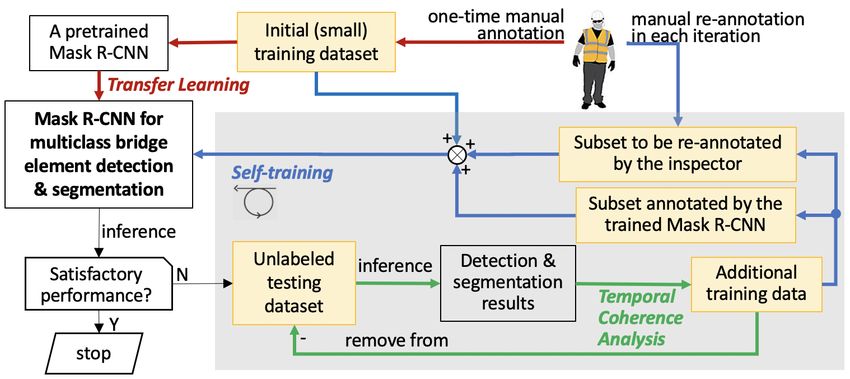
Karim et al.                                                                                                                     5

                                                                    Algorithm 1 Temporal Coherence Analysis for Recovering
                                                                    False Negative Results.
                                                                      // N : the number of video frames;
                                                                      // Mi : the number of objects in frame i;
                                                                      // Oi : the set of confidently predicted objects in frame i;
Figure 3. An illustration of spatial displacements.
                                                                      // Si,j : the prediction score of the jth object in frame i;
                                                                      // Ci,j : the center location of the jth object in frame i;
                                                                      // tl and tu : prediction thresholds;
the size of pixels in the images taken by the camera and the          // k: the number of frames that have stored temporal
distance of the camera to the object along the optical axis.          coherence information of predicted objects.
The study roughly estimated ∆d according to its formula
                                                                      for i = 1 to N do
in Eq. (5) using partial information and then improved
                                                                          for j = 1 to Mi do
the estimation experimentally by reviewing the inspection
                                                                             if Si,j ≥ tu then
data.A value of 60 pixels was found to be appropriate in this
                                                                                add object oi,j to the set Oi with its prediction
study. Figure 3 illustrates an example wherein a joint of the
                                                                                score, Si,j , and the center location, Ci,j
bridge in frame i − 4 is also shown in the succeeding four
                                                                             else if Si,j ≥ tl then
frames but with displacements.
                                                                                for q = 1, 2, ...(k − 1) do
   The algorithm of temporal coherence analysis for                                   ∃ oi−q,j 0 ∈ Oi−q & oi−q−1,j 00 ∈ Oi−q−1 ,
recovering false negative results is summarized as the
                                                                                      3 oi,j = oi−q,j 0 = oi−q−1,j 00
pseudo-code in Algorithm 1 and explained below. The                              if
prediction threshold is set as a range [tl , tu ]. An object                          &||Ci,j − Ci−q,j 0 ||2 ≤ q∆d
with a prediction score within this range is possibly a false                      &||Ci,j − Ci−q−1,j 00 ||2 ≤ (q + 1)∆d,
negative prediction. Let Si,j denote the prediction score for                   then
object oi,j . The network immediately returns a positive result                   let Si,j = (Si−q,j 0 + Si−q−1,j 00 )/2,
if Si,j ≥ tu and will not predict any object if Si,j < tl .                       add object oi,j to the set Oi with its Ci,j and
Let Oi be the set of confidently predicted objects in frame                       updated Si,j ,
i. The prediction score and the center location of these                          break
objects, {(Si,j , Ci,j )|oi,j ∈ Oi }, are the temporal coherence                end if
information for analyzing the succeeding k frames. That                      end for
is, k is the temporal window that defines the range of                     end if
preceding frames where the temporal coherence analysis                     Eliminate the low score (< tu ) object oi,j from the
searches the same objects as the weakly predicted objects                  candidate list.
(e.g., they are possibly false negative results) in the current         end for
frame. If tl ≤ Si,j < tu , the weakly predicted object oi,j is        end for
checked by referring to a pair of preceding successive frames
up to k − 1 times, starting from the nearest pair (frames
i − 1 and i − 2) to the farthest pair (frames i − k + 1 and
                                                                    the object. If k is too small, for example k = 1, the analysis
i − k). If an object of the same class as oi,j is found in
                                                                    does not fully utilize the temporal coherence information
both frames i − 1 and i − 2 (i.e., there exists oi−1,j 0 ∈ Oi−1
                                                                    of objects in successive frames. If the k value is too large,
and oi−2,j 00 ∈ Oi−2 such that oi−1,j 0 = oi−2,j 00 = oi,j ), and
                                                                    false positive results will be propagated to many frames.
the spatial displacements of oi,j from oi−1,j 0 and oi−2,j 00
                                                                    Based on the above-discussed facts, the study experimentally
are small, within ∆d and 2∆d, respectively, this weakly
                                                                    examined the selection of k and found a k value of 4 is
predicted object is determined as a false negative prediction.
                                                                    suitable in this study.
The false negative prediction is recovered by adding it to Oi
and updating its score to be the average score of Si−1,j 0 and         The range of detection thresholds for the temporal
Si−2,j 00 . Otherwise, oi,j is searched in Oi−2 and Oi−3 to         coherence analysis [tl , tu ] should be appropriately chosen.
determine if it is a false negative result that can be recovered.   The upper boundary tu should be high enough but not
This search will continue as needed. If oi,j is not found to be     extremely high to properly control both types of false results.
a positive result with confidence in the neighboring frames         The lower boundary tl should be below the upper boundary
after k − 1 times of temporal coherence analysis, it will be        with a sufficient span to capture most false negative results.
eliminated from the candidate list. Using a pair of frames as       Selecting an extremely small lower boundary just increases
the reference instead of referring to a single frame will make      the workload of temporal coherence analysis, but it has
the temporal coherence rule more strict and minimize the risk       minimal impact on the result due to the control effect of the
of progressively propagating a false positive result in a single    upper boundary. This study chose [0.5, 0.9] as the threshold
frame to the target frame.                                          range whose appropriateness was verified on small-scale
   The appendix has explained factors that impact the choice        experiments.
of ∆d. The choice of k is relevant to ∆d. Given that ∆d                The temporal coherence analysis identifies and picks up
is 60 pixels, an object may appear in a sequence of frames          samples that the current network fails to predict correctly.
because the dimension of images is way larger than 60 pixels.       Therefore, the proposed self-training method effectively
The object only appears in a short video clip and then it           learns from its weakness in each round of iterations. Since
disappears because the UAV brings the camera away from              this temporal coherence is applied in the inference stage,

Prepared using sagej.cls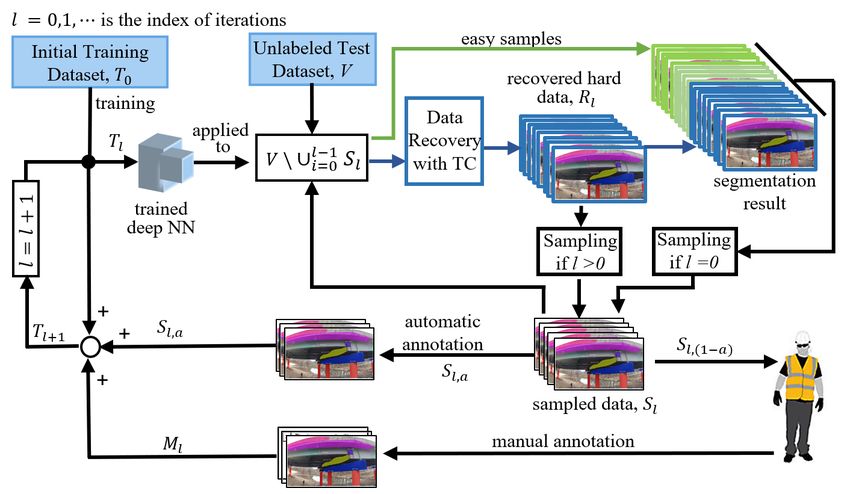
6                                                                                                              Journal Title XX(X)

Algorithm 2 Iteratively Fine-Tuning the Network with S3 T.
    // l: index of iteration;
    // Tl : the training dataset for iteration l;
    // V : unlabeled dataset for S3 T;
    // Rl : the recovered hard dataset from temporal coherence
    analysis;
    // Sl : a subset of Rl , which is sampled based on the
    sampling method SP(s);
    // Sl,α : a fraction of Sl in the size of α automatically
    annotated by the trained network;
    // Sl,(1−α) : a fraction of Sl in the size of 1 − α to be
    manually annotated by the inspector;
    // Ml : the data annotated by the inspector and added to the   Figure 4. Schematic diagram of the semi-supervised
    training dataset in iteration l.                               self-training (S3 T) for refining the Mask R-CNN model iteratively.
    for l ≥ 0 do
        Fine-tune the network with Tl ,
                                                                   portion of the prediction result is sampled as the additional
        break if the performance meets the requirement.
                                                                   training data, denoted as Sl . For the initial iteration when
        obtain Rl through the temporal coherence analysis,
                                                                   l = 0, this Sl is taken from all prediction result to guide
        if l = 0 then
                                                                   the network. In each iteration, the selected sampled data Sl
           sample Sl from the prediction result,
                                                                   is eliminated from V for the further assessment of future
        else
                                                                   networks. For the following iterations (i.e., l > 0), the S3 T
           sample Sl from Rl using the skip sampling method,
                                                                   algorithm differentiates hard samples from easy samples
        end if
                                                                   in V . Easy samples are segmented by the network with
        Split Sl into two mutually exclusive parts,
                                                                   relatively high reliability whereas hard samples, Rl , which
        manually annotate Sl,(1−α) to obtain Ml ,
                                                                   contain a variety of situations when objects are difficult to
        Tl+1 = Tl ∪ Ml ∪ Sl,α ,
                                                                   detect, are recovered by the developed temporal coherence
        increase α to lower the inspector’s workload in data
                                                                   analysis. The sample Sl (for l > 0) is selected only from
        annotation if applicable.
                                                                   the recovered hard samples Rl . Sl is divided into two
    end for
                                                                   mutually exclusive and collectively exhaustive subsets, Sl,α
                                                                   and Sl,1−α , where α and 1 − α indicate their sizes in
                                                                   proportion to Sl . Sl,α has been automatically annotated by
it is a computationally cheap approach for evaluating and
                                                                   the trained network in testing and directly added to the
sampling new data for annotation.
                                                                   training dataset. The inspector re-examines the remainder of
                                                                   Sl and corrects false predictions, if any, before adding the
Refining the Network Through Self-Training with                    inspector-annotated data Ml to the training dataset. That is,
Human-in-the-Loop                                                  at the end of the lth iteration the training dataset is updated
After transfer learning has initialized the Mask R-CNN for         per Eq. (1):
the task of bridge inspection, the network may need to be                             Tl+1 = Tl ∪ Ml ∪ Sl,α .                  (1)
further refined, for example, by adding additional training           The network is re-trained using the updated training
data. If the refined network has not reached a satisfying          dataset and the prediction result is assessed. If the
performance, the refining process will continue. To lower          termination criterion has been met, the fine-tuning process is
the cost of data annotation and, meanwhile, maintain a good        terminated. Otherwise, it continues refining the network. The
quality of the training data, the study chose the S3 T method      termination criterion of the iterative process is subject to the
that engages the inspector in continuous refinement of the         user’s choice considering the consequences of false positive
network. In each iteration, a set of unlabeled data is fed to      and false negative results, respectively. This study chose to
the trained deep neural network to be labeled automatically.       terminate the iterative process when both precision and recall
Using the temporal coherence information of predictions,           reach 90% or higher, and f1-score is 92% or higher, at the
hard samples are collected from this newly created labeled         Intersection over Union (IoU) value 0.5.
data. A representative subset of the hard samples is identified
                                                                      This iterative process has two designs: the method for
and added to the training dataset to refine the network. Before
                                                                   sampling Sl from Rl , and the way of determining the fraction
this subset is added to the training dataset, a portion of
                                                                   of Sl to be examined by the inspector.
it is manually re-annotated by the inspector to guide the
network’s learning. This process continues iteratively until       Skip Sampling Method, SP(s). Consecutive frames of a
the network performance reaches the target. The S3 T method        video are similar and, therefore, sampling a portion of frames
with human-in-the-loop is further summarized as the pseudo-        that are evenly distributed on the timeline would be sufficient
code in Algorithm 2.                                               for representing the video. This study samples Sl from Rl ,
   Let l denote the index of iterations. Figure 4 shows that a     for any iteration l, according to a skip sampling strategy
small training dataset T0 is created to transfer the Mask R-       SP (s) that samples a frame and then skips s frames. The
CNN. Then, the network is applied to an unlabeled dataset,         choice of a value for s needs to consider the inspection
V . If the performance of the network is not satisfying, a         platform’s speed and the camera speed. The unlabeled test

Prepared using sagej.cls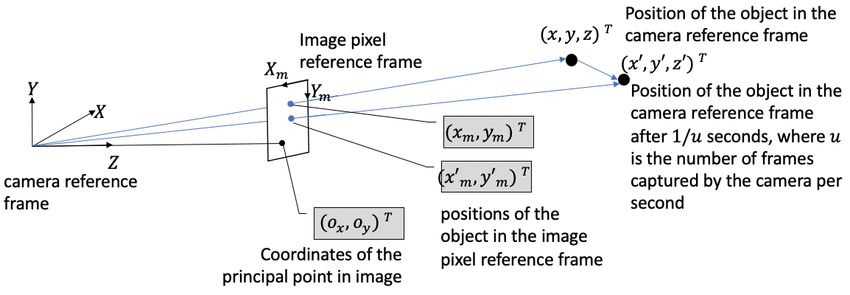
Karim et al.                                                                                                                      7

dataset V is a time series of Nv frames. ISP is a 1 × Nv
indicator vector of binary variables that define frames to be
sampled according to SP (s); that is,

                           ISP (n) = 1,                      (2)

for n = 1, 1 + (s + 1), . . . , 1 + (s + 1) bNv /(s + 1)c. IR,l
is also a 1 × Nv indicator vector of binary variables that
identify the frames recovered by the temporal coherence
analysis. The Hadamard product of IR,l and ISP yields the
vector IS,l ,
                    IS,l = IR,l ◦ ISP ,                     (3)
which identifies the frames to be sampled from Rl according
to SP (s) for forming Sl .
Regulating the Amount of Human Guidance in S3 T. A
fraction of the dataset Sl from any iteration is automatically
annotated by the trained network. The initial performance of
the neural network is not high and data mislabeled by the
network are present in Sl . Through examining a fraction of
Sl and correcting mislabeled data, the experienced inspector
guides the network to quickly learn new features. Sl,α is the
fraction of Sl which is added to the training dataset without
                                                                    Figure 5. Sample images with corresponding pixel-level object
further human annotation. The inspector’s guidance can be
                                                                    polygon with labels.
gradually reduced as the network starts to learn well by itself
and provide improved prediction. Therefore, the fraction of
automatically annotated data Sl,α can be gradually increased        objects and give pixel-level coordinates to those objects.
over iterations. Choosing the initial value of α is also critical   An unannotated dataset V that comprises 670 images from
as it regulates the amount of mislabeled data that may              the dataset D was particularly created for implementing the
enter the training dataset when the model performance is            S3 T method. V contains 5,916 objects from the 10 classes.
well below the target performance. Determining an optimal           A test dataset Ts has been created to evaluate the model
selection of α for the S3 T method is a research problem but        performance from each training iteration. This dataset has
going beyond the scope of this paper. The paper illustrates         212 images with 1,872 objects.
the impact of choosing α in Table 5.
                                                                    Initial Adaption. The proposed method was implemented
Implementation and Result Discussion                                by extending an existing implementation of Mask R-
                                                                    CNN by Matterport Inc. [50]. Training and testing were
This section illustrates the implementation and evaluation
                                                                    performed using two Nvidia Tesla V100 GPUs with 32GB
of the proposed method to create the assistive intelligence
                                                                    of memory. The pre-trained ResNet-50 feature extractor was
model for processing the bridge inspection video data.
                                                                    fine-tuned using the initial training dataset T0 . Different
Findings from this study are discussed.
                                                                    data augmentation techniques have been applied during the
                                                                    training stage to improve the model’s ability to generalize at
The Implementation Detail                                           various applicability where input data distortion is present.
The Data. BIRDS [48], an aerial inspection platform                 Those include horizontal flip, rotation, translation, color
developed by the INSPIRE University Transportation Center,          distortion, and random noise. The network head and the
was used to capture videos of bridges in inspection. The            mask head (see Figure 2) were trained for 30 epochs while
average speed of BIRDS is 20 miles per hour (mph). The              keeping all the parameters of the previous layers fixed. Each
frame rate of the camera is 30 frames per second (fps) and          epoch consists of 100 training iterations. Stochastic gradient
the image resolution is 3,840 × 2,160 in pixel. A dataset D,        descent was used as the optimizer and the momentum was
which is an inspection video of 4,440 images, was used to           0.9. The learning rate of 0.001 and a batch size of 4 were
develop and evaluate the assistive intelligence model. The          used in this training process that took about 21 minutes to
initial training dataset T0 contains 40 images, with 18 images      complete. According to Algorithm 2, after the Mask R-CNN
from D and 22 images from the inspection of other bridges.          is transferred to have an initial adaption to the task of bridge
Choosing some images of other bridges adds helpful data             inspection, V is annotated by this network. Considering
variation to the initial training dataset. In total, the initial    the performance of the initially adapted network, 8 images,
training dataset contains 482 objects with class labels, which      which are about 1% of the images in V , are selected and re-
are from 10 different classes of bridge elements interested         annotated by the inspector and added to the initial training
to inspect. The 10 object classes are barrier, slab, pier, pier     dataset T0 , becoming T1 , the training dataset for the next
cap, diaphragm, joint, bearing, pier wall, bracket, and rivet,      iteration. These 8 images are excluded from V for further
illustrated in Figure 5. This study used the image annotation       iterations. Letting the inspector to check a small amount
tool VGG Image annotator [49] to annotate labels of the             of the prediction result of the initially adapted network in

Prepared using sagej.cls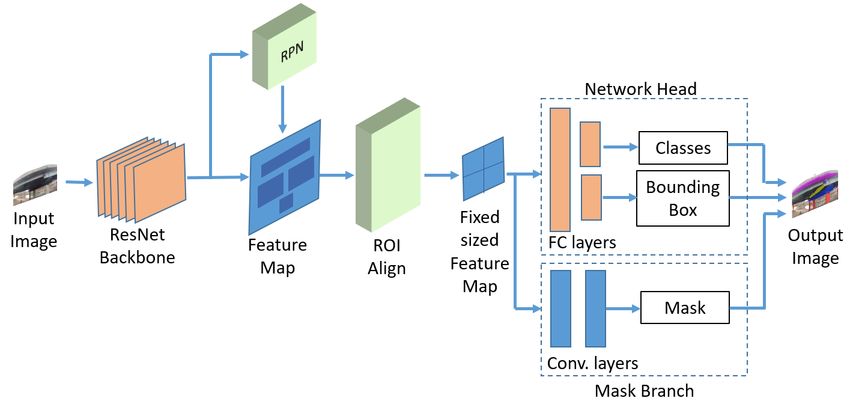
8                                                                                                              Journal Title XX(X)

Table 1. Data sizes (# images) in transfer learning (TL) and        Table 2. Performance (%) of transfer learning (TL) and
semi-supervised self-training (S3 T).                               semi-supervised self-training (S3 T) in iterations.
                                          TL          S3 T                                       TL             S3 T
           l : index of iterations         0     1        2    3                  Iteration, l     0      1       2        3
    Tl : training dataset (Eq. 1)         40     48     85    118          IoU
    Rl : recovered hard data samples       -    113     79     50                 Precision      87.5   86.3   94.0    93.45
    Sl : a sampled subset of Rl            -     37     33                 0.1    Recall         81.0   95.4   93.5    95.30
    α: % of Sl for automatic annotation    -   70%    80%
                                                                                  F1-Score       84.1   90.6   93.8     94.4
    Sl,α : automatically annotated data    -     26     26
                                                                                  Precision      87.1   85.7   93.9     93.5
    Ml : manually annotated data           8     11      7
                                                                           0.2    Recall         80.7   94.8   93.3     95.3
                                                                                  F1-Score       83.4   90.0   93.6     94.4
                                                                                  Precision      86.8   85.2   93.7     93.4
accordance with the performance is a practical approach to                 0.3    Recall         80.3   94.2   93.2     95.2
controlling the quality of the training dataset.                                  F1-Score       83.4   89.5   93.4     94.3
                                                                                  Precision      84.6   84.2   93.2     93.1
Inference and Iterative Refining. Table 1 summarizes the                   0.4    Recall         78.3   93.1   92.7     94.9
iterative training process for fine-tuning the deep neural                        F1-Score       81.3   88.5   93.0     94.0
network using the S3 T method with the inspector’s guidance.                      Precision      80.3   81.7   90.7     91.8
Refining the network for the 1st iteration of the S3 T method              0.5    Recall         74.4   90.3   90.1     93.6
was initiated with the last epoch of the previous iteration                       F1-Score       77.2   85.8   90.4     92.7
                                                                                  Precision      75.9   77.4   85.7     88.5
(i.e., the transfer learning) and continued for 20 more epochs.
                                                                           0.6    Recall         70.2   85.6   85.1     90.2
Then, the remainder of the dataset V , V \ S0 , is annotated by                   F1-Score       73.0   81.3   85.4     89.3
the refined network. Temporal coherence analysis is applied                       Precision      65.4   66.6   74.6     78.1
to V \ S0 , which contain objects with prediction scores                   0.7    Recall         60.5   73.6   74.2     79.6
between 0.5 and 0.9 to recover false negative results. This                       F1-Score       60.5   73.6   74.2     79.6
study considered 0.5 as the lower boundary of prediction                          Precision      43.7   43.8   50.1     49.0
threshold tl and 0.9 as the upper boundary tu , which were                 0.8    Recall         40.5   48.5   49.8     49.9
found to minimize the volume of false negative results based                      F1-Score       42.1   46.0   49.9     49.5
                                                                                  Precision       6.3    3.0    6.7      4.6
on numerical experiments. The temporal coherence analysis
                                                                           0.9    Recall          5.9    3.3    6.7      4.7
in the 1st iteration recovered 113 frames, and 37 frames of                       F1-Score        6.1    3.1    6.7      4.7
these were sampled according to SP(2), the sampling strategy
considered by this study. In this study, α was 70% in the
1st iteration, which means the inspector re-annotated 30%
                                                                    the predicted bounding box and the ground truth bounding
of S1 before adding them to the training dataset. In the 2nd
                                                                    box over the union of them. The ability of the network
iteration, the network was refined using the updated training
                                                                    to correctly detect objects was evaluated on a range of
dataset T2 and then it was used to evaluate V \ (S0 ∪ S1 ).
                                                                    IoU threshold values from 0.1 to 0.9 at a step of 0.1. The
Temporal coherence analysis recovered 79 images and 33
                                                                    precision, recall, and f1-score from evaluating the test dataset
images were sampled and added to the training dataset. α
                                                                    Ts are summarized in Table 2. From the table, it can be
was increased to 80% of S2 and the inspector annotated only
                                                                    observed that, given an IoU threshold value in the range of
7 images out of the 33 before adding them to the training
                                                                    [0.1, 0.5], the Mask R-CNN that was initially transferred
dataset. The iterative process was terminated after the 3rd
                                                                    in for the bridge of inspection achieved the precision from
iteration of training when the target performance is achieved.
                                                                    80.3% to 87.5%, the recall from 74.4% to 81.0%, and f1-
                                                                    score from 77.2% to 84.1%. The performance indicates the
Quantitative Results                                                transferred network demonstrated some adaptability to the
In this study, experiments were conducted to evaluate the           new task, but the amount of false negative detection is non-
merits of the proposed method, the job efficiency of the            negligible. The performance of the network has not reached
developed assistive intelligence model, and its generalization      a satisfying level.
capacity.                                                              Therefore, the network was iteratively refined using
                                                                    the proposed S3 T method with human-in-the-loop to seek
Object Detection Results. To evaluate the performance of
                                                                    further improvement. After being re-trained in the 1st
object detection with the developed deep neural network,
                                                                    iteration, the recall was effectively increased by 15%,
three standard evaluation matrices were used in this study:
                                                                    approximately. For example, when the IoU threshold value
      • precision: it counts the number of correct predictions      is 0.5, the precision increases from 80.3% to 81.7%, and
        out of the total number of predictions;                     recall becomes 90.3% from 74.4%, yielding a 85.8% f1-
      • recall: it counts the number of correct predictions out     score after the 1st iteration. The changes indicate that
        of total number of ground-truth objects;                    M0 , the additional small set of manually annotated hard
      • f1-Score: it is the harmonic mean of precision and          samples added to the training dataset, effectively improves
        recall.                                                     the ability to correctly detect more objects. The performance
                                                                    of the network has met the requirement after being refined
  This study used the Intersection over Union (IoU) to              for additional two iterations, reaching 91.8% precision,
determine whether a predicted object can be considered as           93.6% recall, and 92.7% f1-score at the IoU threshold
a correct prediction. The IoU is the intersection between           value 0.5. The S3 T method has effectively brought the

Prepared using sagej.cls
Karim et al. 9
performance of the network to a satisfying level. As the evaluation, the stricter the evaluation becomes. Accordingly,
IoU threshold value decreases gradually from 0.5 to 0.1 at The precision for each class can be calculated. After that,
a step size of 0.1, the evaluation becomes less conservative. the average of the class-level precision values, named mean
Consequently, fewer false negative detections are rendered precision and denoted as mP, is determined.
by the network but maybe more false positive detections. Figure 6 shows the curve of mP value during the iterative
On the other hand, selecting a higher IoU threshold value process for fine-tuning the network at four levels of mask IoU
makes the evaluation more conservative. As it increases threshold value, wherein the x-axis represents the number of
gradually from 0.5 to 0.9 at a step size of 0.1, the f1-score iterations and the y-axis represents the mP value. The plot
is diminishing, signifying the reduction of both precision shows the mP curve at the mask IoU threshold value 0.4
and recall values. In this application setting, false positive is an upwarding curve on the top of other curves. The mP
detections are less concerned than false negative detections. value at the end of the iterative process reaches 93%. When
This is because the inspector will retrieve and analyze frames the mask IoU threshold value increases to 0.5, the curve just
that contain detected and segmented objects that s/he wants drops slightly and the shape of the curve has no change. The
to inspect. Therefore, false positive detections can be found mP value at the end of the iterative process reaches 92%.
and eliminated by the inspector. But, false negatives are more However, with a larger mask IoU threshold value such as
critical because inspectors cannot overlook any potential 0.75, the mP curve clearly drops to a lower position. This
damages. From the analysis above, it can be inferred that is because the amount of true positive results at a larger
this S3 T method is very applicable to the development of mask IoU threshold value is low although the total number
the proposed assistive intelligence model for detecting bridge of correctly segmented objects increases over iterations.
elements from inspection videos.
Another important observation from the table is the
relationship between the IoU threshold value and the recall
value during the iterative process of network fine-tuning. A
variation of a recall value within a range of 6.6% has been
observed after the initial adaption through transfer learning
when the IoU threshold value increases from 0.1 to 0.5.
However, this variation reduces in each successive iteration.
For example, after the third iteration, this variation reduces to
1.6%. Precision and recall values at any of the IoU threshold
values increase over iterations and reach the maximum after
the 3rd iteration. For example, at the IoU threshold value 0.5,
f1 score increases about 8.6%, 4.6%, and 2.3%, respectively,
from their previous iteration. This means the network learns
new features from each iteration and gradually moves toward
Figure 6. The mean Precision (mP) over iterations at different
the learning limit. The improvement rate is diminishing
mask IoU threshold values.
during the iterative process. When the IoU threshold value
continues increasing from 0.5 and onward, the recall value in
any iteration drops rapidly and has been less than 10% when
the IoU threshold value is 0.9. Moreover, the increasing trend Efficiency of Transfer Learning. To demonstrate the high
of the recall value over iterations slows down quickly at the cost-effectiveness of transfer learning for the initial adaption,
IoU threshold value 0.6. When the IoU threshold value is this study trained a Mask R-CNN from the scratch using 144
greater than 0.6, the increasing trend of recall over iterations annotated images. Results of the comparison are summarized
is rapidly flatted out and becomes a decreasing trend. The in Table 3. The first 600 epochs for training the network
reason for this sharp decrease of recall value along with from scratch took 13.2 hours, and the network performance
the increase of the IoU threshold value is that the network (32.3% precision, 18.3% recall, and 23.4% f1 with an IoU
considers a detected object as a true positive detection only if threshold value 0.5) is well below the target performance
the overlap between the ground truth and the bounding box of when it was tested on the dataset Ts . The experiment
the detected object is very high, which increases the amount clearly demonstrates the network requires a huge number
of false negative detections and decreases the amount of true of training samples to be trained from the scratch, which
positive detections. is infeasible for developing the desired model of inspection
video data analysis due to the scarcity of labeled data. The
Instance Segmentation Results. The study also evaluated proposed transfer learning used only 40 annotated images
the quality of the proposed assistive intelligence model as the training dataset and took only 20 minutes to transfer
in segmenting bridge elements from inspection videos. the capability of an existing Mask R-CNN in multiclass
The mask Intersection over Union (IoU) is a measure of object detection and segmentation to the new task with
segmentation quality, which is the ratio of the overlap bridge elements. The performance of the transferred Mask
between the predicted segmentation mask and the ground R-CNN has a much better result (80.3% precision, 74.4%
truth mask to the union of these two masks. The predicted recall, and 77.2% f1 at the IoU 0.5). The comparison
segmentation mask is considered as a true positive prediction summarized in Table 3 demonstrates that transfer learning
if the mask IoU value is no less than a pre-specified reduced the training time by at least 95% and has improved
threshold. The higher the threshold value is selected for the the performance of the network tremendously.
Prepared using sagej.cls10 Journal Title XX(X)
Table 3. Cost-effectiveness of transfer learning in comparison ratio of model-annotated additional training data (α). If an
with training from the scratch. experiment yields satisfying model performance (i.e., both
Training Precision Recall F1 recall and precision are at least 90%, and f1-score is at least
time (hrs) (%) (%) (%) 92% at the IoU threshold value 0.5) within three iterations,
Training from scratch 13.2 32.3 18.3 23.4 the final performance is highlighted as bold.
Transfer learning 0.33 80.3 74.4 77.2 Experiment 1 is our approach in Tables 2 and 4. Compared
to experiment 1, experiment 2 let the inspector re-label more
data for the second and third iterations of training. It not
Comparison with a State-of-the-Art Method. This study only provided a satisfying performance at the end of iteration
compared the proposed approach (i.e., transfer learning plus 3 but increased the f1-score with a small margin over that
S3 T with human-in-the-loop) to the Mask R-CNN adapted from experiment 1. Compared to experiment 1, experiment
with transfer learning only and the traditional self-learning, 3 used less inspector-annotated additional training data for
from the perspectives of annotation time, training time, the third iteration. Although it does not achieve the target
inference speed, and accuracy. To show the reliance of the performance at the end of the third iteration, f1-score is
performance of the transferred Mask R-CNN on the volume just below the target by 0.1% a tiny margin. That is,
of training dataset, this study measured the performance the target performance is likely to be reached in the next
of the Mask R-CNN after independently transferred with iteration of training. Unlike experiments 1∼3 that are all
four random training datasets: 0.5% (22 images) , 1% self-training with human-in-the-loop, experiment 4 is the
(44 images), 5% (220 images) and 10% (440 images) of traditional self-training without human-in-the-loop. That is,
images in Dataset D. Results from the comparison are the model teaches itself by adding additional data to the
summarized in Table 4. It is observed that the transfer training dataset iteratively. The added new data are those
learning by itself can improve the performance of the with the most confident label prediction by the model. To
network, but the improvement is at a rapidly increasing make it a fair comparison, experiment 4 used the same
cost of annotation time. Transferring the Mask R-CNN amount of additional training data as experiment 1 in each
with 440 annotated images took 1430 minutes (i.e., 23.8 iteration except that the additional data for iterations 2
hours) for data annotation and 66 minutes for training. and 3 are all model-annotated. By the end of the third
This network achieves 89.7% precision, 92.3% recall, and iteration, the model performance is well below the target
91.0% f1 score, close to the performance of the proposed performance. The drop of the model performance from the
approach in this paper. The proposed approach reduces the first iteration to the second iteration, and the slow increase
annotation time by 85% with a comparable training time of the performance from the second iteration to the third
(only 6 minutes longer), and it achieves a better performance iteration, indicate including the inspector’s guidance in self-
(91.8% precision, 93.6% recall, and 92.7% f1 score). Self- training is critical.
training does not use the inspector guidance in the iterative The proposed S3 T method with human-in-the-loop
re-training process, thus saving about one hour of annotation (in experiments 1∼3) has tremendously improved the
time compared to the S3 T with human-in-the-loop. But the efficiency of model development as it is compared to the
performance is not satisfying. The inference speed of all supervised learning method (Mask R-CNNs in Table 4).
the models is 0.55 seconds per frame. This comparative Its performance improvement has a large margin over the
study demonstrated that the S 3 T method with human-in-the- traditional self-training (in experiment 4). Further optimizing
loop is more cost-effective compared to directly transferring the engagement of inspectors in self-training has just
the Mask R-CNN. It also significantly improves the model incremental improvement against the heuristic strategy of
performance compared to traditional self-training, due to the this paper.
engagement of experienced inspectors in the iterative re-
training process. The impact of human-in-the-loop on self- Job Efficiency of the Assistive Intelligence Model. A full
training is further examined. image usually contains multiple elements of the bridge. An
inspector needs to search and find all the elements, segment
The Impact of Human-in-the-Loop on Self-Training. The each identified element by marking its boundary, and provide
S3 T method that keeps human-in-the-loop is a combination the object name. On average, each image in this study
of self-training and active learning. The portion of additional contains 15 objects of different sizes and shapes. To provide
training data re-annotated by experienced inspectors in better quality, a polygon rather than a rectangle is preferred
each iteration of the self-training process may impact the for segmenting identified bridge elements. Drawing a tight
efficiency of model development and the performance of the polygon on a single object may require defining 15∼30
resulting final model. This study used four experiments to points on the image. On average, it took around 3.25
illustrate the impact of human-in-the-loop on self-training, minutes to detect and manually segment bridge elements
which are summarized in Table 5. The four experiments in a full image in this study. Not to mention that issues
all began with the same initial model whose performance related to human factors, such as the fatigue developed
is 80.3% precision, 74.4% recall, and 77.2% f1-score. In from repeatedly working on high cognitive tasks, further
all the experiments the model is trained for three iterations. lengthen the time required for manually analyzing the big
Inspectors annotated eight images to re-train the initial model video data collected from bridge inspection. The approach
for the first iteration. With this iteration, the performance that this paper proposes requires inspectors to analyze a
is increased to 81.7% precision, 90.3% recall, and 85.8% small amount of data manually, helping the network achieve
f1-score. After that, the four experiments differ in the satisfying performance in object detection and segmentation.
Prepared using sagej.clsYou can also read