A Smart Approach to Technology Investment - Capital Raising Presentation April 2021 - Bailador

Page created by Joe Ortega
 
CONTINUE READING
A Smart Approach to Technology Investment - Capital Raising Presentation April 2021 - Bailador
A Smart Approach to Technology Investment

Capital Raising Presentation
April 2021

Bailador Technology Investments Limited (ASX:BTI)
A Smart Approach to Technology Investment - Capital Raising Presentation April 2021 - Bailador
Bailador provides investors with exposure to
        expansion-stage technology companies with
        global addressable markets and a
        high growth trajectory

Investors get access through an ASX traded share [ASX:BTI]

                                                             2
A Smart Approach to Technology Investment - Capital Raising Presentation April 2021 - Bailador
The Bailador founders are seasoned investors with an excellent track record

  David Kirk                                                             Paul Wilson
  Co-Founder & Partner                                                   Co-Founder & Partner
  •   Former CEO of Fairfax Media (led the acquisition of Trade Me and   •   Former Director of CHAMP Private Equity, and previously MetLife
      Stayz.com)                                                             (London and New York) and Executive Director of Illyria
  •   Chairman of Kathmandu [ASX:KMD]                                    •   Excellent investment track record (IRR >30% p.a. over 20 years)
  •   Former Captain of the All Blacks, Rhodes scholar to Oxford and     •   Director of Vita [ASX:VTG] and Rajasthan Royals (IPL Cricket)
      policy advisor to the NZ Prime Minister                            •   FINSIA Fellow, Chartered Accountant and Member of AICD
  •   Doctor – MBChB (Otago)                                             •   Director of Bailador portfolio companies SiteMinder, Straker
  •   Director of Bailador portfolio companies Instaclustr, SMI and          Translations [ASX:STG] and Stackla
      Rezdy

                                                                                                                                               3
A Smart Approach to Technology Investment - Capital Raising Presentation April 2021 - Bailador
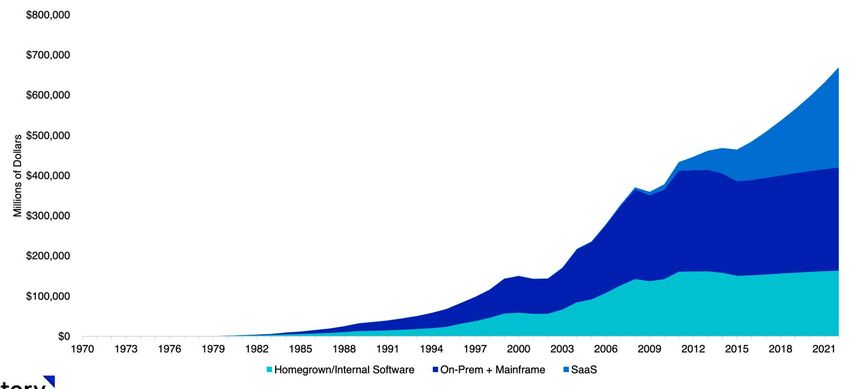
Bailador invests in high growth private technology companies

        INFORMATION TECHNOLOGY FOCUS

                                          PRIVATE COMPANIES

                     $5 - $50M REVENUE

                                          PROVEN BUSINESS MODEL

        GLOBALLY ADDRESSABLE MARKETS

                                          MINORITY PROTECTIONS AND BOARD
                                          REPRESENTATION

                                                                           4
A Smart Approach to Technology Investment - Capital Raising Presentation April 2021 - Bailador
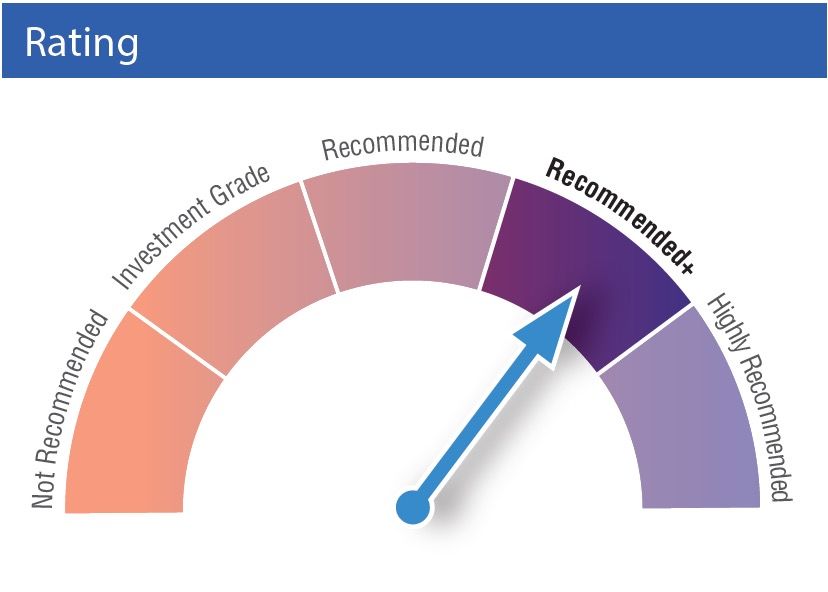
Expansion-stage investing has the most attractive risk/reward balance

                                                    Less
                                                   upside

                GROWTH

                           Higher
                            risk

                         EARLY STAGE   EXPANSION   MATURITY
                                         STAGE

                                        TIME

                                                                        5
Our business model is designed to generate premium returns

             INVESTING               GROWING              REALISING

        Diligence hundreds of      Partner with       Prepare businesses
            opportunities to    management to scale     for sale or IPO
            select the best          globally

                                                                           6
Bailador provides access to quality
expansion stage technology companies at
attractive valuations before they are public

                                               7
Bailador has a well-established portfolio of high growth tech companies

                                                          $294m                                             The portfolio has critical mass
                                                                                                            ⇢ Only three SaaS companies listed on the ASX have greater
                                                 portfolio company revenue2                                   revenue than the combined Bailador portfolio

                                                               10%                                                          25%                                        Revenue growth ex-travel is strong
                                                                                                                                                                       ⤏ Our travel industry companies are

       10                                                 portfolio company
                                                           revenue growth3
                                                                                                                  portfolio company
                                                                                                              revenue growth (ex-travel)4
                                                                                                                                                                         outperforming peers & we expect growth
                                                                                                                                                                         to pick up as travel increases

     investments1
                                                             >75%                                           Revenue generation is at premium margins

                                                              gross margin3

                                                                86%                                         Recurring revenue provides an attractive solid base

                                                          recurring revenue3

       Note: 1As at 31 December 2020. 2Revenue for the year ended 31 December 2020 for the underlying companies in the BTI portfolio. 3Based on revenue for the year ended 31 December 2020 and weighted based on carrying value in the portfolio.
       4 Excludes SiteMinder and Rezdy.                                                                                                                                                                                                              8
Bailador’s portfolio companies are addressing huge global markets
                                             …meaning these companies can grow to be very large, very fast

       >70%
                                                                                                                       of portfolio revenue is
                                                                                                                       generated in markets
                                                                                                                       outside of Australia

       Note: Based on revenue for the year ending 31 December 2020 and weighted based on carrying value in the portfolio.
                                                                                                                                                 9
Bailador favours Software-as-a-Service (SaaS) and Marketplace business models

         SaaS                                                      Marketplace                    Data                  Digital
         80%                                                          12%                         6%                    Retail
                                                                                                                         2%

                                                                                CHARACTERISTICS

    Predictable recurring                                      Efficient scalability       Measurable metrics   Ability to address global
    revenue streams                                                                                             market opportunities

          Note: Percentage of BTI portfolio value as at 31 March 2021.
                                                                                                                                            10
Global software revenue has exploded in the last 20 years

                                                                                                                                       SaaS is
 Global software industry revenue

                                                                                                                                     dominating
                                                                                                                                      software
                                                                                                                                      industry
                                                                                                                                       growth

                                    Source: Neeraj Agrawal & Logan Bartlett, Battery Ventures, Software May 2019. Note: Homegrown/Internal Software is estimated based on hours worked.
                                                                                                                                                                                          11
The SaaS model enables global reach from anywhere in the world

                SAAS CHARACTERISTICS                            AUS/NZ SAAS EXAMPLES

                                                                        Market cap   Revenue
 •   Build one software platform
                                                                          (2020)     multiple
 •   Sell it thousands of times on subscription model
 •   Recurring monthly or annual licence revenue                       USD$52.7bn     30.2x
 •   High gross margins - typically 80%+
 •   Cost to serve additional customers is minimal, so                   $18.6bn      24.1x
     additional margin drops to the bottom line
 •   Highly scalable:
      •   One central development team, usually in a low cost             $9.4bn      19.8x
          location
      •   Unit economics can apply to any market
                                                                          $3.5bn      13.1x

Australia and New Zealand have already produced notable successes in SaaS
  but this is the tip of the iceberg of emerging Australian SaaS companies
             Source: Factset Market data as at 31 March 2021.
                                                                                                12
Case Studies

               13
45%          O F B T I N TA 4

                                                                                                                                                                                          LTM Revenue

SiteMinder is the world leader in connecting hotels to online
distribution channels for accommodation bookings
•   Surpassed $1bn valuation in January 2020 with investment from renowned                                                                                                                      20.2x
    global and Australian investors including BlackRock Investments
•   The leading global SaaS hotel demand generation platform – triple the size
    of nearest competitor and a massive addressable market of 1 million hotels
•   $100m+ Annualised Recurring Revenue via subscription revenue model                                                                               Bailador Entry (FY12)¹                                             Feb-21
•   Exhibits resilient characteristics of SaaS revenue model and is valued as a
    premium SaaS business                                                                                                                            Carrying Value June 30 $82.5m + Realised Cash $14.9m
•   Managed performance prudently during COVID - currently EBITDA
    profitable and investing in product growth                                                                                                                                                                           $97.4m
                                                                                                                                                                                                                                     $9.9m2
                                                                                                                                                                                                                                     $5.0m3
•   Revenue from >160 countries with 80% of revenue from international                                                                                                                                                   $82.5m
    markets with a skew towards the more robust leisure market                                                                                                                                  19.3x
•   BTI realised a small portion of its investment in January 2020, delivering
    $9.9m in cash at a multiple of 21.2x cost, representing an IRR of 50.5%
                                                                                                                                                                  $5.0m
•   Total cash realised for Bailador’s investment in SiteMinder is now $15m
                                                                                                                                                            Original cost¹                                          Carrying value +
•   Strong IPO candidate – likely priority offer for BTI shareholders
                                                                                                                                                                                                                     realised cash
               Note: 1Entry of Bailador prior to formation of listed BTI entity. 2$9.9m cash realisation completed in January 2020. 3$5.0m cash realisation completed in December 2015. 4NTA as at 31 March 2021.
                                                                                                                                                                                                                                                    14
Subscription business has materially outperformed other companies in the travel sector

       Travel Sector
       Travel Sector12-month
                     12-monthPerformance1 1
                              Performance                                                                            • Travel Sector Revenue materially down in the
                                                                                                                       last 12 months
                                                                 +9%                                                 • Capital markets have looked through that
                                                                                                                       revenue decline to actually value travel
                                                                                                                       companies more highly than a year ago
                                                                                                                     • SiteMinder has experienced flat revenue
                                                                                                                       growth over the last 12 months, materially
                                                                                                                       outperforming the broader travel sector
                                                                                                                          ⤑ However, Bailador has held the SiteMinder
                                                                                                                            valuation constant
                                                                                                                     • SiteMinder is positioned for rapid growth as
              -55%
                                                                                                                       travel volumes increase
        Average revenue                       Average Enterprise Valuation

          Note: 1Travel Sector performance over the 12-months to 31 December 2020. Travel Sector companies include Booking Holdings, Expedia Group, Trip.com Group, MakeMyTrip, Webjet Limited, eDreams, On the Beach Group, Despegar.com,
          lastminute.com, HolidayCheck Group, TripAdvisor, Trivago, Amadeus, Sabre and TravelSky.                                                                                                                                            15
– Valuation of comparable SaaS businesses
                                                                                      ($100M+ Revenue, 20%+ Growth, 70%+ Gross margin)

                                                                                          Peer Median = 19.8x
                                                                                                                                                                         Having passed
                          SiteMinder1                                                                                                                                      $100m ARR,
                                                                                                                                                                           SiteMinder is
                          Wisetech                                                                                                                                        moving into a
                                                                                                                                                                        different category
                                                                                                                                                                          of comps with
ASX                       Altium
                                                                                                                                                                        higher valuations
Listed
                          Xero

Australian
                          Canva
Private Co.
                          Pager Duty

US                        Smartsheet
SaaS2
(Listed)
                          ZScaler

EV/LTM Revenue Multiple 5x                                      10x                  15x                   20x                  25x                   30x   35x   40x         45x

           Note: 1Valuation multiple implied by BTI Carrying value as 31 March 2021 NTA. 2US listed SaaS companies with LTM Revenue of US$100-200m.
           Source data: Factset data as as at 31 March 2021, Company Filings, News Reports, Bailador Analysis.                                                                               16
Database management                                                                               Typical Enterprise Technology Stack
Instaclustr is a platform that manages database technologies, empowering clients to deliver
big data applications at scale.

Use of data – fast growing and complex                                                                              Interfaces
The volume of data generated in the modern world is massive and growing. It is a critical and
complex part of an enterprise technology stack.
                                                                                                                  Applications
Corporates require multiple databases
Data is at the heart of operations for many large corporates. These corporates often require
multiple databases to meet their needs, but may not wish to invest internal resources to
                                                                                                                       Data
become experts in all of those database technologies.

Outsourcing is the natural solution
Outsourcing some database management makes sense for those corporates.                                           Infrastructure
⤏ Allowing clients to scale data solutions efficiently; and
⤏ Allowing clients to focus on their core business and grow their own customer base.
                                                                                                • Instaclustr sits within the data layer of the tech stack
Instaclustr is a world leader in managing database technologies                                 • The data layer is fast becoming the most critical and
Instaclustr is a leader in managing five open source technologies on a proprietary tech           valuable piece of a company’s technology stack, but
platform. It provides expert management and support to those technologies:                        is also the most complex to manage and scale
                                                                                                  effectively

                                                              Elasticsearch   PostgreSQL

                                                                                                                                                             17
Exponential Growth in the                                                                                                       A Large Addressable Database
                                                                                        Increased Open Source Adoption
               Global Datasphere                                                                                                            Management Software Market
                                                                                       Open Source Database (% of Total Databases)
     Size of the Global Datasphere (Zettabytes1)                                                                                                   Global Database Market (US$Bn)
                                                                        138                                                                                                              173
                                                                                                                       49%
                                                          112
                                                                                                                                                                                 124
                                             89                                                         35%
                                                                                                                                                                104
                               74
                                                                                                                                              79
                   56
       43

    2019A       2020E        2021E        2022E         2023E         2024E                         2013A              2020E                2019A              2023E             2025E   2030E
Source: Worldwide Global Datasphere forecast (2020-2024), IDC and Data Age 2025,    Source: DBEngines                                 The Business Research Company, July 2020
IDC- Seagate Whitepaper for 2024

             Big data driving demand for                                                                Supported by:                   Need for instantaneous scaling of big data
        technologies to process and store data                                             Increasing cloud adoption, particularly   applications with limited investment in hardware.
                                                                                              within public cloud environments         Increased outsourcing of complex operations

                          Note: 1One zettabyte is equal to one trillion gigabytes
                                                                                                                                                                                                 18
– Key Investment Highlights
1. A proprietary multi tech platform

2. Substantial industry tailwinds
   ⇢ Big data driving demand for technologies to process and store data
   ⇢ Applications and databases moving to the cloud
   ⇢ Growing adoption of open-source technologies
3. Long term blue-chip customer relationships

4. Highly attractive financial profile – 90% of revenue is recurring in nature

5. Net revenue retention rates > 100%

6. Extremely attractive characteristics of huge growing addressable market

7. Highly experienced management team

8. Strong IPO candidate – likely priority offer for BTI shareholders

                                                                                 19
Instaclustr’s comparables show sector dynamics being appreciated by the market
                                            …but not yet factored into BTI’s Instaclustr valuation
                                                                                                                                                          Peer Average = 20.2x

                          Instaclustr1

                          Elastic

   Global Infra
   Software               MongoDB
   (Listed)
                          US Infra Software2
                          (median)

                          Megaport
   AU SaaS
   (Listed)               ASX high-growth SaaS3
                          (median)

    EV/LTM Revenue Multiple                           0x                           5x                          10x                          15x                         20x                          25x                          30x

              Note: 1Valuation multiple implied by BTI Carrying value as of 31 March 2021. 2US infrastructure sector SaaS companies include Datadog, Servicenow, Splunk, Dynatrace and vmware. 3ASX SaaS companies include Xero, Wisetech, Altium,
              TechnologyOne, Megaport, Nearmap, Elmo, Volpara, Infomedia, Class, Pro Medicus and Damstra. Source data: Factset data as of 31 March 2021, Company Filings, News Reports, Bailador Analysis.                                           20
News

       21
DocsCorp exit announced in February 2021
- 30% IRR on investment
- 3.4x cost
- 55% uplift on exit

                                                                                                                            19%
                                                                                                                                                         55%
                                                                                    23%
                                49%

         $5.0m
        (July 2016)
                                                   $7.5m
                                                   (June 2017)
                                                                                                     $9.2m
                                                                                                       (June 2018)
                                                                                                                                     $10.9m                          $17m1
                                                                                                                                       (June 2019)                   (February 2021)

   Original Investment                  12 Month Revaluation                               12 Month Revaluation                   12 Month Revaluation               Full cash exit

                                                                                                                                                               = valuation uplift

              Note: 1The final sale price remains subject to customary post-completion adjustments and transaction costs.
                                                                                                                                                                                       22
– The DocsCorp and Bailador partnership

                                 The cash realised for DocsCorp is an uplift on the returns                                                        Working With Management
                                  implied by internal valuations during BTI’s hold period
                          $18m                                                                                                     Over the five-year partnership Bailador was instrumental in:
                                                                                                                     RR
                                                                                                                   %I
                                                                                                              30
                                                                                                         t=
                          $16m
                                                                                                 n   exi                              • Focusing the business on sales effectiveness, unit
                                                                                             rno
                                                                                         Re
                                                                                           tu                                           economics and growth that delivered operating leverage
                          $14m

                                                                                                                                      • Introducing a right-sized board and governance
DocsCorp carrying value

                          $12m
                                                                                                                                        structure that guided the strategic direction of the
                          $10m                                                                                                          business within a strong commercial decision making
                                                                                                                                        framework
                          $8m
                                                                                                      ns
                                                                                          eva l uatio                                 • Developing comprehensive reporting capabilities
                                                                                     nal r
                          $6m
                                                                            m   inter
                                                                      n fro                                                             focussed on the key SaaS performance metrics which
                                                                 Retur
                          $4m                                                                                                           drive business performance

                          $2m                                                                                                         • Ensuring DocsCorp was prepared for a sale opportunity
                                                                                                                                        with audited financial statements and high quality
                           $m
                             Jul-16   Jan-17   Jul-17   Jan-18      Jul-18   Jan-19     Jul-19    Jan-20       Jul-20     Jan-21        management reporting
                                      = Bailador Revaluation             = Third Party Valuation & BTI Cash Realisation

                                                                                                                                                                                                  23
Instaclustr valuation uplift in March 2021
   - Effective 65.9% IRR on investment
   - 9.0x cost

                                                                                                          49%
                                                                                    42%
                                                            30%
                                     58%
               106%

   $4.5m
   (Nov 16 /
                        $9.3m
                        (Nov 2017)
                                           $14.6m
                                            (August 2018)
                                                                   $19.0m
                                                                    (August 2019)
                                                                                          $27.1m                       $40.4m
    Mar 17)                                                                               (August 2020)                   (March 2021)

 Original             12 Month             Third Party            12 Month                12 Month                       March 2021
Investment            Revaluation          Investment             Revaluation             Revaluation                    Revaluation

                                                                                                                = valuation uplift

                                                                                                                                         24
Lendi cash realisation in Q2 CY2021*
- 21% IRR on investment*
- 2.4x cost*                                                                                                                                                                                                                    = valuation uplift

- 21% uplift on realisation*                                                                                                                                                                                21%
                                                                                                                                                 18%
                                                                                        32%
                                 42%

         $5.5m                                       $7.2m                                                   $9.5m                                                 $11.2m                                                  $13m*
         (May 16 /                                                                                         (December 2017)                                         (November 2018)                                           (~Q2 CY 2021)
                                                     (May 2017)
          May 17)

                                                                                                                                                                                                  $0.4m          CASH
                                                                                                                                                                                                                 REALISATION

  May 2016 & 2017                      May 2017                                                 December 2017                                            November 2018                                            Q2 CY2021
  Original Investment                  Third Party Investment                                   Third Party Investment                                   Third Party Investment                                   Full cash realisation
  • BTI invested $4.0m                 • BTI increased the value of its                         • BTI increased the value of its                         • BTI increased the value of its                         • BTI has received confirmation that
    in Lendi in May 2016                 investment based on the                                  investment based on the                                  investment based on the                                  it will realise $13m in cash
    and a follow on                      third party valuation                                    third party valuation                                    third party valuation                                    proceeds (subject to conditions*)
    investment of $1.5m                  established as part of Lendi’s                           established as part of                                   established as part of a                                 via a share sale facility established
    in May 2017                          May 2017 capital raise                                   Lendi’s December 2017                                    secondary liquidity facility                             as part of the Lendi/Aussie merger
                                         supported by other existing                              capital raise supported by                               established by Lendi                                   • This represents a $2.3m* carrying
                                         shareholders                                             blue-chip Australian                                   • Realised $0.4m cash as part                              value increase or the equivalent of
                                                                                                  institutions                                             of this facility.                                        $0.02* per share (pre-tax)

             *The final Lendi valuation and cash realisation is conditional upon the timing and successful completion of the Lendi/Aussie merger transaction which is subject to certain condition precedents.
                                                                                                                                                                                                                                                            25
Bailador has delivered eight partial or full cash realisations

              Cash $5.0m                                            Cash $1.2m                                             Cash $0.4m                                               Cash $2.0m
               7.2x cost                                             1.7x cost                                              2.8x cost                                                2.1x cost
               71.1% IRR                                             21.5% IRR                                              35.4% IRR                                                25.0% IRR
           December 2015                                            October 2018                                        December 2018                                                July 2019

              Cash $9.9m                                            Cash $1.1m                                              Cash $17m                                               Cash $13m
               19.3x cost                                            0.05x cost                                              3.4x cost                                               2.4x cost
               50.5% IRR                                                                                                    30.0% IRR                                                21% IRR
              January 2020                                         February 2021                                          February 2021                                             April 2021*

        * Bailador realisation of 100% of Lendi investment confirmed on 21 April 2021, however remains subject to successful completion of Lendi’s merger with Aussie Home Loans.
                                                                                                                                                                                                  26
Outlook

          27
Bailador expects more profitable cash realisations in 2021

                                                                        REINVESTMENT
                                                                                                         1
                 FRANKED DIVIDENDS
                                                                                                                                                                                                   Key
                                                                                                                                         2
    2021 exits                                                                 4
                                                                                                                                                                                                 1        Early stage

                                                                                                                                                                                                 2        Mid stage
      (FEB-21)                                                                                                                                                                                   3        Advanced stage

                                                                                                                                                                                                 4        Cash realisation
                                                                                                                           3
      (FEB-21)

                                                                                                                                                                                                  Partial cash realisation

      (APR-21)

           Note: Bailador realised its investment in Viostream in early February 2021. Bailador agreed to sell its investment in DocsCorp on 24 February 2021. Bailador realisation of 100% of Lendi investment confirmed on 21 April 2021, however remains
           subject to successful completion of Lendi’s merger with Aussie Home Loans.                                                                                                                                                                         28
Bailador March 2021 NTA and pro-forma April 2021 NTA

                                                         VALUATION ($m)                                                     NTA PER SHARE ($/share)

                                      MAR-21               PRO-FORMA                 APR-21                   MAR-21               PRO-FORMA                APR-21                THIRD PARTY                      NEXT VALUATION
 PORTFOLIO COMPANY
                                     (ACTUAL)                MVMT                (PRO-FORMA)                 (ACTUAL)                MVMT               (PRO-FORMA)              TRANSACTION                           REVIEW

                                        82.5                       -                   82.5                     0.67                       -                  0.67                        ✓                                 June 2021

                                        40.4                       -                   40.4                     0.33                       -                  0.33                                                     March 2022

                                        11.5                       -                   11.5                     0.09                       -                  0.09                                                  September 2021

                                        10.7                     +2.3                  13.0                     0.09                   +0.02                  0.11                        ✓                             n/a - exited

                                         9.6                       -                    9.6                     0.08                       -                  0.08                                                          June 2021

                                         9.4                     +0.9                  10.32                    0.08                   +0.01                  0.09                        ✓                 Mark to market each month1

                                         5.7                       -                    5.7                     0.05                       -                  0.05                                                          June 2021

                                         3.0                       -                    3.0                     0.02                       -                  0.02                        ✓                           October 2021

  Cash                                  17.1                     -0.9                  16.2                     0.14                    -0.01                 0.13

  Other                                 -4.6                     +0.1                  -4.5                     -0.04                      -                  -0.04

  Total NTA                            185.3                    +2.3                  187.6                     1.51                   +0.02                  1.53

    Valuations are marked to market at third party transactions, then reviewed 12 months following
              Note: Pre any capital raise. NTA as at 31 March 2021 and pro-forma NTA as at 30 April 2021. 1Straker valuation marked to market as at end of month. 2Based on Straker closing share price on 26 April 2021.
              Denotes valuation review in next six months. Denotes change to valuation in current month.                                                                                                                                 29
The portfolio is positioned for further gains across a number of companies
  Portfolio Company                 Valuation1                           %NTA                   Comment

                                                                                                •      Strategic position strengthened
                                       $82.5m                              45%
                                                                                                •      Strong 2021/22 IPO candidate - likely priority offer for BTI shareholders
                                                                                                •      Likely follow-on investment (
Our NTA valuations are validated by third party transactions

There have been 23 third party
transactions in our portfolio companies.
                                                                                                                     145%
All transactions have been at or above                                                                                                          122%                        121%
                                                                                                                                                                                                      100%                      105%

BTI carrying value.
                                                                                                    Carryi ng      3rd party    Carryi ng      3rd party    Carryi ng      3rd party    Carryi ng   3rd party    Carryi ng    3rd party
                                                                                                     value        transaction    value        transaction    value        transaction    value     transaction    value      transaction
                                                                                    2015                        2015                        2016                        2016                    2016

                                                               143%                                                                                                                                                             158%
                                                                                                                                                 128%                        132%
              105%                     100%                                                100%                       100%                                                                            100%

Carryi ng   3rd party    Carryi ng   3rd party    Carryi ng   3rd party    Carryi ng   3rd party    Carryi ng   3rd party       Carryi ng   3rd party       Carryi ng   3rd party       Carryi ng   3rd party    Carryi ng   3rd party
 value     transaction    value      valuati on    value     transaction    value     transaction    value     transaction       value     transaction       value     transaction       value     transaction    value     transaction
        2016                     2017                     2017                     2017                     2017                        2017                        2017                        2018                     2018

                                                                                                                                                                                                      155%
                                                                                                                                                 127%                                                                            121%
             111%                       118%                   114%                        100%                       100%

Carryi ng   3rd party    Carryi ng   3rd party    Carryi ng   3rd party    Carryi ng   3rd party    Carryi ng   3rd party       Carryi ng   3rd party       Carryi ng    3rd party      Carryi ng   3rd party    Carryi ng   3rd party
 value     transaction    value     transaction    value     transaction    value     transaction    value     transaction       value     transaction       value      transaction      value     transaction    value     transaction
        2018                     2018                     2018                     2019                     2019                        2019                         2021                       2021                     2021

                                                                                                                                                                                                                                           31
Portfolio valuation uplift driven largely by third party transactions

Bailador will examine internal                                                    Contribution to portfolio valuation
                                                                      $200m
revaluation of investment
positions if it has been 12 months
since a third party transaction.
                                                                      $150m
Those revaluations have proven
conservative with third party
transactions providing further
valuation uplift.                                                     $100m

                                                                      $50m

                                                                        $m
                                                                              Cost¹             Internal revi ews   Third party transactions

         Note: 1Cost is the total original cash cost of investment.
                                                                                                                                               32
The growth in carrying value of BTI’s investments is conservative in
comparison to the revenue growth in the portfolio

                                  Revenue
                             Revenue                                                                                                           Carrying
                                                                                                                                           Carrying Value Value

                                                                              Portfolio
                                                                              revenue has
                                                                              increased by
                         4.0x
                                                                              4.0x…
                                                                                                                                                                                  …but BTI has
                                                                                                                                                                                  only recognised
                                                                                                                                              2.5x
                                                                                                                                                                                  a value
                                                                                                                                                                                  increase of 2.5x
                                                                                                                                                                                  in its NTA

         Bailador Entry                               CY20                                                                     Original cost              CY20 carrying value +
                                                                                                                                                             realised cash

        Note: Revenue for the year ended 31 December 2020 and carrying values as at 31 December 2020 for the underlying companies in the BTI portfolio.                                              33
Tech valuations have increased, but BTI has maintained a conservative approach

                            BTI Portfolio1

                            Wisetech                                                                                                                                                               Average peer
                                                                                                                                                                                                    multiple up
  ASX
  Listed2
                            Altium
                                                                                                                                                                                                    34%
                            Xero

  Australian                Canva4
  Private Co.                                                                                                                                                                                ⤏ Material upside to
                            Aus SaaS >$500m                                                                                                                                                    BTI carrying values

                            Aus SaaS                                                                                                                                                         ⤏ Built in buffer if
  Indexes3
                                                                                                                                                                                               market multiples fall
                            US SaaS

                            Average peer multiple                                                                       +34%

  EV/LTM Revenue Multiple 2x                                4x           6x           8x          10x         12x          14x          16x          18x             20x   22x   24x   26x   28x    30x

                                                       EV/Revenue as at 28 February 2020                                                 EV/Revenue as at 28 February 2021

             Note: 1Based on BTI NTA as at 28 February 2021. Source: 2Factset, 28 February 2021. 3BTI analysis, 28 February 2021. 4News articles and BTI analysis.
                                                                                                                                                                                                                       34
BTI’s UK-based comparables trade at an average 17% premium to NTA/share
A track record of cash realisations higher than carrying value warrants a share price premium to NTA
Premium/discount to NTA per share

        50%
                     45%

                                                                  Seven of nine companies trade at a premium to NTA/share
        40%
                                                 35%

        30%
                                                                             27%

                                                                                                         20%
        20%                                                                                                                          16%
                                                                                                                                                                                        Peer average = 17% premium to NTA
                                                                                                                                                                  15%

        10%                                                                                                                                                                                   8%

         0%

                                                                                                                                                                                                                          -4%
                                                                                                                                                                                                                                                      -7%
       -10%                                                                                               Schiehallion Fund

                                                                                                                                                                                                                                                      Allied Minds
                      Augmentum Fintech

                                                                                                                                                                                              Chrysalis Investments
                                                                                                                                      TMT Investments

                                                                                                                                                                                                                          Draper Esprit VCT
                                                  Draper Esprit

                                                                                                                                                                  Sure Ventures
                                                                              Frontier

                     Note: UK-listed LICs comps all i) invest in high-growth, private-stage technology companies; ii) value their portfolio periodically on a NTA basis; and iii) investors gain access through a publicly traded ordinary share, at a price determined by
                     market trading. Source data: London Stock Exchange data as at 31 March 2021, Company Filings, News Reports, Bailador Analysis.                                                                                                                          35
Bailador Founders

“We are very pleased with the                    “A number of our Bailador portfolio
 performance of the portfolio during a            companies represent attractive
 tumultuous period. No emergency                  acquisition targets or IPO
 capital raisings were required, and              candidates. Harvesting gains is a key
 the businesses all have healthy                  element of our business, and we are
 sustainable models. The quality of               aiming to provide significant positive
 the businesses and management                    news to the market on these
 teams has the portfolio well                     companies during the coming
 positioned for continued growth.”                months.”

   David Kirk                                          Paul Wilson
   Bailador Co-Founder & Managing Partner              Bailador Co-Founder & Managing Partner
   HY21 results announcement, 12 February 2021         HY21 results announcement, 12 February 2021

                                                                                                     36
Bailador is rated ‘Recommended+’ by IIR

                        BTI Shareholder Returns1
  140%

  120%
              115%

  100%

   80%

   60%

   40%
                                                   34%                                                                            Annual Returns2                             1-yr                  2-yr (pa)            3-yr (pa)

   20%                                                                                19%                                         NTA                                        22.1%                    14.8%               12.9%
                                                                                                                                  NTA/sh (pre-tax)                           22.8%                    13.6%               12.1%
   0%                                                                                                                             BTI Shareholders                         115.4%                     33.8%               19.1%
              1-Year                          2-Years (pa)                       3-Years (pa)

         Note: 1Represents the annual average return to BTI shareholders derived from capital growth in BTI shareprice plus any cash dividends paid during the period. 2Annual returns calculated as at 31 March 2021.
                                                                                                                                                                                                                                     37
Bailador provides investors with exposure to
        expansion-stage technology companies with
        global addressable markets and a
        high growth trajectory

Investors get access through an ASX traded share [ASX:BTI]

                                                             38
Capital Raising

                  39
Capital Raising Overview

          Capital Raising                             Pricing                        Uses of Capital

   ⤏ Institutional placement raising    Offer price of $1.37 represents:     Following the Capital Raising,
     $20 million                                                             Bailador intends to use available cash
                                        ⤏ A 4.9% discount to BTI’s last      to generate investment returns from:
   ⤏ Bailador will also offer a non-      traded price on 26-Apr-21
     underwritten share purchase plan                                           1. New investments (Bailador is
     of $30,000 per existing eligible   ⤏ A 4.5% discount to the 5-day             in advanced discussions with
     shareholder                          volume weighted average price of         a number of parties)
                                          BTI shares as at 26-Apr-21
                                                                                2. Follow-on investments with
                                                                                   existing portfolio companies
                                        ⤏ A 10.5% discount to BTI’s pro-
                                          forma Apr-21 NTA per share

                                                                                                                      40
Offer structure
Structure             •   Non-underwritten Institutional Placement (Placement) to raise $20 million
                      •   Non-underwritten Share Purchase Plan (SPP) offering $30,000 per existing eligible shareholder

Placement             •   The Placement is non-underwritten and managed by Morgans Corporate Limited
                      •   New shares issued under the Placement will be issued at $1.37 per new share (Placement Price)
                      •   The Placement Price represents:
                             • A 4.9% discount to BTI’s last traded price on 26-Apr-21
                             • A 4.5% discount to the 5-day volume weighted average price of BTI shares as at 26-Apr-21
                             • A 10.5% discount to BTI’s pro-forma Apr-21 NTA per share
                      •   Approximately 14.6 million new ordinary shares will be issued under the Placement, representing 11.9% of BTI’s existing shares on issue (New Shares)
                      •   It is intended that eligible shareholders who bid for up to their ‘pro-rata’ share of New Shares under the Placement at the Placement Price will be
                          allocated their full bid, on a best endeavours basis
                      •   New Shares are not subject to shareholder approval and will be issued under BTI’s existing placement capacity. BTI may accept oversubscriptions up to
                          its current placement capacity

Share Purchase Plan   •   The SPP is non-underwritten and managed by Bailador Technology Investments Limited
                      •   BTI will offer eligible shareholders the opportunity to subscribe for new shares up to a maximum of $30,000 per eligible shareholder under the
                          SPP, free of brokerage, commission and transaction costs
                      •   New shares under the SPP will be issued at the Placement Price
                      •   SPP offer booklet expected to be sent to eligible shareholders on 6 May 2021
                      •   SPP offer is expected to open on 6 May 2021
Ranking               •   New Shares issued under both the Placement and SPP will rank equally with existing BTI shares from the date of their issue

                                                                                                                                                                                  41
Indicative Timetable

         Institutional Placement                                                                  Date
         Announcement of completion of Placement                                                  28 April 2021
         Settlement of New Shares under the Placement                                             4 May 2021
         Allotment and commencement of trading of New Shares issued under Placement               5 May 2021

         SPP                                                                                      Date
         Record date for participation                                                            27 April 2021
         Dispatch of SPP documents to shareholders                                                6 May 2021
         SPP Offer opens                                                                          6 May 2021
         SPP Offer closes                                                                         18 May 2021
         Company Closure Announcement                                                             21 May 2021
         Shortfall notification date (if applicable)                                              24 May 2021
         Settlement of SPP shares                                                                 26 May 2021
         Allotment of New Shares issued under SPP                                                 27 May 2021
         Expected quotation on the ASX and normal trading of new shares under the SPP commences   28 May 2021
         Dispatch of allotment confirmations / holding statement for New Shares                   28 May 2021

                                                                                                                  42
Disclaimer

 This presentation is confidential and may not be reproduced in whole or in part, or distributed except by Bailador Technology Investments Ltd
(“Bailador”) or by authorized representatives of Bailador (“Affiliates”).

 This presentation does not contain a complete description of Bailador and the risks associated with an investment therein. Bailador does not
accept liability to any person, organisation or company for any loss or damage suffered as a result of reliance on this document. All statements
other than statements of historical fact are, or may be deemed to be, forward-looking statements, and are subject to variation. All forward-
looking statements in this document reflect the current expectations of Bailador concerning future results and events.

 Any forward-looking statements contained or implied, either within this document or verbally, involve known and unknown risks, uncertainties
and other factors (including economic and market conditions, changes in operating conditions, currency fluctuations, political events, labour
relations, availability and cost of labour, material and equipment) that may cause actual results, performance of achievements to differ
materially from the anticipated results, performance or achievements, expressed, projected or implied by any forward-looking statements.

 Certain information contained in this presentation has been obtained from third-party sources. While such information is believed to be reliable
for the purposes used herein, no representations are made as to the accuracy or completeness thereof and neither Bailador nor its Affiliates
take any responsibility for such information.

                                                                                                                                                    43
FURTHER INFORMATION

               Website:              www.bailador.com.au
               Investor Enquiries:   investorservices@bailador.com.au
               Telephone:            +61 2 9223 2344

Bailador Technology Investments Limited (ASX:BTI)
You can also read