A Strategy for the Mass Distribution of COVID-19 Vaccines in Ontario Based on Age and Neighbourhood
←
→
Page content transcription
If your browser does not render page correctly, please read the page content below
SCIENCE BRIEFS

                                                      A Strategy for the Mass Distribution
                                                      of COVID-19 Vaccines in Ontario
                                                      Based on Age and Neighbourhood
                                                      Kevin A. Brown, Nathan M. Stall, Eugene Joh, Upton Allen, Isaac I. Bogoch, Sarah A.
                                                      Buchan, Nick Daneman, Gerald A. Evans, David N. Fisman, Jennifer L. Gibson, Jessica
                                                      Hopkins, Trevor Van Ingen, Antonina Maltsev, Allison McGeer, Sharmistha Mishra,
                                                      Fahad Razak, Beate Sander, Brian Schwartz, Kevin Schwartz, Arjumand Siddiqi, Janet
                                                      Smylie, Peter Jüni on behalf of the Ontario COVID-19 Science Advisory Table

Version 1.0
                                                      Key Message
Published: February 26, 2021
Citation: Brown KA, Stall NM, Joh E, et al. A
                                                      SARS-CoV-2 infection has taken a disproportionate toll on Ontario older adults, and
Strategy for the Mass Distribution of COVID-          on residents of disadvantaged and racialized urban neighbourhoods throughout the
19 Vaccines in Ontario Based on Age and               province.
Neighbourhood. Science Briefs of the
Ontario COVID-19 Science Advisory Table.              Prioritizing and implementing vaccine distribution for Ontarians based on both age
2021;2(10).https://doi.org/10.47326/
ocsat.2021.02.10.1.0
                                                      and neighbourhood of residence could ensure that those at the highest risk of SARS-
                                                      CoV-2 infection, and hospitalization, ICU admission or death from COVID-19 will be
Author Affiliations: The affiliations of the
members of the Ontario COVID-19 Science               among the first to receive vaccines.
Advisory Table can be found at https://
covid19-sciencetable.ca/.                             This vaccine strategy will maximize the prevention of deaths and long-term
Declarations of Interest: The declarations of
                                                      morbidity, and best maintain health care system capacity by reducing
interest of the members of the Ontario                hospitalizations and ICU admissions due to COVID-19 as compared with a strategy
COVID-19 Science Advisory Table can be                that prioritizes vaccination based on age alone (Figure 1).
found at https://covid19-sciencetable.ca/.
About Us: The Ontario COVID-19 Science                The strategy would not interfere with the ongoing and future vaccination of any
Advisory Table is a group of scientific experts       specific high-risk population, as it is intended to guide the mass distribution of
and health system leaders who evaluate and            vaccines to the general Ontario population.
report on emerging evidence relevant to the
COVID-19 pandemic, to inform Ontario’s
response. Our mandate is to provide weekly
summaries of relevant scientific evidence for
the COVID-19 Health Coordination Table of
the Province of Ontario, integrating
information from existing scientific tables,
Ontario’s universities and agencies, and the
best global evidence. The Science Table
summarizes its findings for the Health
Coordination Table and the public in Science
Briefs.
Correspondence to: Secretariat of the
Ontario COVID-19 Science Advisory Table
(info@covid19-sciencetable.ca)
Copyright: 2021 Ontario COVID-19 Science
Advisory Table. This is an open access
document distributed under the terms of the
Creative Commons Attribution License,
which permits unrestricted use, distribution,
and reproduction in any medium, provided
that the original work is properly cited.
                                                      Figure 1. Projected Number of Prevented COVID-19 Hospitalizations, ICU Admissions and Deaths by Two
The views and findings expressed in this              Strategies for Mass Distribution of Vaccines in Ontario, March 1 to May 31, 2021
Science Brief are those of the authors and do         Bar graph presenting the projected number of prevented hospitalizations, ICU admissions and deaths due to COVID-
not necessarily reflect the views of all of the       19 in Ontario from March 1-May 31, 2021 under two strategies for mass distribution of vaccines: 1) prioritization
members of the Ontario COVID-19 Science               based on age alone (blue bars) and 2) prioritization based on age and neighbourhood of residence (orange bars). The
Advisory Table, its Working Groups, and its           brackets above the bar graphs report the relative difference (%) in prevented outcomes between the two strategies
partners.                                             for mass distribution of vaccines. See Table 1 below for the number of projected events associated with the different
                                                      distribution strategies.

Science Briefs | https://covid19-sciencetable.ca/science-briefs                                                                                       February 26, 2021 | 1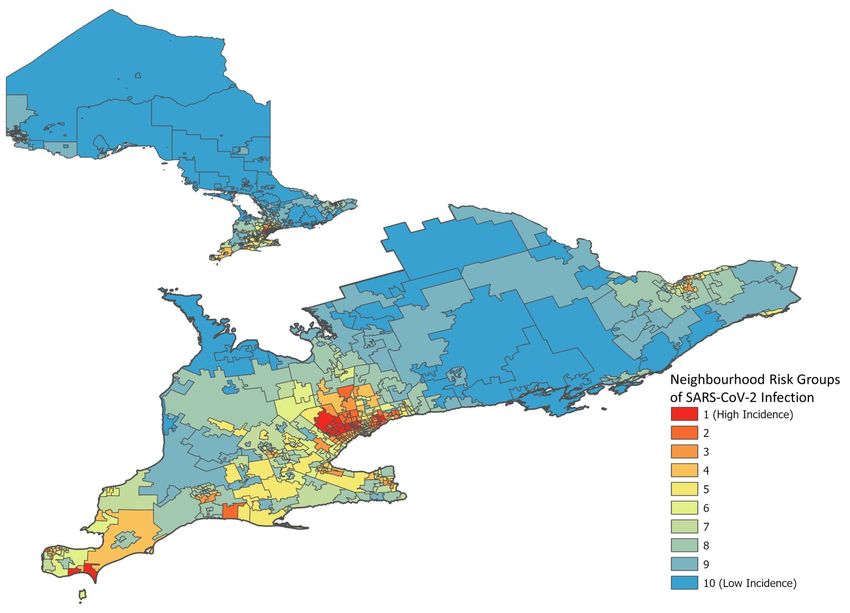
Ontario COVID-19 Science Advisory Table                                A Strategy for the Mass Distribution of COVID-19 Vaccines in Ontario Based on Age and Neighbourhood

                                                      Summary
                                                      Background
                                                      Ontario is currently in the initial stages of its COVID-19 vaccine distribution plan,
                                                      which involves the vaccination of 1.5-million high-risk individuals. Rapidly
                                                      immunizing those at the greatest risk of acquiring SARS-CoV-2 infection and
                                                      experiencing hospitalization, ICU admission and death from COVID-19 outside of
                                                      specific high-risk groups will continue to be important in the Ontario’s subsequent
                                                      mass distribution stages of vaccine, especially in the face of limited vaccine supply
                                                      and with the emergence of variants of concern.

                                                      Questions
                                                      Which Ontario age groups and neighbourhoods have experienced the highest
                                                      incidence of SARS-CoV-2 infection and hospitalizations, ICU admissions and deaths
                                                      due to COVID-19?
                                                      What is the potential impact of an Ontario mass distribution strategy for COVID-19
                                                      vaccines that explicitly takes both age and neighbourhood of residence into
                                                      account?

                                                      Findings
                                                      COVID-19 deaths and hospitalizations are strongly associated with individuals’ age
                                                      and neighbourhood of residence. As of January 16, 2021, 50% of Ontario COVID-19
                                                      deaths, outside of LTC and retirement homes, have occurred in just 4% of the
                                                      population aged 16 years or above. Similarly, 50% of hospitalizations were
                                                      concentrated in just 11% of the population aged 16 years or above. The highest risk
                                                      populations can be reliably identified using information on individuals’ age and
                                                      neighbourhood of residence.
                                                      Projections indicate that a vaccine strategy prioritizing both age and neighbourhood
                                                      would prevent an additional 3,767 cases of SARS-CoV-2 infection, and 702 hospital
                                                      admissions, 145 ICU admissions, and 168 deaths from COVID-19 as compared to a
                                                      strategy that prioritizes based on age alone.

                                                      Interpretation
                                                      A mass vaccine distribution strategy that prioritizes individuals based on both their
                                                      age and neighbourhood of residence can reduce cases of SARS-CoV-2 infection, and
                                                      hospitalizations, ICU admissions, and deaths due to COVID-19, and will also directly
                                                      address the inequitable impact of COVID-19 on disadvantaged populations in
                                                      Ontario.
                                                      The number of events prevented by this strategy will further increase in the context
                                                      of vaccine scarcity, with increasing duration of the vaccine rollout, if the daily
                                                      incidence of SARS-CoV-2 cases increases, if vaccination not only protects against
                                                      symptomatic COVID-19, but also against asymptomatic infection and transmission,
                                                      and if an age-based strategy is inequitable, resulting in higher vaccination rates in
                                                      wealthier neighbourhoods, as currently observed in the United States.

Science Briefs | https://covid19-sciencetable.ca/science-briefs                                                                                      February 26, 2021 | 2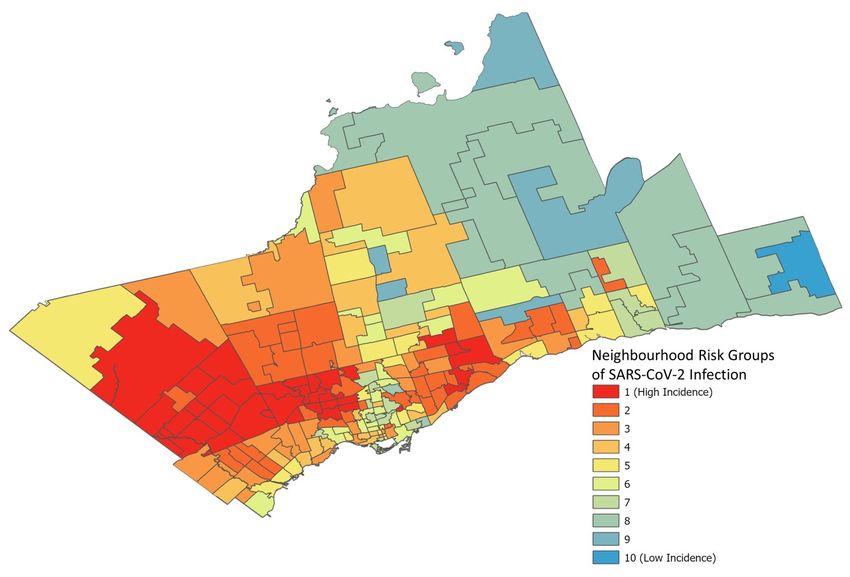
Ontario COVID-19 Science Advisory Table A Strategy for the Mass Distribution of COVID-19 Vaccines in Ontario Based on Age and Neighbourhood
Background
COVID-19 has taken a disproportionate toll on older adults and residents of
disadvantaged urban neighbourhoods in Ontario. More than 95% of Ontario’s COVID-19
deaths have occurred among individuals aged 60 years and older, and the COVID-19
case fatality rate is more than 100 times higher in individuals aged 80 years and
older, as compared to individuals under 40 years of age.1 The incidence of SARS-CoV-2
infection is also disproportionately higher in urban neighbourhoods, especially in
those with higher concentrations of essential workers, crowded housing,
multigenerational family households, visible minorities and individuals with lower
socioeconomic status.2 Recent evidence from the United States suggests that the
mass distribution of the COVID-19 vaccine—which has largely used an age-based
prioritization framework—has been inequitable, with higher vaccination rates in
wealthier neighbourhoods, which also have lower incidences of SARS-CoV-2
infections and COVID-19 deaths.3,4 This has led to calls to consider prioritizing
vaccine distribution based on both age and residence in neighbourhoods most
severely affected by COVID-19.5,6
Ontario is currently in the initial stages of its COVID-19 vaccine distribution plan,
which involves the vaccination of 1.5-million high-risk individuals, including
residents, staff and caregivers of residents in congregate care settings; frontline
healthcare workers; adults in First Nations, Métis, and Inuit populations; adult
chronic home care recipients; and people aged 80 years or older. Rapidly
immunizing those at the greatest risk of acquiring SARS-CoV-2 infection and
experiencing hospitalization, ICU admission and death from COVID-19 outside of
specific high-risk groups will continue to be important in the subsequent mass
distribution stages, especially in the face of limited vaccine supply and the
emergence of variants of concern.7 This approach will minimize deaths and long-
term morbidity, and maintain health care system capacity.
Questions
Which Ontario age groups and neighbourhoods have experienced the highest
incidence of SARS-CoV-2 infection and hospitalizations, ICU admissions and deaths
due to COVID-19?
What is the potential impact of a mass distribution strategy for COVID-19 vaccines
that explicitly takes both age and neighbourhood of residence into account?
Findings
Retrospective Analysis
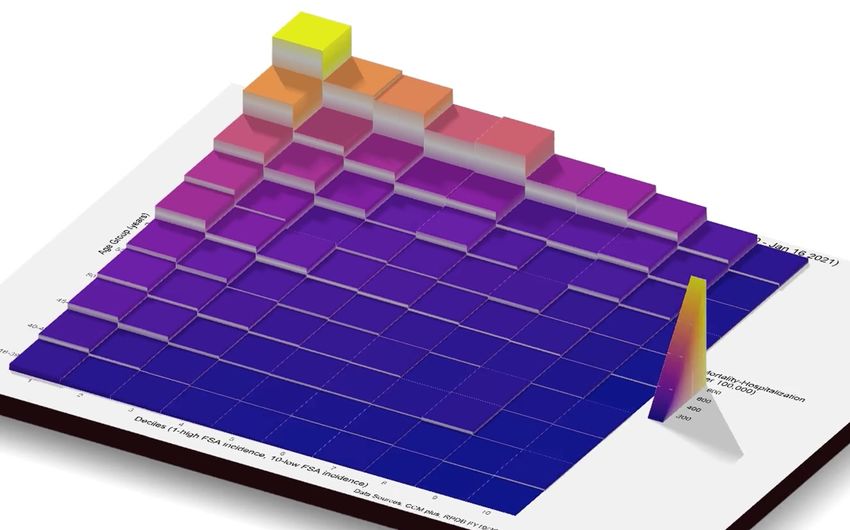
To date, Ontario neighbourhoods with the highest cumulative incidence of SARS-
CoV-2 infections are in Toronto, Peel, York, and Windsor-Essex regions (Figures 2
and 3).
Science Briefs | https://covid19-sciencetable.ca/science-briefs February 26, 2021 | 3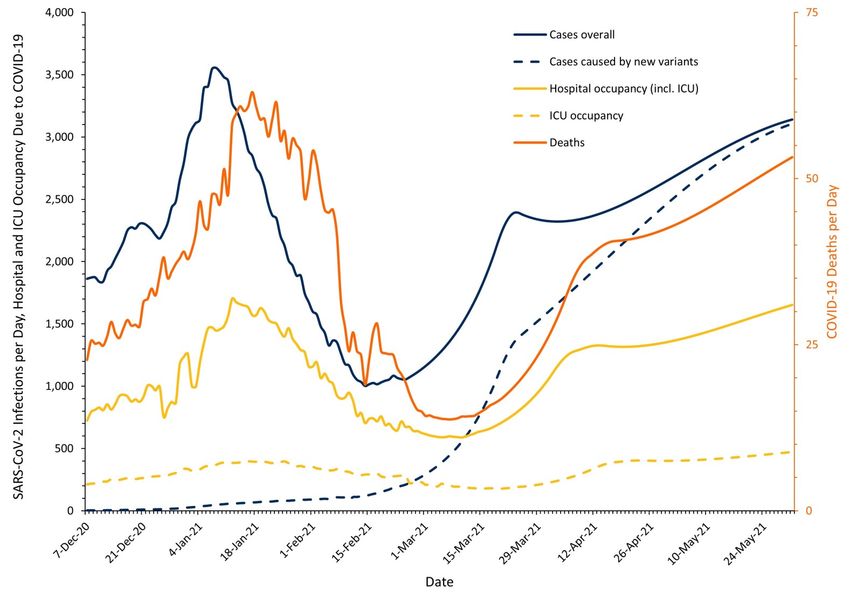
Ontario COVID-19 Science Advisory Table                                    A Strategy for the Mass Distribution of COVID-19 Vaccines in Ontario Based on Age and Neighbourhood

                                                      Figure 2. Incidence of SARS-CoV-2 Infections in 516 Ontario Neighbourhoods, January 23, 2020 to January 16, 2021
                                                      Neighbourhoods ranked in 10% increments by cumulative incidence of SARS-CoV-2 infection between Jan 23, 2020
                                                      and Jan 16, 2021. Each group represents 10% of the Ontario population (~1.5 million inhabitants). Neighbourhoods
                                                      are defined by the first three digits of a resident’s postal code (also known as “forward sortation area”). A total of
                                                      509 neighbourhoods were analyzed. Group 1 includes neighbourhoods with the highest cumulative incidence of SARS
                                                      -CoV-2 infection, whereas group 10 includes neighbourhoods with the lowest cumulative incidence of SARS-CoV-2
                                                      infection. Data sourced from the Public Health Case and Contact Management Solution and other case management
                                                      systems (CCM plus), extracted on January 16, 2021.

                                                      As of January 16, 2021, 1,758 Ontarians have died of COVID-19 outside of long-term
                                                      care (LTC) and retirement homes. Of these deaths, 21% occurred in Ontario
                                                      neighbourhoods ranked in the top 10% of SARS-CoV-2 infection rates, while 49% of
                                                      deaths occurred in individuals aged 80 years and older.

                                                      Figure 3. Incidence of SARS-CoV-2 Infection in 180 Greater Toronto Area Neighbourhoods, January 23, 2020 to
                                                      January 16, 2021
                                                      Neighbourhoods ranked in 10% increments by cumulative incidence of SARS-CoV-2 infection between Jan 23, 2020
                                                      and Jan 16, 2021. Neighbourhoods are defined by the first three digits of a resident’s postal code (also known as
                                                      forward sortation area). A total of 180 neighbourhoods are presented. Group 1 includes neighbourhoods with the

Science Briefs | https://covid19-sciencetable.ca/science-briefs                                                                                          February 26, 2021 | 4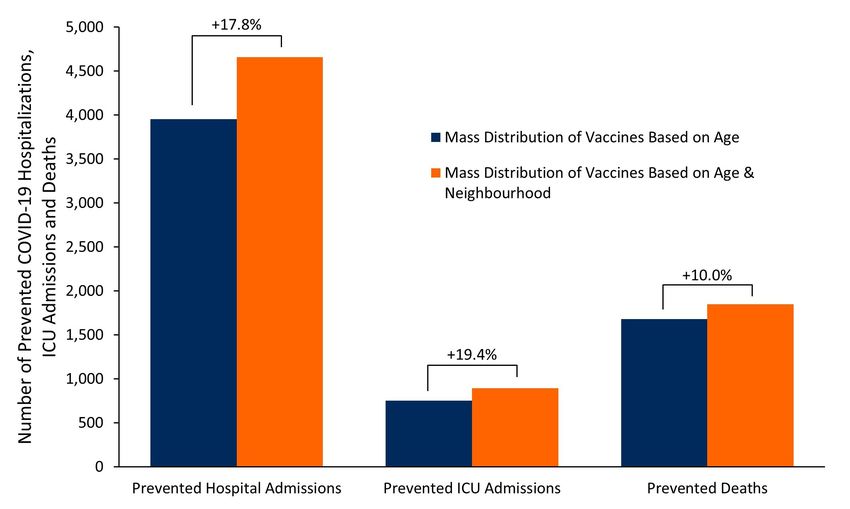
Ontario COVID-19 Science Advisory Table                                    A Strategy for the Mass Distribution of COVID-19 Vaccines in Ontario Based on Age and Neighbourhood

                                                      highest incidence of SARS-CoV-2 infections, whereas group 10 includes neighbourhoods with the lowest incidence of
                                                      SARS-CoV-2 infections. Data sourced from the Public Health Case and Contact Management Solution and other case
                                                      management systems (CCM plus), extracted on January 16, 2021.

                                                      COVID-19 deaths are strongly associated with an individual’s age and
                                                      neighbourhood of residence. As of January 16, 2021, 50% of Ontario COVID-19
                                                      deaths, outside of LTC and retirement homes, have occurred in just 4% of the
                                                      population aged 16 years or above. These are represented by the 10 lighter
                                                      coloured cells in the upper left corner of Figure 4 with an incidence of more than 85
                                                      deaths per 100,000 residents.

                                                      Figure 4. Incidence of COVID-19 Deaths by Age and Neighbourhood in Ontario, January 23, 2020 to January 16, 2021
                                                      COVID-19 deaths by age and neighbourhood in Ontarians living outside of LTC and retirement homes from January
                                                      23, 2020 to January 16, 2021. COVID-19 deaths occurred predominantly in older adults residing in neighbourhoods
                                                      with the highest cumulative incidence of SARS-CoV-2 infection. Over 50% of deaths occurred in 4% of the population,
                                                      presented in the 10 cells in the upper left corner of the figure with incidence of more than 85 deaths per 100,000
                                                      inhabitants. Data sourced from the Public Health Case and Contact Management Solution and other case
                                                      management systems (CCM plus), extracted on January 16, 2021; neighbourhood population from the Registered
                                                      Persons Database (RPDB).

                                                      COVID-19 hospitalizations are also strongly associated with an individual’s age and
                                                      neighbourhood of residence, with 50% of hospitalizations concentrated in 11% of
                                                      the population aged 16 years or above. These are represented by the 22 lighter
                                                      coloured cells with more than 160 hospitalizations per 100,000 inhabitants at the
                                                      top left corner of Figure 5.

Science Briefs | https://covid19-sciencetable.ca/science-briefs                                                                                          February 26, 2021 | 5
Ontario COVID-19 Science Advisory Table                                    A Strategy for the Mass Distribution of COVID-19 Vaccines in Ontario Based on Age and Neighbourhood

                                                      Figure 5. Incidence of Hospitalizations for COVID-19 by Age and Neighbourhood of Residence in Ontario, from
                                                      January 23, 2020 to January 16, 2021
                                                      Incidence of COVID-19 hospitalizations by age and neighbourhood in Ontarians living outside of LTC and retirement
                                                      homes from January 23, 2020 to January 16, 2021. COVID-19 hospitalizations occurred predominantly in older adults
                                                      residing in neighbourhoods with the highest cumulative incidence of SARS-CoV-2 infection. Over 50% of
                                                      hospitalizations occurred in approximately 11% of the population, represented by the 22 cells in the upper left corner
                                                      of the figure with an incidence more than 160 hospitalizations per 100,000 inhabitants. Data sourced from the Public
                                                      Health Case and Contact Management Solution and other case management systems (CCM plus), extracted on
                                                      January 16, 2021; neighbourhood population from the Registered Persons Database (RPDB).

                                                      Vaccination Strategy Using Age and Neighbourhood-Based Prioritization
                                                      In view of the retrospective analysis above, an effective mass vaccine distribution
                                                      strategy for Ontario should identify people with the highest priority for COVID-19
                                                      vaccination based on their age and the neighbourhood they reside in. This will
                                                      prevent the largest number of deaths and hospitalizations due to COVID-19.
                                                      Figure 6 shows the number of deaths or hospitalizations due to COVID-19 that have
                                                      occurred in Ontarians living outside of LTC and retirement homes between January
                                                      23, 2020 and January 16, 2021, which could be used as a blueprint to identify the
                                                      highest priority individuals for vaccine distribution. There is a 380-fold difference in
                                                      the frequency of COVID-19 deaths or hospitalizations between the oldest individuals
                                                      living in neighbourhoods with the highest incidence of SARS-CoV-2 (top left cell of
                                                      Figure 6), and the youngest individuals living in neighbourhoods with lowest
                                                      incidence of SARS-CoV-2 (bottom right cell of Figure 6). Additional analyses indicates
                                                      that the past occurrence of events shown in Figure 6 is highly predictive of the risk
                                                      of future events in the same neighbourhoods (data available upon request).

Science Briefs | https://covid19-sciencetable.ca/science-briefs                                                                                          February 26, 2021 | 6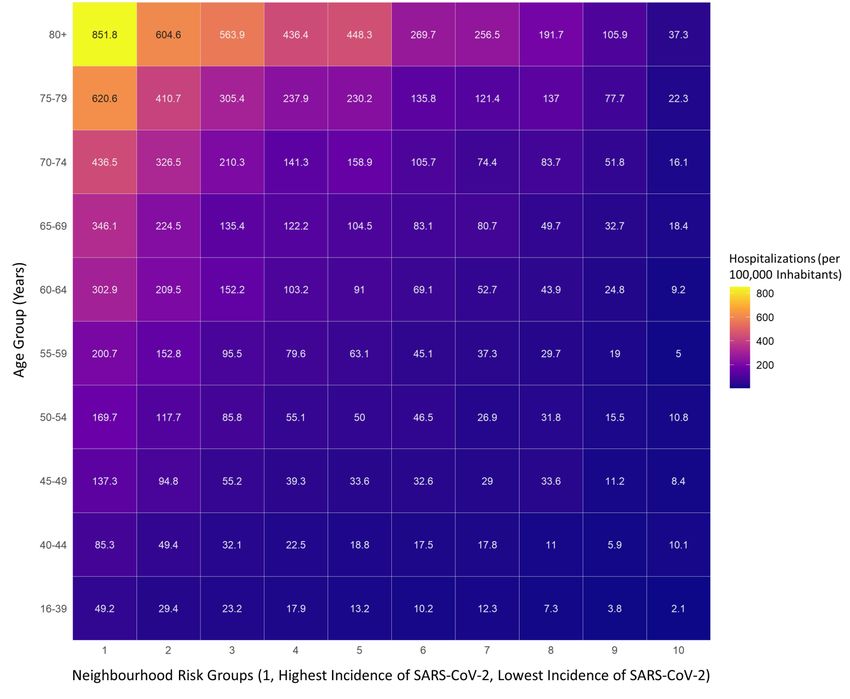
Ontario COVID-19 Science Advisory Table                                    A Strategy for the Mass Distribution of COVID-19 Vaccines in Ontario Based on Age and Neighbourhood

                                                      Figure 6. Incidence of COVID-19 Deaths or Hospitalizations by Age and Neighbourhood of Residence in Ontario, from
                                                      January 23, 2020 to January 16, 2021
                                                      Incidence of COVID-19 deaths or hospitalizations by age and neighbourhood in Ontarians living outside of LTC and
                                                      retirement homes. COVID-19 deaths or hospitalizations occurred predominantly in older adults residing in
                                                      neighbourhoods with the highest cumulative incidence of SARS-CoV-2 infection. There is a 380-fold difference in the
                                                      frequency of COVID-19 deaths or hospitalizations between the population 80 years of age and above living in the
                                                      highest incidence neighbourhoods (top left cell) and the population between 16 and 39 years of age living in the
                                                      lowest incidence neighbourhoods (bottom right cell). Data sourced from the Public Health Case and Contact
                                                      Management Solution and other case management systems (CCM plus), extracted on January 16, 2021;
                                                      neighbourhood population from the Registered Persons Database (RPDB).

                                                      Prioritizing mass vaccine distribution based on both age and neighbourhood of
                                                      residence will ensure that Ontarians at the highest risk of SARS-CoV-2 infection,
                                                      hospitalization, or death due to COVID-19 will be the first to receive vaccines. Within
                                                      each neighbourhood risk group, the age cut-offs for priority of vaccination can be
                                                      selected depending on the observed risk of death or hospitalization due to COVID-
                                                      19. Cut-offs of 400, 300, 200 and 100 deaths or hospitalizations per 100,000
                                                      inhabitants can be used in descending order to sequentially identify age cut-offs for
                                                      priority vaccination. Figure 7 is a 3-dimensional representation of the differences in
                                                      the risk of COVID-19 deaths or hospitalizations observed across age bands and
                                                      neighbourhood risk groups.

Science Briefs | https://covid19-sciencetable.ca/science-briefs                                                                                          February 26, 2021 | 7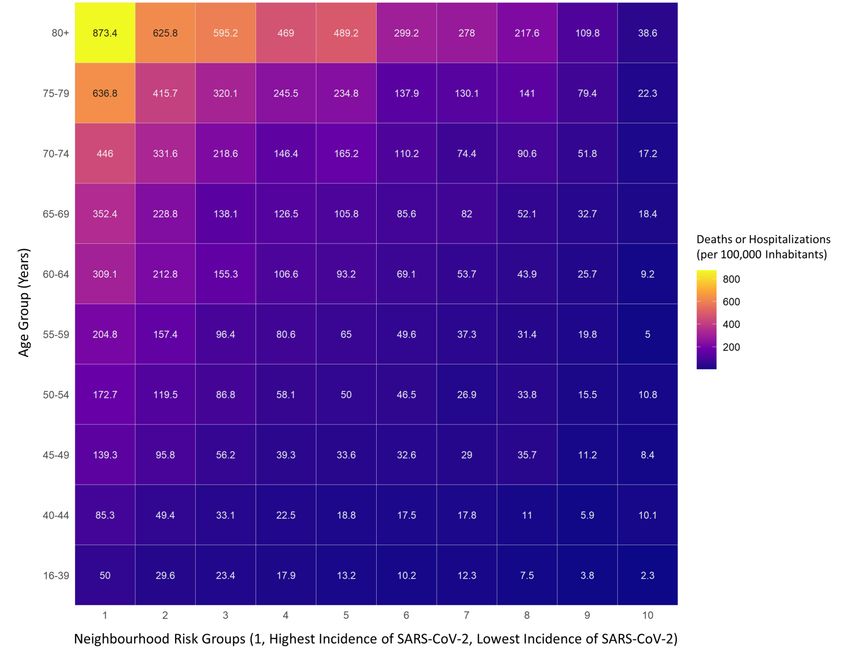
Ontario COVID-19 Science Advisory Table                                    A Strategy for the Mass Distribution of COVID-19 Vaccines in Ontario Based on Age and Neighbourhood

                                                      Figure 7. 3-Dimensional Representation of the Differences in the Risk of COVID-19 Deaths or Hospitalizations by Age
                                                      and Neighbourhood of Residence in Ontario, from January 23, 2020 to January 16, 2021
                                                      Risk of COVID-19 deaths or hospitalizations by age and neighbourhood in Ontarians living outside of LTC and
                                                      retirement homes. COVID-19 deaths or hospitalizations occurred predominantly in older adults, especially those
                                                      residing in neighbourhoods with the highest cumulative incidence of SARS-CoV-2 infection. Data sourced from the
                                                      Public Health Case and Contact Management Solution and other case management systems (CCM plus), extracted
                                                      on January 16, 2021; neighbourhood population from the Registered Persons Database (RPDB). See Figure 6 for
                                                      explanations.

                                                      Figure 8 presents projections after most of Ontario moved back to the colour coded
                                                      COVID-19 response framework for public health measures.8 The scenario takes into
                                                      account that all Ontario regions had schools return to in-class learning, and all
                                                      except for Toronto, Peel and North Bay-Parry Sound lifted some of their public
                                                      health restrictions by February 22, 2021, in accordance with the framework.8 It
                                                      assumes that the current effective reproduction number (Rt) for the traditional
                                                      variants originally identified in Wuhan, China, is 1.00 (estimate on February 24,
                                                      2021), and that it will gradually increase over 3 weeks to 1.09 (the average Rt found
                                                      for traditional variants during the first 3 weeks of December 2020). The scenario
                                                      also assumes that Ontario will return to a province-wide lockdown with a stay-at-
                                                      home order on March 10, 2021, due to early signs of surging SARS-CoV-2 infections
                                                      as the more transmissible B.1.1.7 variant, which was first identified in the United
                                                      Kingdom, becomes the dominant variant in the province.9

Science Briefs | https://covid19-sciencetable.ca/science-briefs                                                                                          February 26, 2021 | 8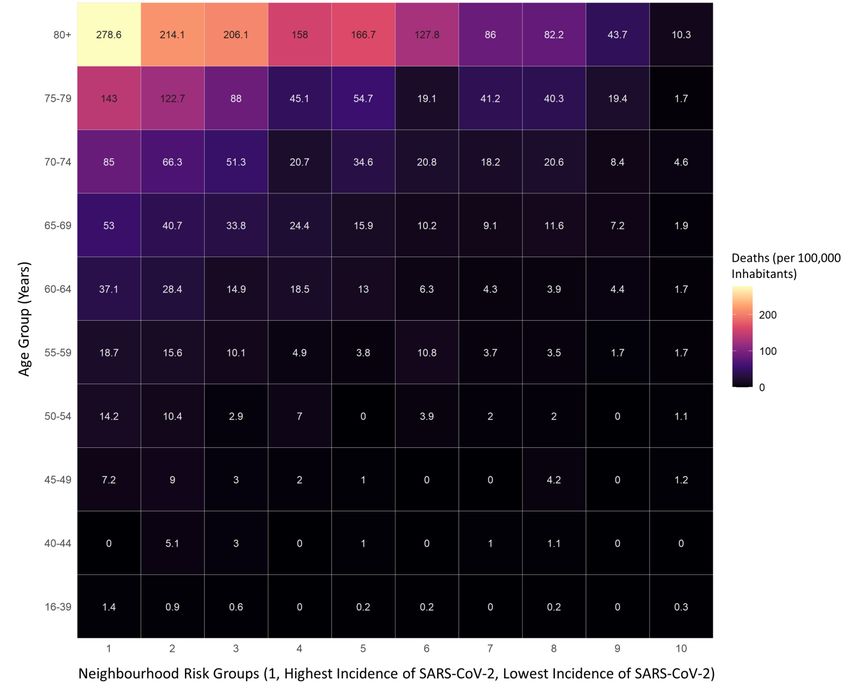
Ontario COVID-19 Science Advisory Table                                    A Strategy for the Mass Distribution of COVID-19 Vaccines in Ontario Based on Age and Neighbourhood

                                                      Figure 8. Actual and Projected SARS-CoV-2 Infections Overall and from the B.1.1.7 Variant, Hospital Occupancy, ICU
                                                      Occupancy, and Deaths from COVID-19 in Ontario, from December 7, 2020, to May 31, 2021, assuming that a
                                                      province-wide lockdown with a stay-at-home order will be re-introduced on March 10, 2021
                                                      Line graphs presenting the actual and projected rolling 7-day average of SARS-CoV-2 infections overall and due to
                                                      the B.1.1.7 variant, and COVID-19 hospital occupancy, ICU occupancy, and deaths in Ontario, from December 7,
                                                      2020, to May 31, 2021. Note that the scales for SARS-CoV-2 infections, and COVID-19 hospital and ICU occupancy
                                                      (left) and for COVID-19 deaths per day (right) are different. Outcomes are projected for the period between February
                                                      25 and May 31, 2021 under the assumption that no additional vaccination will be administered to Ontarians, except
                                                      for those administered by February 24, 2021 to residents, staff and caregivers of congregate care settings, frontline
                                                      healthcare workers, adults in First Nations, Métis, and Inuit populations, and adult chronic home care recipients, and
                                                      that there will be a province-wide lockdown with a stay-at-home order re-introduced on March 10, 2021. See results
                                                      section above and methods section below for full assumptions used for the projections.

                                                      Figure 9 shows the projected cumulative number of hospitalizations (Panel A), ICU
                                                      admissions (Panel B) and deaths (Panel C) between March 1 and May 31, 2021 in
                                                      Ontario under 3 scenarios. In Scenario 1, no additional vaccines are administered to
                                                      Ontarians, except for those high-risk individuals vaccinated by February 24, 2021.8,10
                                                      In Scenario 2, 1.3 million Ontarians are vaccinated between March 1 and May 20,
                                                      2021, using a prioritization framework based on age alone; this scenario assumes
                                                      equal administration of vaccines across all Ontario neighbourhoods. In Scenario 3,
                                                      1.3 million Ontarians being vaccinated between March 1 and May 20, 2021, using a
                                                      prioritization framework based on both age and neighbourhood.
                                                      Table 1 presents estimates of the projected outcomes for all 3 scenarios. The
                                                      cumulative projected number of events between March 1 and May 31, 2021 is
                                                      consistently lower with a strategy for the mass distribution of vaccines that
                                                      prioritizes based on both age and neighbourhood of residence as compared to
                                                      either a scenario of no additional vaccination beyond February 24, 2021 or a
                                                      vaccination strategy that prioritizes based on age alone. A vaccine strategy
                                                      prioritizing both age and neighbourhood will prevent a projected additional 3,767
                                                      cases of SARS-CoV-2 infection, 702 hospitalizations, 145 ICU admissions, and 168
                                                      deaths from COVID-19 as compared to a strategy that prioritizes based on age alone
                                                      (Table 1).

Science Briefs | https://covid19-sciencetable.ca/science-briefs                                                                                          February 26, 2021 | 9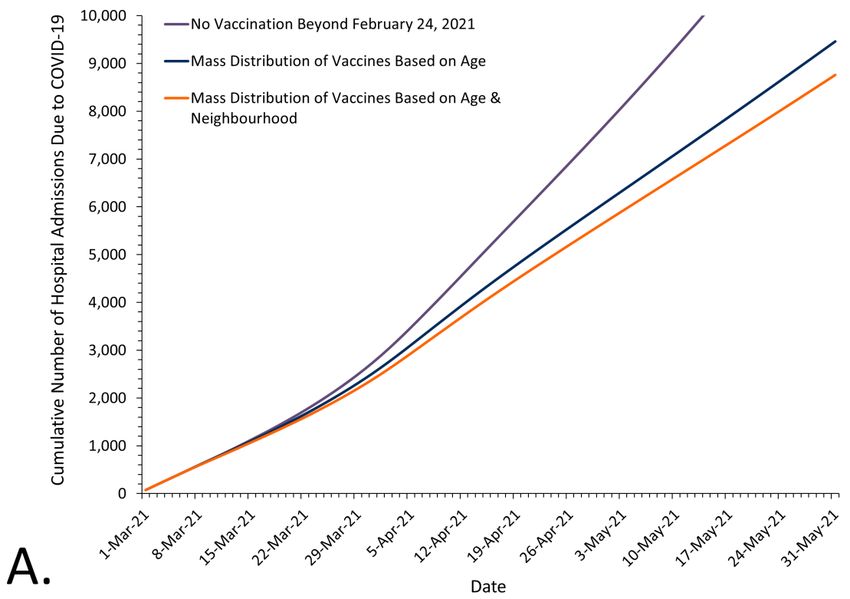
Ontario COVID-19 Science Advisory Table                                    A Strategy for the Mass Distribution of COVID-19 Vaccines in Ontario Based on Age and Neighbourhood

                                                      Figure 9. Cumulative Number of Hospitalizations, ICU Admissions and Deaths occurring between March 1 and May
                                                      31, 2021 under 3 Vaccine Mass Distribution Scenarios
                                                      Projected cumulative number of hospitalizations (Panel A), ICU admissions (Panel B) and deaths (Panel C) occurring
                                                      between March 1 and May 31, 2021, under 3 vaccine mass distribution scenarios. No vaccination refers to the
                                                      control scenario of no additional vaccines being administered to Ontarians, except for those high-risk individuals
                                                      vaccinated by February 24, 2021 (residents, staff and caregivers of congregate care settings for older adults,
                                                      frontline healthcare workers, adults in First Nations, Métis, and Inuit populations, and adult chronic home care
                                                      recipients). Mass distribution of vaccines based on age refers to a scenario of 1.3 million Ontarians being vaccinated
                                                      between March 1 and May 20, 2021, using a prioritization framework for mass immunization based on age alone;
                                                      this scenario assumes equal administration of vaccines across all Ontario neighbourhoods. Mass distribution of
                                                      vaccines based on age & neighbourhood refers to a scenario of 1.3 million Ontarians being vaccinated between
                                                      March 1 and May 20, 2021, using a prioritization framework based on both age and neighbourhood. See Figure 7 for
                                                      base scenario.

Science Briefs | https://covid19-sciencetable.ca/science-briefs                                                                                        February 26, 2021 | 10
Ontario COVID-19 Science Advisory Table A Strategy for the Mass Distribution of COVID-19 Vaccines in Ontario Based on Age and Neighbourhood
Table 1. Cumulative projected SARS-CoV-2 cases, COVID-19 hospitalizations, ICU admissions and deaths in Ontario
between February 17-May 31, 2021 under three scenarios: 1) no additional vaccination beyond February 24, 2021, 2)
vaccine distribution prioritizing age alone, and 3) vaccine distribution prioritizing age and neighbourhood.
Note that the estimates for the vaccine distribution strategy based on age alone assume equal administration of
vaccines across all Ontario neighbourhoods. This assumption will likely underestimate the number of events, as
experience in the United States suggests, that residents of socioeconomically deprived neighbourhoods at high risk of
COVID-19 are less likely than residents of socioeconomically advantaged neighbourhoods at low risk of COVID-19 to
receive the vaccine.3–6
Interpretation
As of January 16, 2021, 50% of Ontario COVID-19 deaths, outside of LTC and
retirement homes, have occurred in just 4% of the population aged 16 years or
above. These are represented by the 10 lighter coloured cells in the upper left
corner of Figure 4 above. In addition, 50% of hospitalizations have occurred in 11%
of the population aged 16 years or above. These are represented by the 22 lighter
coloured cells in the top left corner of Figure 5 above. These high risk populations
are defined by a combination of an individual’s age and neighbourhood of
residence.
A strategy for the mass distribution of COVID-19 vaccines that prioritizes people
based on both their age and neighbourhood of residence can reduce cases of SARS-
CoV-2 infection, COVID-19 hospitalizations, ICU admissions, and deaths, and will also
directly address the inequitable impact of COVID-19 on disadvantaged populations
in Ontario.
The age and neighbourhood prioritization strategy is intended to guide the mass
distribution of COVID-19 vaccines to the general population.7 The prioritization
strategy needs to be combined with efforts to promote equitable administration of
COVID-19 vaccines. This includes partnering with trusted community organizations
and leaders to promote vaccine awareness and uptake. Simple registration
procedures are essential, including options that do not require the internet or digital
platforms, such as phone-based or in-person registration. Registration also needs to
be accessible to those with limited English or French language proficiency, poor
literacy, and those with cognitive or sensory impairments. Additional options that do
not require pre-registration or government-issued identification are important.
Vaccination centres should be located in local community centers, schools, houses
of worship, or other highly frequented and trusted sites in the community. Centres
should be accessible and located near public transportation. Hours of operation
should extend beyond standard business hours. Mobile outreach options are
required for individuals who cannot access vaccination centres due to mobility,
transportation or other barriers.3–6
Importantly, the suggested mass distribution strategy would not interfere with the
ongoing vaccination of any specific high-risk population,11 including residents, staff
and caregivers in congregate care settings; frontline healthcare workers; adults in
First Nations, Métis, and Inuit populations; adult chronic home care recipients; and
people aged 80 years or older irrespective of their neighbourhood of residence.
The strategy will also not interfere with the planned vaccination of high-risk
essential workers in non-healthcare settings, including first responders, teachers and
other education staff and the food processing industry.12,13 Age cut-offs could be
used for the prioritization of high-risk essential workers who have similar risk of
Science Briefs | https://covid19-sciencetable.ca/science-briefs February 26, 2021 | 11Ontario COVID-19 Science Advisory Table A Strategy for the Mass Distribution of COVID-19 Vaccines in Ontario Based on Age and Neighbourhood
exposure to residents of high incidence neighbourhoods, regardless of their
neighbourhood of residence, but based on their place of work (Figure 6).
Differences between a mass vaccine distribution strategy that prioritizes people
based on both their age and neighbourhood of residence and a strategy based on
age alone will become larger in the context of vaccine scarcity, with increasing
duration of the vaccine rollout beyond May 31, 2021, if the daily incidence of SARS-
CoV-2 cases increases, if vaccination also protects against asymptomatic infection
and transmission,14 and if an age-based strategy is inequitable, resulting in higher
vaccination rates in wealthier neighbourhoods, as currently observed in the United
States.3,4
Methods Used for This Science Brief
We conducted a population-level retrospective cohort study and developed a data-
driven predictive model of the potential impacts of different strategies for the mass
distribution of COVID-19 vaccines in Ontario. All analyses were based on SARS-CoV-2
cases, COVID-19 hospitalizations, and COVID-19 death data retrieved from the Public
Health Case and Contact Management Solution and other case management
systems (CCM plus) reported between January 23, 2020 and January 16, 2021. Cases
in LTC and retirement homes were excluded. Neighbourhood of residence was
defined by 526 unique forward sortation areas (FSAs), the first 3 digits of a
resident’s postal code. FSAs with less than 1,000 residents were merged with
adjacent neighbourhoods to ensure accurate prediction of SARS-CoV-2 incidence,
yielding 509 unique neighbourhoods. Age-specific population data by FSA were
obtained from the Registered Persons Database (RPDB) Fiscal Year 2019/2020.
Age was classified into 10 age bands (16-39, 40-44, 45-49, 50-54, 55-59, 60-64, 65-
69, 70-74, 75-79, and ≥80 years of age). Neighbourhood cumulative SARS-CoV-2
incidence was classified into 10 neighbourhood risk groups with equal populations
based on the observed cumulative incidence of SARS-CoV-2 infection from the
beginning of the COVID-19 pandemic (January 23, 2020) until January 16, 2021. The
combination of the 10 age bands and 10 neighbourhood risk groups resulted in a
matrix of 100 cells. For each cell, we calculated the rate of COVID-19 deaths, the
rate of COVID-19 hospitalizations and the rate of the composite of COVID-19
hospitalizations or deaths due to COVID-19 per 100,000 inhabitants using the Public
Health Case and Contact Management Solution and other case management
systems (CCM plus). This data has demonstrated accuracy in identifying deaths and
hospitalizations among COVID-19 cases in Ontario.15
We evaluated three scenarios: (1) an assumption that no additional vaccines would
be administered to Ontarians, except for those administered by February 24, 2021
to residents, staff and caregivers in congregate care settings for older adults,
frontline healthcare workers, adults in First Nations, Métis, and Inuit populations,
and adult chronic home care recipients (control scenario); (2) an assumption that
2.2 million vaccine doses would be administered to 1.3 million Ontarians over a 13-
week period between March 1 and May 31, 2021 with vaccination of 100,000
people per week, prioritizing by age based on the above 10 age bands; (3) an
assumption that 2.2 million vaccine doses would be administered to 1.3 million
Ontarians over a 13-week period between March 1 and May 31, with vaccination of
100,000 people per week, prioritizing by both age and neighbourhood of residence
based on the 100 cells shown in Figure 6. For the third scenario, vaccination priority
was based on the ranked incidence rate per 100,000 inhabitants of the composite
outcome of hospitalization or death due to COVID-19.
Science Briefs | https://covid19-sciencetable.ca/science-briefs February 26, 2021 | 12Ontario COVID-19 Science Advisory Table A Strategy for the Mass Distribution of COVID-19 Vaccines in Ontario Based on Age and Neighbourhood
We assumed that all Ontarians received mRNA-based vaccines, which as of February
25, 2021, are the only COVID-19 vaccines currently approved by Health Canada.
Based on trial data, we defined COVID-19 vaccine efficacy to be 0% in the week after
the first dose, 70% in week 2 post-vaccination, 85% in weeks 3-4 post vaccination,
90% in week 5 post-vaccination, and 95% thereafter.16 We assumed that all
vaccinated individuals received the second vaccine dose within approved
schedules,17 and that there were no indirect vaccine effects (i.e. we assumed no
herd immunity effects).16,18
We modelled the effectiveness of prioritization strategies in scenarios 2 and 3 as
compared with control scenario 1 using public health surveillance data limited to the
second wave of the COVID-19 pandemic, from September 1, 2020 to January 16,
2021. These analyses yielded daily projections for the entire 13-week vaccination
period, from March 1 to May 31, 2021, and allowed us to estimate daily rate ratios
comparing scenarios 2 and 3 with control scenario 1. The modelling process had five
steps and was based on regression models that were fit using the gamm4 package in R.
First, a regression model of predicted baseline incidence of SARS-CoV-2 infections
was developed. The prospective model estimated the predicted SARS-CoV-2
incidence in all Ontario neighbourhoods as a function of cumulative incidence from
the onset of the pandemic (January 23, 2020) until January 9, 2021. The prediction
model was based on a dataset of weekly neighbourhood SARS-CoV-2 incidence,
using a logistic count regression model. The model had a random intercept to
account for variation between neighbourhoods, and a penalized spline for time.
Based on this model, we estimated SARS-CoV-2 incidence deciles. Second, we
predicted the incidence of SARS-CoV-2 infections across the 100 cells defined by
neighbourhood risk and age band, using a tensor spline for the interaction of
neighbourhood risk and age.19 Third, we developed logistic count regression models
for the risk of COVID-19 hospitalization and death, among SARS-CoV-2 cases, which
yielded the probability of an event given case status. Fourth, we sorted cells defined
by age bands and neighbourhood risk groups from most to least likely to experience
the composite outcome of COVID-19 hospitalization or death. Based on this ranking
we sequentially determined, from March 1, 2021 onwards, the Ontarians prioritized
to receive the first dose of the COVID-19 vaccine each week, followed by the second
dose within approved schedules. Fifth, we projected the incidence forward based on
baseline SARS-CoV-2 incidence in risk group x age bands, and age band specific
vaccination levels and estimated daily rate ratios for scenario 2 as compared with
control scenario 1, and for scenario 3 as compared with control scenario 1.
Then, we used a deterministic, non-mechanistic model to project daily updated
plausible estimates of the incidence of COVID-19 cases and deaths, and of hospital
and ICU occupancy due to COVID-19 between February 25 and May 31, 2021, using
the following assumptions: First, there would be a linear increase in the log of the
effective reproduction number Rt for the traditional variant, originally identified in
Wuhan, China, associated with school openings and opening of the province from
log(1.00) as estimated on February 24, 2021, to log(1.09) three weeks later, with
1.09 reflecting the geometric mean Rt observed in Ontario for traditional variants
during the 3 weeks between December 1 and December 21, 2020. Second, the
province would go back into a lockdown with a province-wide stay-at-home order
starting on March 10, 2021, which would result in a decrease of Rt for the traditional
variants to 0.82 starting on March 20, 2021, 10 days after the lockdown. An Rt of
0.82 reflects the geometric mean found for the traditional variants during the 3
weeks between January 15 and February 4, 2021. Fourth, the B.1.1.7 variant would
be 40% more transmissible than traditional variants and would continue to follow a
Science Briefs | https://covid19-sciencetable.ca/science-briefs February 26, 2021 | 13Ontario COVID-19 Science Advisory Table A Strategy for the Mass Distribution of COVID-19 Vaccines in Ontario Based on Age and Neighbourhood
logarithmic growth curve with a doubling time for the odds of 11.3 days, as
observed between January 21 and February 24, 2021. We conservatively assumed
that this doubling time would remain constant over time and would not be
shortened by school openings and the opening of the province. Fifth, daily hospital
occupancy (including ICU) from COVID-19 would be 5.7% of daily active cases, with
5.7% reflecting the mean percentage observed between December 24, 2020, and
February 24, 2021, with an assumed time lag of 10 days between daily active cases
and daily hospital occupancy, and a mean duration of 10 days for cases to be
considered active. Sixth, daily ICU occupancy would be at 30.5% of hospital
occupancy due to COVID-19, the mean percentage observed between December 8,
2020, and February 24, 2021, with a time lag of 10 days between daily hospital
occupancy and daily ICU occupancy. Seventh, daily deaths caused by the traditional
variants would be at 0.14% of daily active cases, which reflects the mean percentage
observed during the three weeks between February 1 and February 21, 2021, after
the vaccine distribution in LTC and retirement homes became partially effective, and
the assumption that deaths would be further reduced by 10% once the vaccine
distribution in LTC and retirement homes became fully effective. Seventh, there
would be a relative increase in mortality of 30% associated with the B.1.1.7 variant
as compared with the traditional variants. Eighth, Rt would be modified by seasonal
changes in accordance with the inverse pattern observed in Ontario between August
1 and December 31, 2020, resulting in a progressive reduction of log(Rt) between
March 1 and May 31, 2021.20
We multiplied the daily estimates of incidence of SARS-CoV-2 infections, hospital
occupancy and deaths from COVID-19 with the daily rate ratios derived for scenarios
2 and 3 for vaccine distribution, and derived cumulative incidence curves of deaths,
hospitalizations and ICU admissions, and the cumulative numbers of SARS-CoV-2
cases, and COVID-19 hospitalizations, ICU admissions, and deaths between March 1
and May 31, 2021.
Author Contributions
KAB and PJ conceived of the Science Brief. KAB, NMS, and PJ wrote the first draft. EJ,
TVI, SB, PJ, and KAB conducted the analysis. All authors contributed to the
interpretation of analyses, revised the Science Brief critically for important
intellectual content and approved the final version.
The authors would like to thank Carmen Kong for creating the maps presented in
this Science Brief.
References
1. Bonanad C, García-Blas S, Tarazona-Santabalbina F, et al. The Effect of Age on
Mortality in Patients With COVID-19: A Meta-Analysis With 611,583 Subjects. J
Am Med Dir Assoc. 2020;21(7):915-918. https://doi.org/10.1016/
j.jamda.2020.05.045
2. van Ingen T, Brown KA, Buchan SA, Akingbola S, Daneman N, Smith BT.
Neighbourhood-Level Risk Factors of COVID-19 Incidence and Mortality.
Epidemiology; 2021. https://doi.org/10.1101/2021.01.27.21250618
3. Salmon D, Opel DJ, Dudley MZ, Brewer J, Breiman R. Reflections On Governance,
Communication, And Equity: Challenges And Opportunities In COVID-19
Vaccination: Article examines the engagement and communication steps
necessary to strengthen the COVID-19 vaccine roll out by federal, state, and
Science Briefs | https://covid19-sciencetable.ca/science-briefs February 26, 2021 | 14Ontario COVID-19 Science Advisory Table A Strategy for the Mass Distribution of COVID-19 Vaccines in Ontario Based on Age and Neighbourhood
local governments. Health Aff (Millwood). Published online February 4,
2021:10.1377/hlthaff. https://doi.org/10.1377/hlthaff.2020.02254
4. Bachireddy C, Dar M, Chen C. Medicaid and COVID-19 Vaccination—Translating
Equitable Allocation Into Equitable Administration. JAMA Health Forum. 2021;2
(2):e210114. https://doi.org/10.1001/jamahealthforum.2021.0114
5. Jean-Jacques M, Bauchner H. Vaccine Distribution—Equity Left Behind? JAMA.
Published online January 29, 2021. https://doi.org/10.1001/jama.2021.1205
6. Bibbins-Domingo K, Petersen M, Havlir D. Taking Vaccine to Where the Virus Is—
Equity and Effectiveness in Coronavirus Vaccinations. JAMA Health Forum.
2021;2(2):e210213. https://doi.org/10.1001/jamahealthforum.2021.0213
7. Government of Ontario. COVID-19 vaccination update. Technical Briefing
presented at the: January 13, 2021; Ontario. Accessed January 19, 2020. https://
files.ontario.ca/moh-covid-19-vaccine-technical-briefing-en-january-13-2021-
2021-01-13.pdf
8. Government of Ontario. COVID-19 response framework: keeping Ontario safe
and open. Ontario.ca. Published January 14, 2021. Accessed December 6, 2020.
https://www.ontario.ca/page/covid-19-response-framework-keeping-ontario-
safe-and-open
9. Brown KA, Gubbay J, Hopkins J, et al. Rapid Rise of S-Gene Target Failure and the
UK variant B.1.1.7 among COVID-19 isolates in the Greater Toronto Area,
Canada. medRxiv. Published online February 12, 2021:2021.02.09.21251225.
https://doi.org/10.1101/2021.02.09.21251225
10. Stall NM, McGeer A, Maltsev A, et al. The impact of the speed of vaccine rollout
on COVID-19 cases and deaths in Ontario long-term care homes. Sci Briefs Ont
COVID-19 Sci Advis Table. 2021;2(8). https://doi.org/10.47326/
ocsat.2021.02.08.1.0
11. Government of Ontario. Getting a COVID-19 vaccine in Ontario. COVID-19
(coronavirus) in Ontario. Published 2021. Accessed February 17, 2021. https://
covid-19.ontario.ca/getting-covid-19-vaccine-ontario
12. Chen Y-H, Glymour M, Riley A, et al. Excess mortality associated with the COVID-
19 pandemic among Californians 18–65 years of age, by occupational sector and
occupation: March through October 2020. medRxiv. Published online January
22, 2021:2021.01.21.21250266. https://doi.org/10.1101/2021.01.21.21250266
13. Murti M, Achonu C, Smith BT, et al. COVID-19 Workplace Outbreaks by Industry
Sector and their Associated Household Transmission, Ontario, Canada, January –
June, 2020. medRxiv. Published online November 30,
2020:2020.11.25.20239038. https://doi.org/10.1101/2020.11.25.20239038
14. Amit S, Regev-Yochay G, Afek A, Kreiss Y, Leshem E. Early rate reductions of
SARS-CoV-2 infection and COVID-19 in BNT162b2 vaccine recipients. The Lancet.
2021;0(0). https://doi.org/10.1016/S0140-6736(21)00448-7
15. Chung H. Validation of COVID-19 Outcomes in Public Health Surveillance Data
using Health Administrative Databases. Published online October 21, 2020.
16. Jüni P, Tuite AR, Bogoch II, et al. Rollout strategy for the Pfizer-BioNTech COVID-
19 vaccine in Ontario. Sci Briefs Ont COVID-19 Sci Advis Table. 2021;2(6). https://
doi.org/10.47326/ocsat.2021.02.06.1.0
17. Public Health Agency of Canada. Recommendations on the use of COVID-19
vaccines. Published December 14, 2020. Accessed February 11, 2021. https://
Science Briefs | https://covid19-sciencetable.ca/science-briefs February 26, 2021 | 15Ontario COVID-19 Science Advisory Table A Strategy for the Mass Distribution of COVID-19 Vaccines in Ontario Based on Age and Neighbourhood
www.canada.ca/en/public-health/services/immunization/national-advisory-
committee-on-immunization-naci/recommendations-use-covid-19-
vaccines.html
18. Polack FP, Thomas SJ, Kitchin N, et al. Safety and Efficacy of the BNT162b2
mRNA Covid-19 Vaccine. N Engl J Med. 2020;383(27):2603-2615. https://
doi.org/10.1056/NEJMoa2034577
19. Pedersen EJ, Miller DL, Simpson GL, Ross N. Hierarchical generalized additive
models in ecology: an introduction with mgcv. PeerJ. 2019;7:e6876. https://
doi.org/10.7717/peerj.6876
20. Brown KA, Soucy J-PR, Buchan SA, et al. The mobility gap: estimating mobility
levels required to control Canada’s winter COVID-19 surge. medRxiv. Published
online February 1, 2021:2021.01.28.21250622. https://
doi.org/10.1101/2021.01.28.21250622
Science Briefs | https://covid19-sciencetable.ca/science-briefs February 26, 2021 | 16You can also read