A study of the autofluorescence of parylene materials for mTAS applications
←
→
Page content transcription
If your browser does not render page correctly, please read the page content below
PAPER                                                                                                    www.rsc.org/loc | Lab on a Chip

A study of the autofluorescence of parylene materials for mTAS applications
Bo Lu,*a Siyang Zheng,b Brandon Quoc Quacha and Yu-Chong Taia
Received 27th November 2009, Accepted 19th March 2010
First published as an Advance Article on the web 29th April 2010
DOI: 10.1039/b924855b

Parylene-C has been widely used as a biocompatible material for microfluidics and micro total analysis
system (mTAS) applications in recent decades. However, its autofluorescence can be a major obstacle
for parylene-C based devices used in applications requiring sensitive fluorescence detection. In this
paper, Parylene-C was compared with other commonly used polymer and plastic materials in mTAS
devices for their autofluorescence. We also report here an in-depth study of the behaviors and
mechanisms of the autofluorescence of parylene-C, as well as several other commercialized members in
the parylene family, including parylene-D, parylene-N and parylene-HT, using epifluorescence
microscopy, fluorimeter and infrared spectroscopy. Strong autofluorescence was induced in parylene-C
during short-wavelength excitation (i.e. UV excitation). Variation of autofluorescence intensity of
parylene-C film was found to be related to both dehydrogenation and photo-oxidation. Moreover, the
influence of microfabrication process on parylene-C autofluorescence was also evaluated. Parylene-HT,
which exhibits low initial autofluorescence, decreasing autofluorescence behavior under UV excitation
and higher UV stability, can be a promising alternative for mTAS applications with fluorescence
detection.

Introduction                                                               devices with fluorescence detection, especially for those that
                                                                           require ultraviolet (UV) light excitation. For instance, the strong
Polymers and plastics are playing an increasingly important role           autofluorescence in our previously reported parylene-C micro-
in the microfluidics and mTAS field.1,2 Compared to the devices            filters prevented us from using common chemical dyes, such as
adopting traditional materials like glass, quartz or silicon, rela-        DAPI (40 ,6-diamidino-2-phenylindole) (excitation maximum
tively inexpensive and disposable devices could be made with               (ex): 358 nm; emission maximum (em): 461 nm) or Hoechst
polymers and plastics.1 Depending on different applications, the           33342 (ex: 350 nm; em: 461 nm), and fluorophore (especially
bulk, surface or interface properties of those materials can               blue) conjugated antibodies for circulating tumor cell (CTC)
greatly affect the device performance. For instance, for a large           enumeration after on-chip enrichment from patient blood
number of biomedical applications, on-chip fluorescence detec-             samples (Fig. 2).12 Strong blue autofluorescence was also found
tion has been the golden standard. Many of them require precise            in parylene-C probe for neural prosthesis application, when
detection of small fluorescence signals due to the small sample            observing Hoechst stained neural stem cells.13 Although the
volume and low concentration of fluorophores.3–5 In these cases,           autofluorescence influence is less severe when detecting long
autofluorescence of the chip material itself becomes important,            wavelength fluorescence signals (e.g. green or red),14,15 it may still
since it may interfere or even overwhelm the signals of interest.          disturb the detection if the target fluorescence signal itself is very
However, it is well known that many polymers and plastics are              small, such as on-chip real-time PCR or on-chip flow cytometer
fluorescent when excited by UV or even visible light.6,7                   applications.5
   Parylene is a tradename for a group of poly(p-xylylene)                     Only a few reports have been devoted to parylene fluorescence
polymers (Fig. 1). It is gaining more and more attention for               study.16–19 Kochi et al.16 studied the emission spectrum of as-
microfluidics and mTAS applications.8–11 Parylene-C is the most            deposited parylene-N film and found an emission peak at
commonly used material in the parylene family. As a biocom-                370 nm, which was similar to the emission spectrum of trans-
patible polymer with the highest USP (U.S. Pharmacopeia) class             stilbene. The initial autofluorescence of parylene-N film was
VI approval, parylene-C has found numerous applications for                attributed to the small amount of C]C unsaturation in the main
biomedical implantation. This mechanically strong and flexible             chain induced during the pyrolytic production of parylene film.16
material has a Young’s modulus of 4 GPa and high malleability              No attention was paid, however, to the fluorescence behavior
that can withstand up to 200% elongation. Its high chemical                during continuous UV illumination or the possible expansion of
resistance is also desirable as a microfluidics and mTAS chip              the spectra into the visible range. It has been reported that
material. Unfortunately, the undesired autofluorescence of                 fluorescent sites could be created in parylene-C and parylene-D
parylene-C sometimes can be a major obstacle for its use in                film by 280 nm UV illumination,17 or by exposure to active argon
                                                                           or helium plasma.18 However, the possible mechanisms of the
a
                                                                           induced fluorescence and the fluorescence behavior during
  Caltech Micromachining Laboratory, California Institute of Technology,
MC 136-93, Pasadena, CA, 91125, USA. E-mail: lubo@mems.caltech.edu
                                                                           continuous UV illumination were not discussed. On the other
b
  Department of Bioengineering, Pennsylvania State University, 224         hand, like many other polymers, parylene-C and parylene-N film
Hallowell Building, University Park, PA, 16802-6804, USA                   suffer from degradation under long-time UV radiation due to

1826 | Lab Chip, 2010, 10, 1826–1834                                                     This journal is ª The Royal Society of Chemistry 2010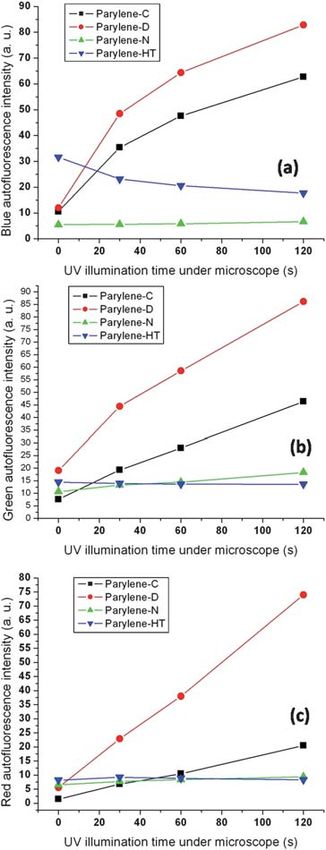
Fig. 1 Structure of parylene-C, parylene-D, parylene-N and parylene-HT films.

Fig. 2 Strong autofluorescence in parylene-C based dual-layer membrane CTC microfilter. Captured prostate cancer cells were doubly immunoflu-
orescence stained with red and green fluorescence dye conjugated anti-CK (a) and anti-PSA (b). The cell nucleus was stained with DAPI (c). Red and
green autofluorescence greatly disturbed the cell detection, while blue autofluorescence totally overwhelmed the stained cells.

UV induced photo-oxidation,20–24 but no correlation has been               other commonly used polymers and plastics, the following
studied between this degradation and the variation of fluores-             commercial materials were purchased: 1.52 mm poly-
cence behavior.                                                            (methylmethacrylate) sheet (PMMA, McMaster-Carr), 0.38 mm
   In this work, we report an in-depth study of the fluorescence           polycarbonate film (PC, McMaster-Carr), 50 mm polyimide film
behaviors and mechanisms of different kinds of parylene films.             (McMaster-Carr), 13 mm PET polyester film (McMaster-Carr),
Parylene-C was compared with other commercially available                  poly(dimethylsiloxane) (PDMS, Dow Corning Sylgard 184 kit),
polymers and plastics for their autofluorescence. Variation of             and 1.14 mm polystyrene tissue culture dish (Becton Dickinson
autofluorescence intensity of parylene-C film during continuous            Labware). 0.38 mm PDMS sheets were made by mixing the base
UV illumination was found to be related to both dehydrogena-               to curing agent at a 10 : 1 ratio, degassing, spin coating and
tion and photo-oxidation. The influence of microfabrication                baking according to manufacturer’s instruction. A 0.98 mm
process on parylene-C autofluorescence was also evaluated and              Corning glass microscope slide (Corning Inc.) was used as an
discussed. Enhanced autofluorescence during microscope                     autofluorescence reference.
observation, fluorescence detection or the fabrication process
makes parylene-C non-ideal for applications where auto-                    Observation and recording of fluorescence intensity
fluorescence is a concern. Several other commercialized parylene
materials, parylene-D, parylene-N and parylene-HT, were also               Fluorescence was observed under a Nikon E800 epifluorescence
studied. Among them, parylene-HT exhibits low initial auto-                microscope (Nikon Inc.). Excitation light came from a USH-
fluorescence with further intensity reduction under UV illumi-             102DH 100W mercury arc lamp source (Ushio Inc.), and passed
nation. Initial autofluorescence of parylene-HT film may come              through a dichromatic mirror and one of the following band-pass
from the residual dimer precursor inside the film, which can be            filters: UV-2E/C, B-2E/C and G-2E/C, with excitation wave-
efficiently attenuated to a very low level by intentional UV               lengths of 340–380 nm, 465–495 nm and 528–553 nm, and emis-
treatment. Given its much better autofluorescence behavior and             sion wavelengths of 435–485 nm (blue fluorescence), 515–555 nm
high UV stability, parylene-HT can be a useful alternative to              (green fluorescence) and 590–650 nm (red fluorescence), respec-
parylene-C if low autofluorescence is preferred.                           tively. Experiments were done with a 20 objective. Continuous
                                                                           UV illumination was carried out by using UV-2E/C filter. Images
                                                                           were taken with a CCD camera (RT-KE color 3-shot, Diagnostic
Experimental                                                               Instruments). The exposure time referred to the collecting time the
                                                                           CCD camera used to take an image. To avoid saturation of the
Materials
                                                                           image, sometimes the exposure time had to be adjusted for
Commercially available parylene dimer precursors DPX-C,                    different samples. The images were then transferred into 8-bit
DPX-D, DPX-N and parylene-HT (Specialty Coating Systems                    grayscale images and the fluorescence intensity distributions were
(SCS)), and diX-C (Daisan Kasei Co., Ltd) were purchased.                  calculated using a custom-coded MATLAB (V6.1.0.450, The
About 5 mm-thick Parylene films were deposited by a SCS PDS                Mathworks, Inc.) program. In order to evaluate the variations
2035CR parylene coating equipment. In this paper, unless                   from mercury arc lamp, fluorescence from the Corning glass
specifically stated, all the parylene films were deposited from SCS        microscope slide was used as an internal reference and measured
dimers. To compare fluorescence properties of parylene with                before each experiment and during long-time illumination. Both

This journal is ª The Royal Society of Chemistry 2010                                                     Lab Chip, 2010, 10, 1826–1834 | 1827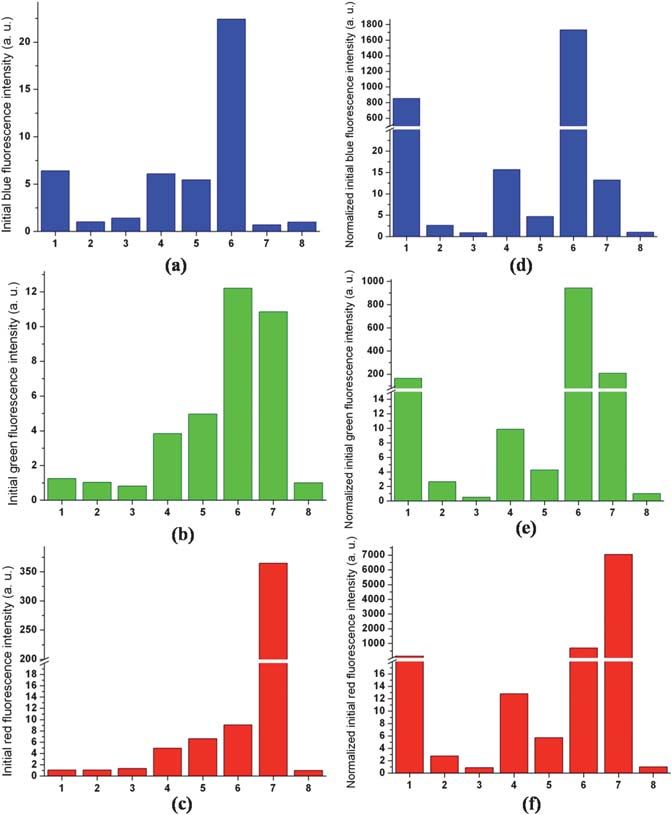
UV illumination and fluorescence measurement were performed          approximately proportional to the material thickness,6 the
under atmosphere at room temperature.                                intensities of materials were normalized to 5 mm thickness and also
   Vertical optical alignment during microscope observation may      compared in Fig. 3d–f. Among the selected materials, parylene-C
affect the autofluorescence signal observed.7 For thick samples,     has strong initial autofluorescence per unit thickness, although
autofluorescence intensities may be different when excitation is     not the worst one. For parylene-C, blue fluorescence intensity was
focused on different vertical positions of the materials.7           much higher than green or red fluorescence. For applications
However, for thin films, such as the parylene film we used (5 mm     requiring high sensitivity, extremely small fluorescence signals
thick), given our exposure and image processing methods, no          may be easily buried within this undesired autofluorescence noise.
clear difference was observed when excitation was focused on the
surface or into the bulk of the material. In our experiments,
                                                                     Autofluorescence behaviors during UV illumination
excitation was focused on the top surface of the materials.
                                                                     For many applications involving optical detection or observa-
Fluorescence spectra and infrared spectra                            tion, the polymer and plastic microchips will be illuminated for
                                                                     a period of time, thus the trend and variation of autofluorescence
The fluorescence spectra of both parylene film and dimer were        under continuous illumination, rather than the initial auto-
measured by a Jobin-Yvon JY3D spectrofluorimeter (HORIBA             fluorescence, are more important. Previous reports showed that
Jobin Yvon Inc.). To measure the spectra of the dimer, the dimer     a lot of polymers and plastics, including PDMS, PMMA, poly-
was dissolved in methanol first and the solution was placed inside   carbonate, polyester and polystyrene had decreasing auto-
a 3-Q-10 quartz fluorometer cuvette (Starna Cells, Inc.). The IR     fluorescence under continuous illumination, with complex
spectra of parylene films were recorded by a Nicolet 6700 FT-IR      kinetics which are still not fully understood.6,7 For all four kinds
Spectrometer (Thermo Fisher Scientific Inc.). UV illumination of     of parylene films studied here, continuous blue or green light
samples for these spectra experiments were prepared by a UV-         illumination under fluorescence microscope did not cause
Ozone (UVO) instrument (1.12 mW/cm2, 253.7 nm, Jelight               observable green or red autofluorescence intensity variation.
Company, Inc.) in the air environment (Ozone was not used            Surprisingly, for blue fluorescence under UV excitation, the
here), which could uniformly produce photo-chemically modified       initial intensity of parylene-C film dramatically increased during
films with large size.                                               a 2 min short-time UV illumination from the microscope light
                                                                     source (Fig. 4a). After UV illumination, green and red fluores-
Soaking test                                                         cence intensities of the exposed area were also enhanced (Fig. 4b
                                                                     and c). The same phenomena were also found in parylene-C film
In order to extract the possible fluorescent contaminants and find   deposited from diX-C dimer (data not shown). Fig. 5 shows the
the mechanism of fluorescence, parylene films were soaked in         quantitative measurements of fluorescence variations during
methanol, toluene and methylene dichloride solvents, accompa-        short-time UV illumination. Parylene-D film exhibited the same
nied by ultrasonic agitation.                                        behaviors of enhanced autofluorescence as parylene-C. Auto-
                                                                     fluorescence intensities of parylene-N film followed the similar
Cell filtration experiment with parylene membrane filters            trends but only slightly increased. However, parylene-HT film
                                                                     showed a reverse trend with clearly decreasing tendency for blue,
To show the influence of autofluorescence, both parylene-C and
                                                                     green and red fluorescence (Fig. 4d and Fig. 5).
parylene-HT membrane filtration devices for circulating tumor
                                                                        To study the fluorescence mechanism of parylene films, we
cell (CTC) detection were fabricated by a previously reported
                                                                     extended the UV illumination experiments to a long period up to
process.4 No autofluorescence pretreatment was performed on
                                                                     1000 min and recorded the blue fluorescence intensity variations.
the parylene-HT filter. Cultured human prostate cancer cell line
                                                                     Both parylene-C and parylene-D showed a two-stage fluores-
LnCaP was used for CTC capture experiments. Cancer cells were
                                                                     cence behavior. During initial short-time UV illumination, blue
spiked into phosphate buffered saline (PBS), and the samples
                                                                     fluorescence increased dramatically (stage 1, Fig. 6a and
were filtrated using both parylene-C and parylene-HT membrane
                                                                     b insets). However, after reaching its maximum value, the fluo-
filters. In order to enumerate the captured cells and observe the
                                                                     rescence intensity started to decay gradually in the following
nucleus morphology, cells were first fixed in 100% methanol on-
                                                                     long-time UV illumination (stage 2, Fig. 6a and b). For parylene-
filter, and then doubly stained with both Acridine Orange (AO)
                                                                     N, during the 1000 min illumination, only the increasing stage
and DAPI. After staining, filters were extensively washed in PBS
                                                                     was observed (Fig. 6c). The long-time illumination of parylene-
to remove the fluorescent dyes remaining on the filter surface.
                                                                     C, parylene-D and parylene-N were accompanied by a yellow
                                                                     discoloration of the film. Parylene-D had the fastest rate and
Results and discussion                                               largest extent of discoloration, while parylene-N had the slowest
                                                                     rate and only slight extent of discoloration even for longer illu-
Comparison of autofluorescence
                                                                     mination time. Interestingly, although parylene-HT had the
Fig. 3a–c show the comparison of initial autofluorescence inten-     largest initial fluorescence intensity, it decreased exponentially
sities of 5 mm thick as-deposited parylene-C film with other         from the beginning within a short time upon illumination
commonly used commercially available polymers and plastics,          (Fig. 6d), without any sign of yellow discoloration. Three
including PDMS, PMMA, polycarbonate, polystyrene, polyester          conclusions can be readily drawn from the analysis: (1) During
and polyimide, measured by the epifluorescence microscope.           microscope observation or optical detection where UV light is
Since it is reasonable to assume the initial intensity was           involved, strong autofluorescence of parylene-C and parylene-D

1828 | Lab Chip, 2010, 10, 1826–1834                                              This journal is ª The Royal Society of Chemistry 2010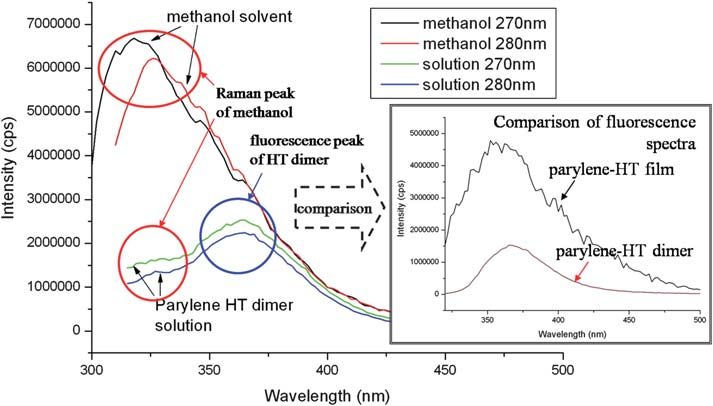
Fig. 3 Comparisons of relative initial autofluorescence intensities of parylene-C with other polymers and plastics. (1): 5 mm parylene-C; (2): 380 mm
PDMS; (3): 1.52 mm PMMA; (4): 380 mm polycarbonate; (5): 1.14 mm polystyrene; (6): 12.7 mm polyester; (7): 50.8 mm polyimide; (8): 980 mm Corning
glass slide (control). Autofluorescence of Corning glass microscope slide was set as 1 (a. u.), and all the other fluorescence intensities were relative to this
reference. (a)–(c) show blue, green and red autofluorescence of materials with different thicknesses as purchased or fabricated. (d)–(f) show blue, green
and red autofluorescence of materials normalized to 5 mm thickness. All measurements were carried out with a 20 objective. Exposure time: blue (1 s),
green (10 s), red (10 s).
can be quickly induced within the first several minutes. Although short-time UV illumination, resulting in the enhanced fluores-
the increase of parylene-N autofluorescence is much slower, it cence in the visible range (Fig. 7). Corresponding infrared (IR)
lasts for a long time. (2) For parylene-C and parylene-D, once spectra of parylene-C film are shown in Fig. 8. The peaks in the
the autofluorescence is induced, it takes a long time to reduce the region of 14501610 cm1 could be attributed to C]C double
autofluorescence back to the initial level, accompanied by the bond stretching vibrations. After 5 min illumination, an increase
degradation of films. (3) In contrast, UV illumination can effi- of the absorption peak around 1560 cm1 occurred, which could
ciently bleach the autofluorescence of parylene-HT to a very low be interpreted to the increasing amount of C]C bonds in the
level within a short time period. Moreover, we observed that the chain adjacent to the benzene ring. This change of chemical
autofluorescence variations of parylene materials were irrevers- structure was likely to be a sign of the scission of chain C–H
ible after the UV illumination was shut down. Discontinuous bonds and the occurrence of dehydrogenation. During the long-
illumination with time intervals did not change the auto- time UV illumination, however, a reduction of emission band
fluorescence variation tendency. magnitude was observed from fluorescence spectra, with
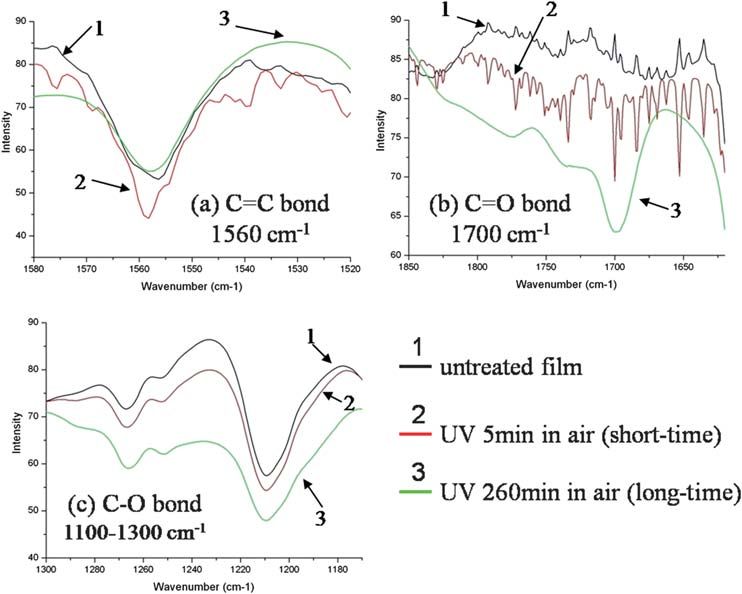
unchanged spectra shape and peak location (Fig. 7). In IR
spectra, C]C absorption decreased, while C–O (1100–
Fluorescence mechanism of parylene-C film
1300 cm1) band and C]O (around 1700 cm1) peak appeared
Fluorescence spectra of parylene-C film showed that the emis- and increased (Fig. 8). This evidence indicated that oxidation
sion band was red shifted from UV range to visible range during happened during long-time illumination.
This journal is ª The Royal Society of Chemistry 2010 Lab Chip, 2010, 10, 1826–1834 | 1829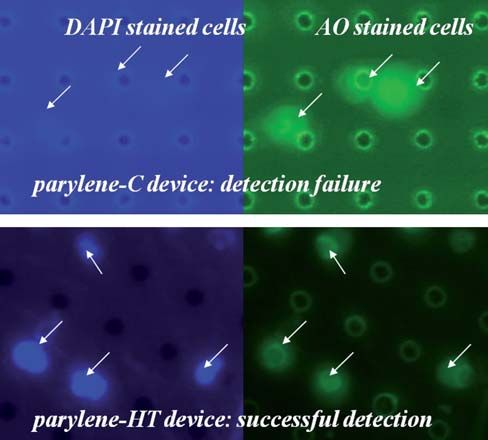
Fig. 4 (a)–(c): Enhanced blue (a), green (b) and red (c) autofluorescence
of parylene-C film after 2 min short-time UV illumination. The brighter
area was the exposed area under the microscope objective. The darker
area was the unexposed area. (d): Reduced blue autofluorescence of
parylene-HT film after 2 min short-time UV illumination. The darker
area was the exposed area. Images for reduced green or red auto-
fluorescence of parylene-HT were not shown here because the brightness
changes were too small for visual discretion. Experiments were carried
out with a 20 objective. Exposure time: blue (500 ms), green (10 s), red
(10 s).

   A few conclusions can be drawn from the above experiment
results: (1) fluorescence intensity variations of parylene-C film
were related to the variation of unsaturated C]C bonds in the
main chain. Analogous to parylene-N, the initial low fluores-
cence of parylene-C might also come from the small amount of
C]C defects in the main chain generated during the deposition
process.16 (2) During short-time UV illumination, dehydroge-
nation dominated and an increasing amount of C]C bonds
formed. This led to an increased conjugation length, which was
responsible for the red shift of the fluorescence spectra from the
UV range to the visible range.25 On the other hand, photo-
oxidation was limited by oxygen diffusion into the film.20–24
During the initial illumination, although photo-oxidation also
occurred, it was insignificant due to the insufficient contact
                                                                            Fig. 5 Quantitative fluorescence intensity variations of parylene films
between oxygen and carbon molecules. (3) During long-time UV
                                                                            during continuous short-time UV illumination. (a) Blue fluorescence; (b)
illumination, photo-oxidation gradually became dominant.
                                                                            green fluorescence; (c) red fluorescence. For all kinds of parylene, film
C]C bonds in the main chain were oxidized into C–O or C]O                   thickness was 5 mm. Experiments were carried out with a 20 objective.
bonds, resulting in the reduction of fluorescence magnitude.                Exposure time: blue (100 ms), green (10 s), red (10 s).

Fluorescence mechanism of parylene-D and parylene-N films
                                                                            induced photo-oxidation, chloro-related photolytical photo-
Here we present a hypothesis to explain the difference in kinetics          products forming at the surface of parylene-C after C–Cl bond
of fluorescence change in parylene-C, parylene-D and parylene-              scission could prevent the absorption of UV light during subse-
N. Parylene-D and parylene-N have essentially the same                      quent illumination. The formation of these UV-absorbing
structure with parylene-C, modified only by the number of                   photoproducts might also be a plausible explanation for the
substitution of chlorine atoms for aromatic hydrogens.                      different fluorescence behaviors observed.
Following very similar fluorescence variation trends with both                 During the early stage of UV illumination, dehydrogenation of
increasing and decreasing stages, parylene-D was likely to have             the chain carbons occurred, accompanied by fluorescence
the same fluorescence mechanism with parylene-C. However, up                increase. Oxidation at this point started from the surface and was
to 1000 min illumination, no decreasing stage was observed for              slow since its rate was limited by oxygen diffusion into the pary-
parylene-N, which was probably due to the absence of chlorine               lene film.23,24 Fluorescence reached its peak when, for parylene-C
substitution. Bera et al.21 found that during the early stage of UV         and parylene-D, the chloro-related photolytical photoproducts

1830 | Lab Chip, 2010, 10, 1826–1834                                                      This journal is ª The Royal Society of Chemistry 2010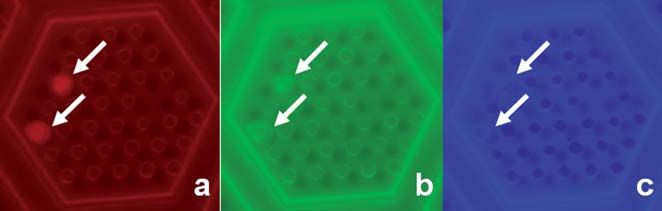
Fig. 6 Quantitative blue fluorescence intensity variations of parylene films during continuous long-time UV illumination. (a) Parylene-C film; (b)
parylene-D film; (c) parylene-N film; (d) parylene-HT film. The insets in (a) and (b) show the increasing stage of the curves. For all kinds of parylene, film
thickness was 5 mm. Experiments were carried out with a 20 objective. To prevent saturation, exposure time was 100 ms.

                                                                                 dehydrogenation was able to continue for a much longer time
                                                                                 by accessing hydrogens deeper in the bulk. Photo-oxidation
                                                                                 was able to compete, but not yet dominate, during this longer
                                                                                 time span, limiting the rate and extent of fluorescence increase.
                                                                                 This resulted in a gradually increasing fluorescence curve
                                                                                 throughout the 1000 min illumination. The decreasing stage of
                                                                                 parylene-N may be expected when illumination time is suffi-
                                                                                 ciently long, the chain hydrogens in the bulk become scarce,
                                                                                 further dehydrogenation slows down, and oxidation finally
                                                                                 becomes dominant.

                                                                                 Fluorescence mechanism of parylene-HT film

                                                                                 Parylene-HT replaces the chain hydrogen of parylene-N with
                                                                                 fluorine. Since the strength of C–F bond is much higher than C–
Fig. 7 Fluorescence spectra of parylene-C film, under 280 nm excitation,         H bond, fluorine extraction is unlikely to occur during UV illu-
measured by fluorimeter.                                                         mination, which was also verified by fluorescence and IR spectra.
                                                                                 No shift of emission band was observed from fluorescence
                                                                                 spectra during UV illumination. Reduction of spectra magnitude
near the surface prevented UV light from penetrating deeper into                 was in accordance to the decreasing fluorescence intensity. IR
the film, thus greatly slowing down dehydrogenation as the                       spectra of parylene-HT film showed no clear change in the
surface chain hydrogens were consumed. This set the stage for                    regions of chain C]C bonds, C]O or C–O bonds, indicating
fluorescence to decrease as photo-oxidation, during which the                    the fluorine extraction and photo-oxidation were unlikely to
C]C double bonds became oxidized and no longer contributed                       happen under UV illumination (data not shown).
to fluorescence, began to dominate.                                                 To find the fluorescence mechanism of parylene-HT film,
   For the non-halogen parylene-N, UV illumination was not                       fluorescence spectra of parylene-HT film and its dimer precursor
accompanied by the formation of UV-absorbing products, thus                      were compared. To measure the spectra of the dimer, we first

This journal is ª The Royal Society of Chemistry 2010                                                              Lab Chip, 2010, 10, 1826–1834 | 1831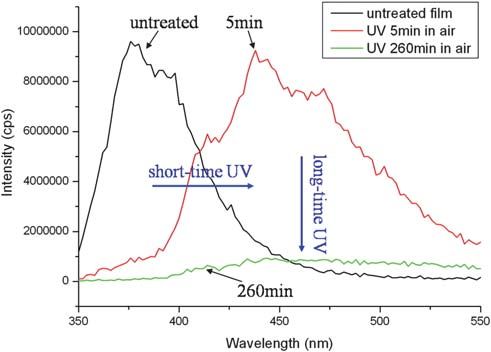
Fig. 8 Infrared spectra of parylene-C film, measured by infrared spectrometer.

scanned the spectra of methanol solvent, then dissolved the               indicating the fluorescence of parylene-HT film might come from
dimer in methanol and measured the spectra of the solution.               the residual dimer inside the film (Fig. 9).
Fig. 9 shows that there were two peaks for the spectra of the                We also verified this conclusion by soaking tests with meth-
solution. When excitation wavelength increased, the peak loca-            anol, toluene and methylene dichloride. Soaking tests with these
tion of methanol spectra also shifted, while the other peak               three solvents had no effects on the fluorescence of parylene-C,
remained at the same location and only the intensity decreased,           parylene-D and parylene-N films. Although methanol or toluene
which meant the former one was the Raman spectrum of meth-                still failed to vary the fluorescence of parylene-HT film, methy-
anol and the latter was the fluorescence spectrum of parylene-HT          lene dichloride could effectively reduce the fluorescence intensity
dimer. A comparison of fluorescence spectra of parylene-HT                of parylene-HT film. After 1.5 h of soaking, the fluorescence
dimer and film showed the similar peak shape and location,                intensity was reduced to 35% of its initial level. Therefore,

Fig. 9 Fluorescence spectra of parylene-HT dimer and film. Dimer was dissolved in methanol. Inset compares the spectra of parylene-HT dimer and
film, which have similar shape and peak location.

1832 | Lab Chip, 2010, 10, 1826–1834                                                    This journal is ª The Royal Society of Chemistry 2010
methylene dichloride could dissolve and soak out the residual to the same thickness. The additional autofluorescence was likely
dimer inside the film, resulting in the reduction of fluorescence of induced during the microfabrication processes, especially for
the film. One possible explanation of the time-dependent fluo- steps where short-wavelength light sources were used or gener-
rescence intensity reduction of parylene-HT film under UV illu- ated, such as photolithography, plasma etching and metal
mination could be the photobleaching of fluorophores in the deposition in e-beam evaporator. Moreover, it was believed that
dimer. It is also possible that the cleavage of the dimer to its heating parylene film to above certain temperatures could cause
monomeric form happened under UV illumination, resulting in the crystalline phase transitions, resulting in the increase of long-
the loss of its fluorescence property. wavelength fluorescence.16 Hence several thermal processes,
including vaccum annealing and molten parylene in N2 envi-
ronment, were also possibly the suspicious sources of induced
Autofluorescence problem and possible solutions for parylene strong autofluorescence.
based device Although long-time UV illumination can reduce the auto-
fluorescence, it also degrades the mechanical properties of pary-
Parylene-C is the most popular member in the parylene family
lene-C. It was reported that carboxyl groups were produced on
and has become the choice of chip material for many applica-
parylene-C surface during photo-oxidation process.21–23 In our
tions. However, besides its initial autofluorescence, the undesired
experiments, parylene-C film turned yellow and became brittle
autofluorescence of parylene-C based devices can also be easily
after long-time UV illumination, losing the advantage of its
induced during epifluorescence microscope observation and UV
mechanical properties.
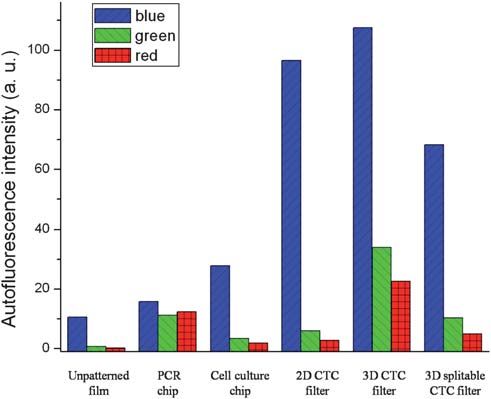
illuminated fluorescence detection. Moreover, it was noticed that
Given this disadvantage, parylene-C may not be the best chip
for several polymers and plastics, the microchips exhibited higher
material if sensitive fluorescence detection is required. For these
autofluorescence than the raw materials from which they had
applications, parylene-HT should be considered as an alterna-
been made.7 Here we compare the autofluorescence of unpat-
tive. The fast decreasing autofluorescence profile under UV
terned parylene-C film with parylene-C based microdevices
excitation ensures low fluorescence background during micro-
(Fig. 10). Several mTAS devices, including a real-time PCR chip,5
scope observation and optical detection. Moreover, since pary-
a cell culture chamber,9 a 2D membrane CTC filter,4 a 3D
lene-HT has better autofluorescence performance under UV
membrane CTC filter12 and a 3D splitable membrane CTC
excitation and higher UV stability, the fabrication processes
filter,26 were fabricated following different microfabrication
mentioned above did not induce additional autofluorescence in
processes as described in details in previous publications. In all of
parylene-HT devices. If necessary, intentional UV illumination
those devices, there was parylene-C deposited on low-auto-
can be employed as a pretreatment to reduce the initial auto-
fluorescence silicon substrate or parylene-C freestanding struc-
fluorescence of parylene-HT devices to a desired level. For
tures. The influences of other possible fluorescent materials, such
instance, it took about 35 min, 140 min and 230 min to reduce the
as SU-8 layer, were excluded by observation of the areas without
autofluorescence magnitude to 20%, 10% and 5% of its original
these materials. Fig. 10 shows that in all cases, parylene-C
level, respectively (Fig. 6d). Because of its high UV stability, the
structures in microdevices exhibited considerably higher auto-
mechanical properties of parylene-HT were not influenced after
fluorescence than unpatterned parylene-C film, after normalized
the pretreatment.
Application
As an example illustrating the advantage of the low auto-
fluorescence of parylene-HT, Fig. 11 shows the CTC capture and
fluorescence enumeration experiments with parylene-C and
parylene-HT based membrane filters. For CTC enumeration,
usually antibodies conjugated with red and green fluorophores
were used to differentiate captured CTCs and white blood cells.
In order to view the cancer cell nucleus morphology, blue fluo-
rescence staining of cell nucleus was also required.27,28 Previ-
ously, autofluorescence of parylene-C led to a bad contrast
between stained nucleus and the background or even detection
failure.27 Here we show the improvement of blue fluorescence
detection with parylene-HT filter. Cancer cells were doubly
stained with both DAPI and AO nucleus dyes. In both cases,
green fluorescence from AO staining was only used as a refer-
ence, showing the locations of captured cells. For parylene-C
device, blue autofluorescence totally overwhelmed the DAPI
Fig. 10 Comparisons of autofluorescence of unpatterned parylene-C
film and parylene-C based devices, including a PCR chip,5 a cell culture stained cell nucleus, while the low autofluorescence of parylene-
chip,9 a 2D CTC filter,4 a 3D CTC filter12 and a 3D splitable CTC filter.26 HT device ensured successful detection and observation of the
The thickness of all samples was normalized to 5 mm. Experiments were nucleus morphology. In this experiment, no autofluorescence
carried out with a 20 objective. Exposure time: blue (100 ms), green pretreatment was performed on parylene-HT filter, because the
(1 s), red (1 s). DAPI staining was strong. For other applications where the
This journal is ª The Royal Society of Chemistry 2010 Lab Chip, 2010, 10, 1826–1834 | 1833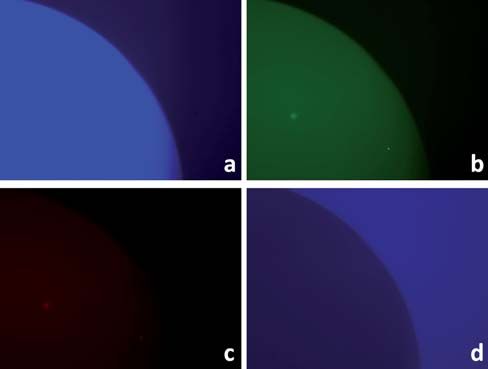
Dr John Bercaw’s group of Caltech for their FT-IR Spectrom-
                                                                              eter. The author would like to thank Alec Durrell and Alex
                                                                              Miller for equipment training and experiment assistance. Also
                                                                              the authors would like to thank Kuang Shen from the Chemistry
                                                                              Department of Caltech for his helpful discussion and assistance.
                                                                              The funding is provided by NIH, under Award Number
                                                                              4000072624.

                                                                              References
                                                                               1 H. Becker and C. Gartner, Anal. Bioanal. Chem., 2008, 390, 89–111.
                                                                               2 J. West, M. Becker, S. Tombrink and A. Manz, Anal. Chem., 2008, 80,
                                                                                 4403–4419.
                                                                               3 Y. S. Shin, K. Cho, S. H. Lim, S. Chung, S. -J. Park, C. Chung,
                                                                                 D. -C. Han and J. K. Chang, J. Micromech. Microeng., 2003, 13,
                                                                                 768–774.
                                                                               4 S. Zheng, H. K. Lin, J.-Q. Liu, M. Balic, R. Datar, R. J. Cote and
                                                                                 Y.-C. Tai, J. Chromatogr., A, 2007, 1162, 154–161.
                                                                               5 Q. C. Quach and Y. -C. Tai, Proc. of Hilton Head 2008, Hilton Head
                                                                                 island, SC, USA, 2008, 264–267.
                                                                               6 K. R. Hawkins and P. Yager, Lab Chip, 2003, 3, 248–252.
                                                                               7 A. Piruska, I. Nikcevic, S. H. Lee, C. Ahn, W. R. Heineman,
Fig. 11 CTC filtration and enumeration experiments with parylene-C               P. A. Limbach and C. J. Seliskar, Lab Chip, 2005, 5, 1348–1354.
and parylene-HT membrane filters. Captured cancer cells were doubly            8 J. Xie, Y. Miao, J. Shih, Y. -C. Tai and T. D. Lee, Anal. Chem., 2005,
stained with DAPI and AO. Experiments were carried out with a 20                77, 6947–6953.
objective. Exposure time: parylene-C filter (green: 5 s; blue: 30 ms);         9 M. C. Liu, D. Ho and Y. -C. Tai, Sens. Actuators, B, 2008, 129, 826–
parylene-HT filter (green: 5 s; blue: 500 ms). Parylene-C device had strong      833.
autofluorescence intensity, even with a much shorter exposure time.           10 P. J. Chen, D. Rodger, R. Agrawal, S. Saati, E. Meng, R. Varma,
                                                                                 M. Humayun and Y. -C. Tai, J. Microelectromech. Syst., 2008, 17,
Parylene-HT device showed low autofluorescence which ensured the                 1342–1351.
successful detection of DAPI stained cells. Green fluorescence with AO        11 J. Erickson, A. Tooker, Y. -C. Tai and J. Pine, J. Neurosci. Methods,
staining was only used as a reference to show captured cell locations.           2008, 175, 1–16.
                                                                              12 S. Zheng, H. K. Lin, R. J. Cote and Y. -C. Tai, Proc. of Hilton Head
                                                                                 2008, Hilton Head island, SC, USA, 2008, 134–137.
target signal is very weak, pretreatment on parylene-HT device                13 E. K. Purcell, J. P. Seymour, S. Yandamuri and D. R. Kipke,
for lower autofluorescence may be necessary.                                     J. Neural Eng., 2009, 6, 026005.
                                                                              14 J. R. Webster, M. A. Burns, D. T. Burke and C. H. Mastrangelo,
                                                                                 Anal. Chem., 2001, 73, 1622–1626.
Conclusion                                                                    15 C. Tung, R. Riehn and R. H. Austin, Biomicrofluidics, 2009, 3,
                                                                                 031101.
In this work, a comparison of initial autofluorescence of pary-               16 M. Kochi, K. Oguro and I. Mita, Eur. Polym. J., 1988, 24, 917–921.
lene-C and other commonly used polymers and plastics were                     17 W. F. Beach, T. M. Austin and B. J. Humphrey, European Patent
                                                                                 Application No. 0 449 291A2, 1991.
studied. For parylene-C, autofluorescence can be easily enhanced              18 J. H. Yira and W. F. Beach, U.S. Patent No. 5139813, 1992.
during epifluorescence microscope observation, UV illuminated                 19 Y. Takai and J. H. Calderwood, Makromol. Chem. Rapid Commun.,
fluorescence detection or microfabrication process. Hence,                       1980, 1, 17–21.
                                                                              20 M. Bera, A. Rivaton, C. Gandon and J. L. Gardette, Eur. Polym. J.,
autofluorescence of parylene-C can become an obstacle for its
                                                                                 2000, 36, 1753–1764.
use in mTAS applications where sensitive fluorescence detection               21 M. Bera, A. Rivaton, C. Gandon and J. L. Gardette, Eur. Polym. J.,
is required. By studying the different dynamics and mechanisms                   2000, 36, 1765–1777.
of several materials in the parylene family, including parylene-C,            22 J. B. Fortin and T. -M. Lu, Thin Solid Films, 2001, 397, 223–228.
                                                                              23 K. G. Pruden, K. Sinclair and S. Beaudoin, J. Polym. Sci., Part A:
parylene-D, parylene-N and parylene-HT, we showed that                           Polym. Chem., 2003, 41, 1486–1496.
parylene-HT, which has better autofluorescence performance, as                24 K. G. Pruden and S. P. Beaudoin, J. Polym. Sci., Part A: Polym.
well as good UV stability, might be a promising alternative chip                 Chem., 2004, 42, 2666–2677.
material if autofluorescence is a concern. The methods and                    25 G. Padmanaban and S. Ramakrishnan, J. Am. Chem. Soc., 2000, 122,
                                                                                 2244–2251.
conclusions here are also valuable to the study of other polymers             26 B. Lu, S. Zheng, S. Xie and Y. -C. Tai, Proc. of mTAS 2009, Jeju,
and plastics for mTAS applications.                                              Korea, 2009, 588–590.
                                                                              27 H. K. Lin, Ph.D. Thesis, University of Southern California, Los
                                                                                 Angeles, CA, USA, 2008.
Acknowledgements                                                              28 S. Nagrath, L. V. Sequist, S. Maheswaran, D. W. Bell, D. Irimia,
                                                                                 L. Ulkus, M. R. Smith, E. L. Kwak, S. Digumarthy,
The authors would like to thank Beckman Institute Laser                          A. Muzikansky, P. Ryan, U. J. Balis, R. G. Tompkins,
Resource Center of Caltech for the spectrofluorimeter, and                       D. A. Haber and M. Toner, Nature, 2007, 450, 1235–1239.

1834 | Lab Chip, 2010, 10, 1826–1834                                                        This journal is ª The Royal Society of Chemistry 2010
You can also read