A Study of the Green Building Benefits in Apartment Buildings According to Real Estate Prices: Case of Non-Capital Areas in South Korea
←
→
Page content transcription
If your browser does not render page correctly, please read the page content below
sustainability

Article
A Study of the Green Building Benefits in Apartment
Buildings According to Real Estate Prices: Case of
Non-Capital Areas in South Korea
Kee Han Kim, Sang-Sub Jeon, Amina Irakoze and Ki-young Son *
 School of Architectural Engineering, University of Ulsan, 93 Daehak-Ro, Ulsan 44610, Korea;
 keehankim@ulsan.ac.kr (K.H.K.); sangsub7419@gmail.com (S.-S.J.); aminah079@gmail.com (A.I.)
 * Correspondence: sky9852111@ulsan.ac.kr; Tel.: +82-52-259-2788

 Received: 31 January 2020; Accepted: 9 March 2020; Published: 12 March 2020

 Abstract: Recently, the importance of green building certification in consideration of environmentally
 friendly factors is being emphasized more when constructing buildings in South Korea. The Green
 Standard for Energy and Environmental Design (G-SEED) is one of the strategies used by the Korean
 government to effectively reduce building environmental loads. However, due to the large investment
 needed to acquire green building certification, building owners, stakeholders, and designers often
 contemplate how to balance G-SEED certification benefits and the additional costs they involve.
 Therefore, the purpose of this study was to assess the benefits of G-SEED certification in terms of
 post-occupancy financial advantages through a comparative analysis of real estate prices of apartments
 in the Yeongnam area. All of the major factors affecting apartment real estate prices in South Korea
 were considered, and the real estate price difference between G-SEED certified and non-certified
 apartments was determined through a one-sample t-test. The results demonstrated that G-SEED
 certified apartment real estate prices were 9.52% higher than non-certified apartments. This study
 concluded that G-SEED certification–related investment is worth the additional cost as it increases
 the real estate value of a building.

 Keywords: G-SEED; real estate price; apartment; t-test

1. Introduction

1.1. Background and Objectives
      Recently, environmental issues related to buildings have become a great concern worldwide.
South Korea, like other nations, has made significant efforts to reduce environmental loads related to
buildings by enacting a green building certification system. In South Korea, the building sector account
for 33% of energy consumption and 40% of natural resources consumption, respectively. In addition,
this sector alone is responsible for 50% of all CO2 emissions and 20% to 50% of other wastes that have
deleterious effects on the environment [1]. Therefore, the numerous discussions and investigations
that are underway to enhance the environment have been markedly directed toward the reduction of
building energy use and CO2 emissions.
      The Korean green building certification system was initiated in early 2002 by the Ministry of
Land, Infrastructure, and Transport together with the Ministry of Environment to reflect the opinions,
recommendations, and research findings of various academic and research institutions. Initially, the
certification was only applied to multi-residential buildings and it was later extended to commercial
buildings and educational facilities. In 2013, the certification scope was expanded to all buildings
larger than 3000 m2 , and the certification program has been reestablished and renamed the Green
Standard for Energy and Environmental Design (G-SEED) [2].

Sustainability 2020, 12, 2206; doi:10.3390/su12062206                     www.mdpi.com/journal/sustainability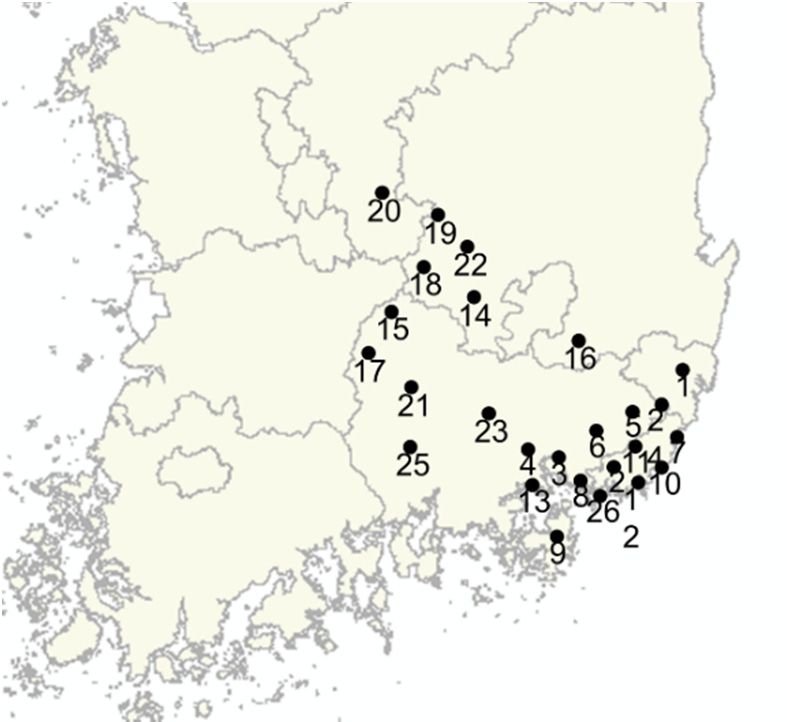
Sustainability 2020, 12, 2206 2 of 11
certification was only applied to multi-residential buildings and it was later extended to commercial
Sustainability 2020, 12, 2206 2 of 10
buildings and educational facilities. In 2013, the certification scope was expanded to all buildings larger
than 3000 m2, and the certification program has been reestablished and renamed the Green Standard for
Energy and its
Upon Environmental
implementation,Design (G-SEED)
G-SEED has[2].
successfully increased the number of green certified
Upon its
buildings, implementation,
where more than G-SEED has successfully
1000 buildings have been increased the number
certified of green
every year. certified buildings,
According to the
where more than 1000 buildings have been certified every year. According
green building certification status by the Korea Environmental Industry and Technology Institute to the green building
certification
(KEITI), a total status
of by the Korea
10,000 Environmental
buildings Industry
were certified betweenand Technology
2002 and 2018, Institute
among (KEITI),
which a total
3631of 10,000
were
buildings were certified
multi-residential between
buildings. The2002 and 2018,
statistics among which
of building 3631 were
certification multi-residential
by building buildings.
type indicated thatThe
statistics of building
in 2018, school certification
facilities had the by building
greatest type
green indicated
building that in 2018,
certification school
rate (29%).facilities had the greatest
From January 2019,
green
multi-residential buildings had the highest rate, with a green building certification the
building certification rate (29%). From January 2019, multi-residential buildings had ratehighest
of 28%, rate,
with a green
followed building
by school certification
and commercial rate of 28%, which
facilities, followed hadby27%
school
andand15%commercial
green buildingfacilities, which had
certification
27% and 15% green building certification rates, respectively [2]. It is perceived that
rates, respectively [2]. It is perceived that the number of green certified residential buildings is steadily the number of green
certified residential buildings is steadily increasing as the Korean government
increasing as the Korean government emphasizes the importance of environment conservation. emphasizes the importance
of environment
To meet itsconservation.
agenda for reduced building energy consumption and CO2 emissions, the Korean
To meet its agenda for reduced building energy consumption and CO2 emissions, the Korean
government promotes green building design by providing various incentives to buildings with green
government promotes green building design by providing various incentives to buildings with green
certification, such as alleviating standards for building volume and height limits as well as reductions of
certification, such as alleviating standards for building volume and height limits as well as reductions of
local taxes, environmental improvement levies, and building certification fees. Nonetheless, to receive
local taxes, environmental improvement levies, and building certification fees. Nonetheless, to receive
green certification, building owners are required to considerably invest for reducing environmental
green certification, building owners are required to considerably invest for reducing environmental loads
loads in terms of building design, material production, construction, maintenance, etc. Due to this
in terms of building design, material production, construction, maintenance, etc. Due to this inevitable
inevitable investment that affects the entire life cycle of a building, a comparative analysis is needed to
investment that affects the entire life cycle of a building, a comparative analysis is needed to weigh the
weigh the benefits of green certification and the costs it incurs.
benefits of green certification and the costs it incurs.
Comparative analyses of real estate prices of green certified and non-certified apartment buildings
Comparative analyses of real estate prices of green certified and non-certified apartment buildings
have beenconducted.
have been conducted.However,
However, allall previous
previous studies
studies mainly
mainly focused
focused on major
on major citiescities
suchsuch as Seoul
as Seoul and the
and the Gyeonggi area. Given that building values highly depend on location,
Gyeonggi area. Given that building values highly depend on location, more comparative studies are more comparative
studies are
needed needed
for small fornon-capital
and small and non-capital cities. the
cities. Therefore, Therefore,
purposetheof purpose
this study ofwas
this to
study was to
evaluate theevaluate
impact of
the impact of Korean green certification on the real estate market for apartment
Korean green certification on the real estate market for apartment buildings located in different cities buildings located in of
different cities
Gyeongsang of Gyeongsang
area, including Busan,area,Ulsan,
including
and Busan,
Daegu. Ulsan, and Daegu.
1.2. Research
1.2. ResearchMethod
Methodand
andScope
Scope
The purpose
The purpose of of this
this study
study was
wastotoidentify
identifythe
thereal
realestate
estateprice
pricedifference resulting
difference from
resulting thethe
from green
green
certified (i.e., apartments obtained the G-SEED certification) and non-certified apartments
certified (i.e., apartments obtained the G-SEED certification) and non-certified apartments in Yeongnamin Yeongnam
area in
area in South
South Korea.
Korea.Figure
Figure11illustrates
illustratesthe
theresearch
researchflow
flowininthis
thisstudy.
study.
Figure
Figure 1.1.Research
Researchflow
flowofofthis
thisstudy.
study.
First, the major factors affecting apartment real estate prices were identified through extensive
review of previous research and the apartment pricing index was established using an indexing process.
Second, the study sampling was conducted, and one sample consisted of one green certified apartment
and three non-certified apartments located within a 1 km radius from the certified apartment. In total,
26 samples were selected in the Yeongnam area. Third, using the Geographic Information System
(GIS) and building pricing system of the Korean Ministry of Land, Infrastructure, and Transport,
necessary information data were collected. Fourth, the price index was established to compare the realSustainability 2020, 12, 2206 3 of 10
estate price difference afterward, real estate prices for a total of 100 samples with G-SEED certified
apartments and non-certified apartments were compared. Finally, a one-sample t-test was performed
after confirming the normality of data.
2. Theoretical Approach
2.1. Factors Affecting Apartment Pricing
To search the factors affecting the real estate price of apartments in South Korea, this study
used the database of Research Information Sharing Service (RISS) [3]. Based on the literature, it is
clear that building floor area and access to public transportation were the most frequently analyzed
factors in apartment pricing related studies followed by the year of construction, floor level, and
distance to school facilities. Table 1 summarizes the apartment real estate pricing factors considered in
previous studies.
Table 1. Major apartment pricing factors in previous studies.
Envir. Floor Year of Floor Dist. to Dist. to
Brand
Charcs. Area Const. Level Public Trans. School
Kang and
• •
Yuh [1]
Jang, Lee
• • • •
and Kim [4]
Park and
• • •
Rhim [5]
Kim and
• • • • •
Park [6]
Kim and
• • •
Park [7]
Kang and
• • • • • •
Jung [8]
Park, Jyoung and Rho [9] • • • • •
Jeong and Choi [10] • • • • •
Woo and Hong [11] • •
Jung [12] • • • • •
Kang and Yuh (2014) used a regression analysis to identify the impact of green building certification
on the building value in the real estate market. Their study concluded that the price of a G-SEED
certified apartment is increased by approximately 23% in the capital area [1]. In addition, through a
hedonic regression, Jang, Lee, and Kim (2009) drew the conclusion that apartment real estate prices
were closely related to the year of construction, floor level, distance to public transportation, and floor
area [4]. On the other hand, Kim and Park (2014) reported that among various qualitative aspects
of an apartment, the year of construction, floor area, and floor level had a positive relationship with
apartment real estate prices, whereas other factors, such as the distance to school facilities, public
transportation, and medical facilities, did not have significant impacts [6].
Studies of apartment pricing in different regions of Seoul reported that factors influencing real
estate apartment prices and their level of impact differed according to the characteristics of the
region under consideration [10,12]. For instance, in the Gangnam area, apartment prices were greatly
influenced by remodeling status and education facilities, while in the Gangbuk area, the year of
construction, floor area, floor level, and distance to the nearest subway station played a critical role
in apartment pricing. Kang and Jung (2001), through a hedonic pricing model, conducted a study
on the correlation between the apartment real estate price and major pricing factors in 31 apartmentSustainability 2020, 12, 2206 4 of 10
complexes located in different regions of Seoul. The study concluded that regional characteristics had
the greatest impact on the apartment real estate market [8]. Furthermore, to identify the importance of
building environmental factors, Choi and Song (2013) analyzed the relationship between the apartment
selling price per unit area and 22 building characteristics and residential environmental factors such
as distance to transportation, number of schools, distance to park, floor area ratio, facing south ratio,
parking capacity, green area ratio, etc. [13].
Son, Lee, and Kim (2014) conducted an economic analysis of G-SEED in the capital area using
house value index. The study concluded that the property value of a G-SEED certified building
was higher than a non-certified building. Furthermore, the study suggested that the proximity of
transportation is one of main factors to positively affect property’s value [14]. In addition, Kim, Son,
and Son (2020) reported that the economic value of LEED certified educational building was higher
than non-certified building. In detail, the maintenance costs for certified educational building were
reduced by 25.6% compared to non-certified educational building [15]
2.2. Green Standard for Energy and Environmental Design (G-SEED)
G-SEED evaluates and grades buildings based on their performance with the aim of reducing
building related environmental loads such as excessive energy consumption, greenhouse gases,
and other pollutant emissions that can occur throughout the entire life cycle of a building. The evaluation
criteria are classified into the following seven categories: land use and transportation, energy and
pollution, materials and resources, water, management, ecology, and indoor environment quality.
A building is graded as Best, Excellent, Good, or Fair based on the total score obtained from the seven
assessed categories [1]. Currently, the G-SEED scope covers all new buildings as well as existing
residential and commercial buildings within three years of their completion approval. In addition, in
South Korea, incentives such as the reduction of local tax and environment improvement charge, floor
ratio mitigation, etc. are given to G-SEED certified buildings [16]. These incentives can contribute to
the reduction of building construction and maintenance cost. In other words, G-SEED certification
system can have great impact on the value of property.
G-SEED certification has similar composition and rating system with other green building
systems such as LEED(Leadership in Energy and Environmental Design), BREEAM(Building Research
Establishment Environmental Assessment Methodology), and CASBEE(Comprehensive Assessment
System for Built Environment Efficiency).. However, there are some differences between these systems
regarding rating scores, categories, issues and criteria due to the differences in social awareness of
green building in each country. G-SEED has different evaluation approaches in their categories [17].
G-SEED is managed by the Korean Ministry of Land, Infrastructure, and Transport together with
the Ministry of Environment and operated by other operating and certification bodies. The Korea
Institution of Civil Engineering and Building Technology (KICT) is in charge of the G-SEED status and
operation of the certification management system, while the certification body in charge of buildings
documents, site evaluation, criteria evaluation, and building certification consists of five public and
five private institutions. These institutions are the Korea Land and Housing Corporation, the Korea
Institute of Energy Research, the Korean Infrastructure Safety Corporation, the Korea Appraisal Board,
the Korea Environmental Industry Technology Institute, the Korea Institute of Sustainable Design and
Educational Environment, CrebizQM Corporation, the Korea Productivity Center Quality Assurance,
the Korea Green Building Council, and the Korea Research Institute of Eco-Environmental Architecture.
2.3. Average Apartment Pricing Index
In this study, through an indexing process, the average apartment real estate prices were compared
in order to identify the relative value of G-SEED certified apartments in comparison to non-certified
apartments. Accordingly, the price index between the two apartment groups was established as shown
in Equation (1).Sustainability 2020, 12, 2206 5 of 10
The established index was used to compare the relative value of an apartment regardless of
its location. A CVI(Certified apartment Value Index) greater than 1 indicates that the absolute
apartment value is higher than the average apartment value. In this sense, CVI value was used to
show relative scale. Pj
C /j
j=1 ij
CVIij = Pk (1)
k=1 Nik /k
i = Apartment ID
j = G-SEED certified apartment ID
k = Non-certified apartment ID
Cij = Average G-SEED certified apartment price
Nik = Average non-certified apartment price
Sustainability 2020, 12, 2206 6 of 11
CVI = Average (Cij ) / Average (Nik )
In this equation, Cij and Nik are the average real estate prices of G-SEED certified and non-certified
apartments, respectively, while CVI is the relative real estate value of G-SEED certified apartment.
3. Data Collection
3. Data Collection
3.1. Selection of Target
3.1. Selection of Target
According to G-SEED certification status by KEIT, from 2002 to early 2019, the total numbers of
According to G-SEED certification status by KEIT, from 2002 to early 2019, the total numbers
apartments, and schools and commercial facilities that obtained G-SEED certification were 11,730
of apartments, and schools and commercial facilities that obtained G-SEED certification were 11,730
throughout the country, among which 4,406 and 7,324 were obtained in design and completion phases,
throughout the country, among which 4406 and 7324 were obtained in design and completion phases,
respectively. Of all of the G-SEED certified buildings, 1,226 were apartments with the majority of them in
respectively. Of all of the G-SEED certified buildings, 1226 were apartments with the majority of them in
the capital city of Seoul, where only 129 of the certified apartments were located in the Yeongnam area.
the According
capital city toof Seoul,
Kim andwhere
Kimonly 129 ofathe
(2013), certified
real estate apartments
apartment were pricelocated in theinfluenced
is greatly Yeongnamby area.
the
According
characteristics to Kim and
of dwellings andKim (2013), complexes
apartment a real estate apartment
within priceThus,
the region. is greatly influenced
it is necessary to by the
address
characteristics
these factors in theof price
dwellings
modeland apartment
analysis. complexes
The sensitivity withinofthe
analysis region.
region Thus,
related it is on
factors necessary to
the housing
address
market these factors
indicated in characteristics
that the the price model of analysis. The sensitivity
existing dwellings analysis ofwithin
and apartments regiona related factors
1 km radius on
highly
the housing market indicated that
affect the apartment real estate price [18]. the characteristics of existing dwellings and apartments within a
1 km radius highly affect the apartment real estate price [18].
In the case where two or more G-SEED certified apartment complexes were located very closely to
In theonly
each other, caseone
where two orwith
complex more
moreG-SEED certified
similarity apartment complexes
to non-certified apartmentswere located
within a 1 kmvery closely
radius was
to each other, only one complex with more similarity to non-certified apartments within
selected. In addition, a certified apartment was excluded if there were not three non-certified apartments a 1 km radius
was selected.
within In addition,
a 1 km radius a certified
for price apartment
comparison. was excluded
Accordingly, a total ofif26there wereapartments
certified not three non-certified
were selected
apartments
among withincertified
129 G-SEED a 1 km radius for price
apartments comparison.
located Accordingly,
in the Yeongnam a total of
area (Figure 2).26 certified apartments
were selected among 129 G-SEED certified apartments located in the Yeongnam area (Figure 2).
Figure
Figure 2. 2.
TheThe2626selected
selectedGreen
GreenStandard
Standard for
for Energy
Energy and
and Environmental
EnvironmentalDesign
Design(G-SEED)
(G-SEED)certified
certified
apartments in the Yeongnam area. apartments in the Yeongnam area.
3.2. Collection of Information Data
Due to the wide range of internal and external variables such as housing and regional characteristics,
it would be inappropriate to carry out a comparative analysis on apartments located in different regions.
In this study, as shown in Figure 3, for each one of the 26 G-SEED certified apartments selected, three non-
certified apartments within a 1 km radius were selected using the Geographic Information System (GIS).Sustainability 2020, 12, 2206 6 of 10
3.2. Collection of Information Data
Due to the wide range of internal and external variables such as housing and regional characteristics,
it would be inappropriate to carry out a comparative analysis on apartments located in different
regions. In this study, as shown in Figure 3, for each one of the 26 G-SEED certified apartments selected,
Sustainability 2020, 12, 2206 7 of 11
three non-certified apartments within a 1 km radius were selected using the Geographic Information
System (GIS).
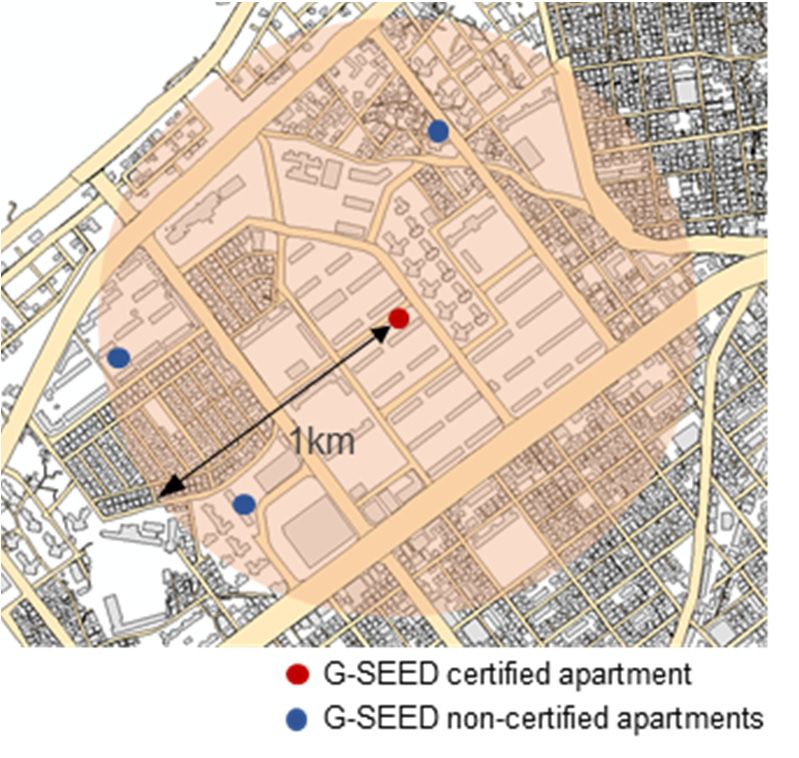
Figure Regional
3. 3.
Figure Regionalboundary
boundaryofofthe
the11km
kmradius
radiusfrom
fromaaG-SEED
G-SEED certified
certified apartment.
apartment.
Toprevent
To preventthetheapartment
apartmentreal realestate
estateprices
prices from
from being
being determined
determined by by other
other variables
variables except
except for
for green
green building certification, G-SEED, the major factors influencing apartment real estate
building certification, G-SEED, the major factors influencing apartment real estate prices in South Korea prices in South
Koreaselected
were were selected
based onbased
theon the factors
factors suggested
suggested in thisinstudy,
this study, as listed
as listed in Table
in Table 1. The
1. The apartment
apartment price
price influencing variables considered in this study were the year of construction,
influencing variables considered in this study were the year of construction, floor area, distance floor area, distance
to school
to schooland
facilities, facilities, and All
floor level. floor
of level. All of the
the apartment apartment
pricing factorspricing factors were
were controlled controlled
by keeping by keeping
similar factors for
similar factors for all of the apartments in the same sample. For brevity purpose, only
all of the apartments in the same sample. For brevity purpose, only one sample is illustrated in Table 2. one sample is
illustrated in Table 2.
Table 2. Example of one data sample.
Table 2. Example of one data sample.
Floor Dist. to Dist. to
Year of Floor Real Estate
Real EstatePrice
Price of Dist. to
Year of Area
Floor Area School
Dist. to Floor G-SEED
Construction Level Apartments (USD, $)
of Apartments G-SEED
Construction (m22))
(m School (m)
(m) Level Apartment
(USD, $) Apartment (m) (m)
G-SEED
G-SEED 2008 84.94 250 250 8 8 252,785
certified 2008 84.94 252,785 0 0
certified
Non-
Non-certified 2009 84.97
2009 84.97 10 10 8 8 244,215
244,215 100100
certified
G-SEED
G-SEED 2009 84.84 20 9 225,364 400
certified 2009 84.84 20 9 225,364 400
certified
Non-certified 2009 84.97 120 12 235,647 500
Non-
2009 84.97 120 12 235,647 500
certified
As previously mentioned, the distance related variables were measured through GIS while the
building related variables,
As previously mentioned,suchtheas distance
year of construction, andwere
related variables floor measured
area, werethrough
collected using
GIS whilethethe
National Spatial Data Infrastructure Portal Site [19]. The prices used in this study were
building related variables, such as year of construction, and floor area, were collected using the National the 2019 real
estate apartment
Spatial prices collected
Data Infrastructure Portal Siteusing
[19].the
Thereal transaction
prices system
used in this studyby thethe
were Korean Ministry
2019 real estateof Land,
apartment
Infrastructure,
prices collected and
usingTransport
the real [20]. All of the
transaction previously
system by the mentioned detailsof
Korean Ministry were collected
Land, for a total
Infrastructure, and
of 26 G-SEED
Transport [20].certified apartments
All of the previouslyand 74 non-certified
mentioned apartments.
details were collectedAfterward,
for a total the relative
of 26 G-SEED value of
certified
certified apartments
apartments was calculated
and 74 non-certified (using Equation
apartments. (1)) the
Afterward, andrelative
used invalue
the apartment real
of certified estate price
apartments was
comparative
calculated analysis.
(using Table1)3and
Equation showsusedtheinresults of the relative
the apartment valueprice
real estate calculation.
comparative analysis. Table 3
shows the results of the relative value calculation.Sustainability 2020, 12, 2206 7 of 10
Table 3. Data analysis.
Sample No. of Apartments Avg. Price CVI Sample No. of Apartments Avg. Price CVI
G-SEED 1 377,035 G-SEED 1 338,475
1 1.104 14 1.232
Non G-SEED 3 341,611 Non G-SEED 3 274,781
G-SEED 1 257,069 G-SEED 1 402,742
2 1.079 15 1.061
Non G-SEED 2 238,218 Non G-SEED 3 379,606
G-SEED 1 215,938 G-SEED 1 273,350
3 1.072 16 1.243
Non G-SEED 3 201,371 Non G-SEED 3 219,940
G-SEED 1 407,027 G-SEED 1 299,914
4 1.127 17 1.381
Non G-SEED 3 361,037 Non G-SEED 3 217,224
G-SEED 1 252,785 G-SEED 1 281,063
5 0.993 18 1.106
Non G-SEED 3 254,499 Non G-SEED 2 254,070
G-SEED 1 211,654 G-SEED 1 214,225
6 1.118 19 1.048
Non G-SEED 3 189,374 Non G-SEED 3 204,439
G-SEED 1 226,221 G-SEED 1 215,081
7 1.122 20 1.073
Non G-SEED 3 201,654 Non G-SEED 3 200,514
G-SEED 1 230,077 G-SEED 1 317,052
8 1.044 21 1.183
Non G-SEED 2 220,437 Non G-SEED 3 267,926
G-SEED 1 257,069 G-SEED 1 165,381
9 1.216 22 1.032
Non G-SEED 3 211,362 Non G-SEED 3 160,240
G-SEED 1 252,785 G-SEED 1 214,225
10 1.089 23 1.25
Non G-SEED 3 232,219 Non G-SEED 3 171,380
G-SEED 1 203,942 G-SEED 1 274,207
11 1.023 24 0.952
Non G-SEED 3 199,366 Non G-SEED 3 287,918
G-SEED 1 291,345 G-SEED 1 291,345
12 1.015 25 1.071
Non G-SEED 3 287,061 Non G-SEED 3 271,928
G-SEED 1 190,231 G-SEED 1 239,931
13 0.893 26 0.949
Non G-SEED 2 212,939 Non G-SEED 3 252,785
4. Statistical Analysis
4.1. Normality Test
In this study, a one-sample t-test was first performed to confirm whether the apartment pricing
difference between the two groups is statistically significant for comparative analysis. In statistics,
a t-test is performed on the premise that the population is normally distributed with an assumption
that the sample size is greater than 30 or the sample mean follows a normal distribution. Therefore,
given that this study’s sample size was less than 30, a normality test was first carried out before the
one-sample t-test. The results, as shown in Figure 4, indicate that the sample was normally distributed.
Furthermore, to more accurately confirm the normal distribution curve of the population
probability distribution, the Shapiro–Wilk test was conducted. Generally, the normality test can
produce a significant probability using the Kolmogorov–Smirnov test if the number of samples is
greater than 2000 and the Shapiro–Wilk test if the number of samples is less than 2000 [21]. In this
study, as the number of samples was less than 2000, the Shapiro–Wilk test was used and the obtained
W value was 0.405, which is greater than 0.05, indicating that the samples were normally distributed.
The normality test results are summarized in Table 4.Sustainability 2020, 12, 2206 9 of 11
Sustainability 2020, 12, 2206 8 of 10
(a) (b)
Figure
Figure4.
4.Normality
Normalitytest
testresults:
results:(a)
(a)CVI(Certified
CVI(Certifiedapartment
apartmentValue
Value Index) histogram and (b)
(b) Q-Q
Q-Q graph.
graph.
Furthermore, to more accurately confirm the
Table 4. Normality normal
results of thedistribution
Shapiro–Wilk curve
test. of the population probability
distribution, the Shapiro–Wilk test was conducted. Generally, the normality test can produce a significant
Kolmogorov-Smirnov
probability using the Kolmogorov–Smirnov test if the number of Shapiro-Wilk
samples is greater than 2000 and the
Shapiro–Wilk test if the number ofStatistic
samples is DF
less than
Sig.2000Statistic
[21]. In thisDF
study,Sig.as the number of samples
was less than 2000, the Shapiro–Wilk
G-SEED
test
0.153
was used
26
and
0.121
the obtained
0.961
W value
26
was
0.405
0.405, which is greater
than 0.05, indicating that the samples were normally distributed. The normality test results are summarized
in Table 4.
4.2. T-test analysis
Generally, a one-sample Table 4. Normality
t-test is used toresults of the the
compare Shapiro–Wilk
mean of test.
sample data to a hypothetical
mean with the purpose of determining whether
Kolmogorov-Smirnov the sample mean is statistically different from the
Shapiro-Wilk
population. In this study, the average real estate prices of three non-certified apartments and one
Statistic DF Sig. Statistic DF Sig.
G-SEED certified apartment were investigated. Therefore, a one-sample t-test was carried out with
G-SEED 0.153 26 0.121 0.961 26 0.405
the null hypothesis that there is no difference of the apartment price between G-SEED certified and
non-certified
4.2. apartments.
T-test analysis
After confirming the population normality through the Shapiro-Wilk test, a one-sample t-test was
Generally,
conducted andathe
one-sample
results aret-test
shownis used to compare
in Table 5. For athe mean of interval
confidence sample data to athe
of 95%, hypothetical
Pr (1.051≤ mean with
t ≤ 1.138)
the purpose of determining whether the sample mean is statistically different from the population.
was found with a test statistic T(X) of 4.526. The results indicate that the test statistic was located in the In this
study, the average real estate prices of three non-certified apartments and one G-SEED certified apartment
null hypothesis rejection region. Based on these results, the null hypothesis was rejected, and the study
were investigated. Therefore, a one-sample t-test was carried out with the null hypothesis that there is no
concluded that there is a difference between apartment real estate prices based on G-SEED certification.
difference of the apartment price between G-SEED certified and non-certified apartments.
The average CVI was 1.0952, and the real estate price for G-SEED certified apartments was 9.52% higher
After confirming the population normality through the Shapiro-Wilk test, a one-sample t-test was
than that of non-certified apartments.
conducted and the results are shown in Table 5. For a confidence interval of 95%, the Pr (1.051≤ t ≤ 1.138)
was found with a test statistic T(X) of 4.526. The5.results
Table indicate
One sample that the test statistic was located in the null
t-test.
hypothesis rejection region. Based on these results, the null hypothesis was rejected, and the study
concluded that there is a difference between apartment Test value = 1 prices based on G-SEED certification.
real estate
The average CVI was 1.0952, and the real estate price for G-SEED certified apartments
95% Confidence Interval was 9.52% higher
t DF Sig. Avg.
than that of non-certified apartments. Min. Max.
G-SEED 4.526 25 0.000 1.095 1.051 1.138
5. Conclusions
The G-SEED is used for evaluating sustainability of a building over its life cycle. Many studies
have been conducted to analyze the environmental and social effectiveness of G-SEED. However,
quantitative analysis of G-SEED economic aspects is still lacking; thus, the purpose of this study was to
assess G-SEED’s effectiveness in terms of economic benefits. For this purpose, a comparative analysis of
real estate prices between G-SEED certified and non-certified apartments was conducted in this study.Sustainability 2020, 12, 2206 9 of 10
Prior to the comparative analysis, a normality test was conducted to ensure that the probability
distribution of the population followed a normal distribution curve. After confirming the normal
distribution, a one-sample t-test was carried out to determine the difference between real estate prices
of apartments with and without G-SEED. The one-sample t-test results showed that the difference
between the two groups were statistically significant with a probability value of 0.000. The real estate
prices of G-SEED certified apartments were 9.52% higher than non-certified apartments.
According to the analysis, it was concluded that the real estate prices of G-SEED certified
apartments were higher than non-certified apartment. This was caused by the fact that G-SEED
certified apartment had energy-saving system, low maintenance costs and various incentives. In this
respect, the value of G-SEED certified apartment was higher than non-certified apartment. In addition,
it was indicated that this tendency was more apparent in Seoul than in Yeongnam area. This might
be caused by other variable such as proximity to downtown because there are many transportation
systems such as subway, lightrail, and bus rapid transit in capital area.
To obtain a green building certificate, considerable improvement is required in all seven G-SEED
assessment categories, which involves great investment and inevitably affects the entire building
life cycle both from time and cost perspectives. Based on the findings of this study, the investment
made to acquire G-SEED is deemed to be worthy because it can lead to a positive effect on real estate
apartment prices.
The main objective of this study was to assess whether there is an economic value difference
between G-SEED certified and non-certified apartment. To minimize the impact of the physical
characteristics of other variables such as year of construction, floor area, distance to school, etc.,
non-certified apartments having similar characteristics were selected within 1 km of the certified
apartment. However, it is worth mentioning that the controlled variables should be considered in
future studies for further investigations.
Author Contributions: All authors contributed equally to the text. All authors have read and agreed to the
published version of the manuscript.
Funding: This work was supported by the 2019 Research Fund of University of Ulsan.
Conflicts of Interest: The authors declare no conflict of interest.
References
1. Kang, B.R.; Yuh, O.K. Analysis of the impact of G-SEED on real estate price focused on apartment house.
J. Korea Inst. Build. Constr. 2014, 48, 79–92.
2. Korea Environmental Industry Technology Institute. G-SEED Certification Status. Available online: https:
//www.gbc.re.kr (accessed on 20 October 2019).
3. Research Information Sharing Service (RISS). Available online: http://www.riss.kr/index.do (accessed on 11
August 2019).
4. Jang, S.W.; Lee, S.H.; Kim, J.J. Impact of cognition factors on an apartment housing price. J. Archit. Inst. Korea
Plan. Des. 2009, 25, 207–214.
5. Park, W.S.; Rhim, B.J. A study on the factors affection apartment price by using hedonic price model. J. Korea
Real Estate Assoc. 2010, 28, 245–271.
6. Kim, M.S.; Park, S.W. A study on determinants of apartment price using spatial regression model. In
Proceedings of the 2014 Korean Industrial Economic Association, Seoul, Korea, 29–31 May 2014; pp. 113–132.
7. Kim, H.H.; Park, S.W. Determinants of house prices in Seoul: Quantile regression approach. J. Korean Assoc.
Hous. Policy Stud. 2013, 21, 141–168. [CrossRef]
8. Kang, C.K.; Jung, C.M. A static dynamic study on the economic value change of housing price determinants.
J. Korea Plan. Assoc. 2001, 36, 217–257.
9. Park, H.S.; Jyoung, S.Y.; Rho, T.U. An spatial econometric analysis of apartment sale prices and spatial effects.
J. Korea Plan. Assoc. 2003, 38, 115–125.Sustainability 2020, 12, 2206 10 of 10
10. Jeong, Y.J.; Choi, M.J. Differences of housing price determinants among regional sub-markets in Seoul.
In Proceedings of the 2002 Korean Association for Housing Policy Studies, Seoul, Korea, 7–9 February 2002;
pp. 180–204.
11. Woo, K.; Hong, K.Y. A study on the hedonic analysis of Seoul metropolitan housing market. J. Korean Reg.
Dev. Assoc. 2002, 14, 1–22.
12. Jung, S.Y. Impact of educational variable on apartment price in Seoul. J. Korea Plan. Assoc. 2006, 41, 153–166.
13. Choi, Y.A.; Song, B.H. A study on evaluating the importance of the residential environment factors influencing
the price of apartment house. J. Archit. Inst. Korea Plan. Des. 2006, 22, 115–124.
14. Son, K.Y.; Lee, S.H.; Lim, C.Y.; Kim, S.K. Economic analysis of Korea green building certification system in
the capital area using house-values index. J. Asian Archit. Build. Eng. 2014, 13, 475–481. [CrossRef]
15. Kim, J.M.; Son, K.Y.; Son, S.H. Green benefits on educational buildings according to the LEED certification.
Int. J. Strateg. Prop. Manag. 2020, 24, 83–89. [CrossRef]
16. Shin, S.J. A Feasibility Analysis of Incentive for the Green Building Certification Criteria (GBCC) of Apartment
Building. Master’s Thesis, University of Dong-A, Busan, Korea, 2013.
17. Wang, S.J.; Tae, S.H.; Kim, R.H. Development of a green building materials integrated platform based on
materials and resources in G-SEED in South Korea. Sustainability 2019, 11, 6532. [CrossRef]
18. Kim, S.Y.; Kim, Y.H. A study on the house price determinants model considering spatial attributes of
residential environment: The case of apartment in Seoul. J. Korean Cartogr. Assoc. 2013, 13, 41–56.
19. Land and Geospatial Informatrix Corporation. National Spatial Data Infrastructure Portal, Integrated Real Estate
Information; Land and Geospatial Informatrix Corporation: Jeollabuk-do, Korea, 2019; Available online:
http://www.nsdi.go.kr/lxportal/?menuno=4074 (accessed on 3 August 2019).
20. Korea Institute of Civil Engineering and Building Technology. Ministry of Land, Infrastructure and Transport,
Ministry of Land, Infrastructure and Transport’s Real Transaction System; Korea Institute of Civil Engineering
and Building Technology: Gyeonggi-do, Korea, 2019; Available online: http://rt.molit.go.kr/ (accessed on 11
August 2019).
21. Royston, P. Approximating the Shapiro-Wilk W-Test for non-normality. J. Stat. Comput. 1992, 2, 117–119.
[CrossRef]
© 2020 by the authors. Licensee MDPI, Basel, Switzerland. This article is an open access
article distributed under the terms and conditions of the Creative Commons Attribution
(CC BY) license (http://creativecommons.org/licenses/by/4.0/).You can also read