A study on the state of cross-border e-commerce in Latin America - Focus on Brazil, Chile, Colombia and Mexico

Page created by Jesus Kennedy
 
CONTINUE READING
A study on the state of cross-border e-commerce in Latin America - Focus on Brazil, Chile, Colombia and Mexico
A study on the state of
cross-border e-commerce
         in Latin America
          Focus on Brazil, Chile,
          Colombia and Mexico

            POWERED BY
A study on the state of cross-border e-commerce in Latin America - Focus on Brazil, Chile, Colombia and Mexico
INTRODUCTION
INTRODUCTION

We present
you a new
Latin America
         Home to more than 600 million                  We are talking about the increasing
         people, Latin America must be read          e-commerce penetration among
         through a particular lens from now          Latin American consumers, sustained
         on: before and after the COVID-19           by the access to smartphones
         pandemic. In this Beyond Borders            and the internet, as well as the
         2020/2021 study, we will briefly            undergoing fintech revolution in
         show you the main impacts of this           the region and its consequential
         unprecedented health and economic           greater usage of digital payments
         crisis in the region, but also the bright   and banking services in general.
         side of it (yes, there is one).                In the end, COVID-19 has been
            You will see that, despite the           decisive for paving the way to
         political uncertainties and the             the rise of a new, more digitally
         economic setbacks brought by the            inclusive Latin America – which
         COVID-19 pandemic, trends that              is also key to the growth of digital
         were already in place before the            commerce in the region as a whole
         coronavirus were pushed further.            in the coming years.

                                                                                                2
A study on the state of cross-border e-commerce in Latin America - Focus on Brazil, Chile, Colombia and Mexico
INTRODUCTION
In the end, COVID-19           Beyond Borders 2020/2021             To better understand the changes
has been decisive for       was made especially for              that the region has undergone,
                            global companies that                especially in the recent months, we
paving the way to the
                            know little about the Latin          looked into renowned public sources
rise of a new, more         American market and the              (from the World Bank to GSMA
digitally inclusive Latin   transformations that the region      open reports), talked to several key
America – which is          has recently experienced.            industry experts, and counted on
also key to the growth      Curated by EBANX experts, this       figures and forecasts provided by
                            study provides a contextualized      Americas Market Intelligence (AMI),
of digital commerce in
                            portrait of the behavioral           a leading consultancy and research
the region as a whole in    trends that shape the region’s       firm specialized in Latin America.
the coming years.           payments and e-commerce                 According to AMI, the
                            market.                              e-commerce industry “will look
                                                                 wildly different than it did in
                     An intelligence effort                      2019 or ever before”. Although
                     in five acts                                an important part of AMI’s data,
                     In order to paint the big picture of what   travel was the segment most hit
                     to expect from Latin America after          by the COVID-19 pandemic, and
                     COVID-19, our mission in the first part     its behavior throughout 2020 was
                     of this Beyond Borders 2020/2021 study      nothing like the previous years.
                     was to seek the most reliable external      Therefore, we decided to concentrate
                     data about the region’s potential for       the efforts of the second part of the
                     digital commerce, with a special focus      Beyond Borders 2020/2021 study,
                     on the two largest Latin American           based on EBANX’s internal data and
                     economies – Brazil and Mexico –, as         on an exclusive survey with Latin
                     well as the fastest-growing economy         American consumers, on retail and
                     in the region, Colombia, and the most       digital goods verticals.
                     digitally evolved country, Chile.

                                                                                                           3
A study on the state of cross-border e-commerce in Latin America - Focus on Brazil, Chile, Colombia and Mexico
EBANX

                                                                                       INTRODUCTION
EBANX is a global fintech company that      They talked to us about the main
bridges the access gap between Latin        drivers and barriers in their
Americans and international companies       consumption journey, especially
such as AliExpress, Wish, SHEIN, Uber,      when it comes to localization and
Spotify and Sony PlayStation. EBANX         digital goods and services.
is heading to close 2020 with 1 billion        Finally, we bring together some
transactions processed. It’s through this   of the main trends that are not only
highly valuable internal data that we       reshaping the region’s market today,
bring you unprecedented insights about      but that will continue to do so in
the usage and the relevance of cash-        2021. From the potential of PIX,
based and alternative payment methods       Brazil’s instant payment system,
(meaning all the methods except cards)      to the challenges and solutions
and the influence of the exchange rate      being implemented to improve
on purchases made by Latin Americans.       e-commerce logistics in the country.
   To further explore all this              From regulatory changes in the
background, we also carried out an          Chilean acquiring market to the
exclusive survey with 3,280 Latin           rapidly growing fintech ecosystem
American cross-border consumers,            in Colombia.
mainly from Brazil, Mexico,                    As a final result, in the next pages,
Colombia, and Chile that bought             you will find the most comprehensive
international products and services         study about Latin America’s potential
in the last 12 months.                      for digital commerce.
                                               If you have any questions, do not
                                            hesitate in contacting EBANX Market
                                            Intelligence Team through the email
                                            market.intelligence@ebanx.com.

                                                                                         4
A study on the state of cross-border e-commerce in Latin America - Focus on Brazil, Chile, Colombia and Mexico
On the

                                                                                                                           INTRODUCTION
                                          Retail                                     Digital goods
same page                                 Retail is generally related to             and services
                                          physical goods, from department            This is generally related to
To be sure that we are on the             to grocery stores and marketplaces.        products and services such
same page, let us present you             But when it comes to EBANX                 as app downloads and in-app
a small glossary of the main              internal data we are talking               purchases, online gaming,
e-commerce (which we also                 mainly about furniture, home               digital downloads, music and
refer to as digital commerce              appliances, home decor,                    video streaming, ride-hailing
                                          clothes, cosmetics, fashion                services, food delivery, software
in the text) segments that
                                          accessories, and electronics,              downloads, open and online
we will explore in this year’s            usually sold in big marketplaces           courses provided by educational
Beyond Borders study:                     mainly by Asian sellers.                   institutions, and subscriptions
                                                                                     and recurring payments. But
                                                                                     when it comes to EBANX data,
                                                                                     we are talking mainly about
                                          Travel                                     streaming and gaming segments,
                                          All services related to travel including   services that require recurring
                                          airline and bus tickets, hotels and        payments most of the time.
                                          accommodations, packages sold
                                          by travel or tour agencies, etc.

About
                     Traditionally, AMI’s research is conducted        document. At the beginning of 2020, AMI
                     using two research methodologies: 1)              began updating its e-commerce dataset to

AMI’s
                     desk research, accessing both local and           reflect full-year 2019 using the methodology
                     international public sources; and 2) interviews   described here. Halfway through March, due

data                 with key industry executives. Public sources
                     include reports conducted by local industry
                                                                       to the coronavirus outbreak, this methodology
                                                                       changed a little bit. AMI scrapped all of the
                     chambers, associations, and research firms, as    forecasting work completed up until that
                     well as reports made public by international      point and came up with a new model to
                     organizations like eMarketer and Nielsen.         predict what would happen in 2020 and
                     The bulk of the data, however, comes from         2021. The consultancy’s new models forecast
                     interviews with top e-commerce industry           e-commerce growth by industry and cross-
                     executives, including payment processors          border/domestic spend on a month-by-month
                     and acquirers, card issuers, online payment       basis through 2020 and for some industry
                     gateways and payment service providers, and       segments, through 2021. To create the
                     top merchants in all product verticals. Once      forecasts contained in this report, AMI’s experts
                     data is collected from primary and secondary      made certain assumptions about future
                     sources, AMI compared, cross-referenced,          consumer behavior and consumption trends,
                     and triangulated all collected data points to     based on what they knew about COVID-19 in
                     arrive at the final dataset contained in this     the latter half of March and early April 2020.

                                                                                                                             5
A study on the state of cross-border e-commerce in Latin America - Focus on Brazil, Chile, Colombia and Mexico
INTRODUCTION
                                                               Index
1.                                   2.                                  3.
Why Latin America,                   Latin America’s                     The payments
and why now?                         potential for                       landscape
07   Latin America’s market          e-commerce                          34 How Latin Americans pay:
     potential versus the region’s                                            an overview
     economic setbacks               19   COVID-19 has just
                                          emphasized this: Latin         40 Debit and prepaid cards
10   Governmental aid, fintechs           America is still the next           as an essential asset for
     and connectivity: the                big thing when it comes to          subscription businesses
     key factors to increase              e-commerce
     Latin America’s access to                                           41   Cash and alternative
     financial services and boost    22   An overview of the                  payments are still very
     consumption                          e-commerce market in Brazil,        relevant in Latin America,
                                          Mexico, Colombia, and Chile         especially in the retail
16   Smartphones and internet                                                 e-commerce vertical
     penetration driving             30 The main players in
     e-commerce in Latin America          Latin America                  43   The influence of exchange
                                                                              rates on international
18   Forced digitization and the                                              online purchases: insights
     newcomers to e-commerce in                                               on Brazil’s case
     Latin America

                                     4.                                  5.
                                     Consumer                            Seven trends for
                                     behavior in                         Latin America
                                     Latin America                       68   Take a deep dive into the
                                                                              region’s main digital trends
                                     47   Why and how Latin
                                          Americans consume online
                                     49   Brazil

                                     54 Mexico

                                     58   Colombia

                                     62   Chile

                                                                                                               6
A study on the state of cross-border e-commerce in Latin America - Focus on Brazil, Chile, Colombia and Mexico
01
                                                        W H Y L AT I N A M E R I C A , A N D W H Y N O W ?
CHAPTER 01

Why Latin
America,
and why      Latin America’s market

now?         potential versus the
             region’s economic
             setbacks
             As the whole world, Latin America
             must be read now through a particular
             lens: before and after the COVID-19
             pandemic (or before and during, since
             the disease will only be tamed with an
             effective and widely available vaccine).
                Back to the beginning of this year,
             2020 was supposed to be a year pulled
             by emerging countries, since, according
             to experts and institutions such as the
             International Monetary Fund (IMF),
             the United States was expected to grow
             less than 2%, China would probably
             slow down from 6.2% to 5.7%, and the
             global economy would grow by around
             3% – meaning that the world’s largest
             powerhouses would not be enough to
             truly move the needle. In this scenario,
             Brazil (2.2%) and Colombia (3.5%) were
             seen as the region’s (1.6%) main driving
             forces, its way out from a lost decade.
                But then the pandemic came.

                                                                  7
A study on the state of cross-border e-commerce in Latin America - Focus on Brazil, Chile, Colombia and Mexico
01
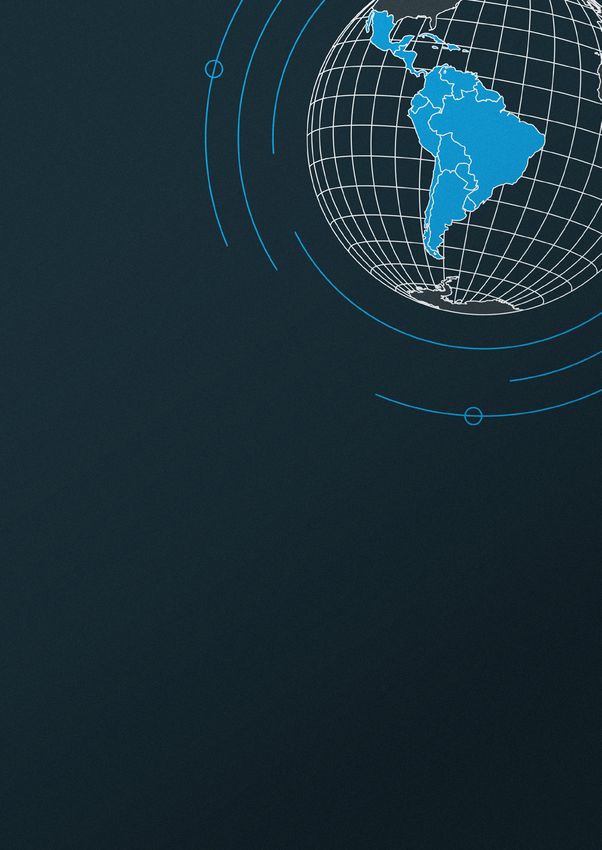
01 Cumulative confirmed COVID-19 cases in Latin America

                                                                                                                                                             W H Y L AT I N A M E R I C A , A N D W H Y N O W ?
The number of officially confirmed cases in the region’s five largest economies


                                                                                             Chile


                                                                                             Colombia
                                                                                             Argentina
                                                                                           Mexico
                                                                                             Brazil


                            In Latin America, the coronavirus                        In Chile, for example, a $2 billion
                         officially arrived on February 26th,                     package of subsidies was launched
                         with a 61-year-old man who traveled                      in April to help support the country’s
                         from Italy to São Paulo. As the only way                 informal workers and generate jobs
                         to prevent the spread of the disease,                    in low-income sectors, in addition
                         isolation measures began to be applied                   to a previous $12 billion stimulus
                         by local administrations in March.                       package, worth nearly 5% of the
                         Amid more restrictive measures in                        country’s gross domestic product.
                         some countries and a great deal of                       The country also allowed Chileans to
                         denialism in others, Latin America                       withdraw up to 10% of their retirement
                         became the epicenter of the disease in                   savings. In Argentina, a single transfer
                         May. The extent of the human tragedy                     of ARS 10,000 ($135) served the
                         is overwhelming: with only 8.2% of the                   unemployed and informal workers.
                         world population, the region accounted                   In Peru, the government provided
                         for nearly a fourth of the cases and over                a $224 grant to families in poverty
                         a third of the deaths, until end-October.                or extreme poverty in rural areas.
                            The scenario of reductions in GDP,                       In Brazil, as soon as social distancing
                         employment, and consumption, as                          was implemented by states and cities
                         well as warnings about an imminent                       as a measure to mitigate the economic
                         social collapse, prompted countries                      effects of isolation, a crucial measure to
                         such as Brazil, Argentina, Peru,                         save time for a better preparation of the
                         and Chile to announce emergency                          public health system, there was a need
                         measures to mitigate the economic                        to help vulnerable people. Informality
                         impacts of the COVID-19 pandemic                         in the labor market exceeds 40% of
                         – which also included minimal                            the country’s employed population,
                         income transfer programs.                                according to the Brazilian Institute
                                                                                  of Geography and Statistics (IBGE).

                                                                                        01 Source: WHO, Johns Hopkins Center and local health authorities.
                                                                                                                                                                     8
A study on the state of cross-border e-commerce in Latin America - Focus on Brazil, Chile, Colombia and Mexico
The emergency aid alongside other                                          data from the Economic Commission

                                                                                                                                                                                                           01
                                       measures taken by the Central Bank of                                         for Latin America and the Caribbean

                                                                                                                                                                                                           W H Y L AT I N A M E R I C A , A N D W H Y N O W ?
                                       Brazil to bring liquidity to the financial                                    (ECLAC), a United Nations body. If in
                                       system and amount to about 17% of                                             the beginning experts and organizations
                                       GDP were the upside of the country’s                                          struggled to identify and measure the
                                       response to the COVID-19 pandemic.                                            economic impacts of the disease in the
                                          The emergency aid in Brazil                                                region, two quarters later the damage
                                       consisted of a monthly benefit of                                             is far more clear. It turns out that
                                       BRL 600 to BRL 1,200 (in the case of                                          Brazil was the least affected country
                                       women responsible for the full support                                        in Latin America by the pandemic
                                       of their families) between May and                                            during the second quarter of 2020.
                                       September; and between October and                                                In October, the IMF disclosed its
                                       December, in a monthly aid of BRL 300.                                        latest World Economic Outlook report.
                                          Latin America effectively entered a                                        The global lender expects the world
                                       recession after the first quarter, with                                       gross domestic product to shrink 4.4%
                                       an overall 1.53% setback, according to                                        in 2020, an upward revision compared
                                                                                                                     to the 5.2% contraction it predicted
                                                                                                                     in June, when business closures
  02 COVID-19’s impact on GDP
                                                                                                                     were at their peak worldwide.
  Since the pandemic arrived in Latin America later than in other
  parts of the world, the region’s main markets felt the greater impact                                                  For Latin America, the forecast is
  of the disease in the second quarter. (GDP growth/in %)                                                            also a little more optimistic than that
                Brazil            Mexico    Argentina     Colombia       Chile           Peru                        of June: an 8.1% drop in the region’s
                                                                                                                    GDP and a rebound in 2021 of more
                                                                                                                  than 3% growth. Previously, the IMF
                -9.70%
      
                                                                                                                     had predicted that Latin America’s
                                                                        -13.20%
                                            -16.20%
                                                          -14.90%                                                    GDP would fall by 9.4% this year.
                              -17.10%
                                                                                                                         ECLAC, in its turn, says that the
                                                                                                                 region’s recovery will be slower than
                                                                                 -27.20%                         that recorded after the 2008 financial
                                                                                                                     crisis, and projects drops of -9.2%,
      
                                                                                                                     -9%, -10.5%, -5.60%, and -7.9% for the
                                                                                                                     economies of Brazil, Mexico, Argentina,
  03 GDP growth projections for LatAm                                                                                Colombia, and Chile, respectively.
  The IMF expects the world gross domestic product to                                                                    The IMF says that governments
  shrink 4.4% in 2020. (real GDP, annual percent change)                                                             needed to stay focused on their sanitary
                                                                        2019        2020          2021               responses to the coronavirus and
       World
       Output
                  Latin
                 America           Brazil   Mexico      Argentina   Colombia     Chile          Peru                 must not withdraw all their stimulus
                & the Caribbean
                                                                                                                   measures prematurely. This is crucial
                                                                                                                    for limiting the COVID-19’s damage.
                                                                                                                         Despite challenging economic
 
                                                                                                                     projections for the region, the
                                                                                                                   e-commerce and payments sectors,

                                                                                                                     just after the initial hit in March
                                                                                                                     and April, moved in the opposite

                                                                                                                     direction from the crisis.

                                                                                       02 Source: Official Statiscs Agencies. Note: Venezuela is the third economy in the region, acoording to the
                                                                                  World Bank, but due to its political instability and lack of reliable data, the country is not featured in this chart.            9
                                                                                                                                            03 Source: IMF, World Economic Outlook, October 2020.
A study on the state of cross-border e-commerce in Latin America - Focus on Brazil, Chile, Colombia and Mexico
01
                                                                                                 W H Y L AT I N A M E R I C A , A N D W H Y N O W ?
Governmental aid,
fintechs and connectivity:
the key factors to increase
Latin America’s access to
financial services and boost
consumption
            Amid this unprecedented crisis,           money provider. An “account” is
            however, the emergency measures           defined as one that can be used to (1)
            taken to mitigate the effects of          store money and (2) electronically
            COVID-19 were also the backdrop of        send and receive payments.
            a greater-than-expected digitization         Leora Klapper, a lead economist
            and financial inclusion of people in      in the World Bank’s Development
            the region.                               Economics Research Group, and the
               Among statistics such as the number    manager of the Global Findex database,
            of checking, deposits or savings          told EBANX that some countries
            accounts, or even people with some        already consider card-based accounts
            kind of “banking relationship”, it is     owners as banked people.
            difficult to identify the actual number      But, in general, the most traditional
            of people financially included in         concept of banked citizens considers
            Latin America, since this depends on      an account not just as a way to store
            a broader concept. But what is clear      or move money, but as a way to access
            is that the rise of those indicators      investments, credit and other financial
            normally lead to financial inclusion –    services, and frequently used.
            as we will show you in the next pages        According to the latest data by
            with the cases of Brazil and Colombia.    the Global Findex, published in 2018,
               The Global Findex research, the        about half (54.4%) of adults (people
            largest study about financial inclusion   over 15) in Latin America and the
            in the world made by the World Bank,      Caribbean have an account with
            defines as “financially included”         a financial institution or through
            someone who has an account through        a mobile money service. But this
            a formal financial institution—such as    scenario has probably changed
            a bank, credit union, or microfinance     a lot, as we will see in the recent
            institution—or through a mobile           experiences of Brazil and Colombia.

                                                                                                 10
Brazil

                                                                                                                                                                         01
                            A large survey made by the Instituto                                 From April, when the first installment of

                                                                                                                                                                         W H Y L AT I N A M E R I C A , A N D W H Y N O W ?
                            Locomotiva in 2019 has pointed                                    the Brazilian federal government’s emergen-
+67 million                 out that Brazil has about 45 million                              cy aid to mitigate the effects of the COVID-19
people                      people that don’t have a bank                                     pandemic was deposited for unemployed,
received more than          account, 21% of the country’s total                               self-employed professionals and individ-
BRL 238 billion in          population at that year. In 2018,                                 ual microentrepreneurs in the country, to
emergency aid by
end-October in Brazil       World Bank’s Global Findex found a                                date, more than 100 million digital savings
– which may have led        slightly larger number: 70% of the                                accounts have been opened by the state-
to a major process of       Brazilian adults over 15 had a bank                               owned bank Caixa Econômica Federal.
financial inclusion of
more than 30 million        account – meaning that around 48.5                                Among these more than 100 million ac-
people.                     million at that time didn’t.                                      counts, are the ones opened to the more
                                                                                              than 67 million people that received the gov-
                                                                                              ernment’s COVID-19 emergency aid.
                     “This is the biggest banking                                                In May, after the payment of the first
                                                                                              two installments, Caixa’s president, Pedro
                 process ever occurred at a global
                                                                                              Guimarães, and his team estimated that
                       level. Within the standard                                             from one third to 40% of the beneficiaries
                    concept, they are people who                                              of the emergency aid were people who had
                 have started to have an account                                              no bank account before that – that is, more
                                                                                              than 30 million people may have gained
                    and who (with the extension
                                                                                              access to their first account.
                     of the emergencial aid until                                                For comparison, between 2014 and
                 December) will have moved this                                               2017, the Global Findex research estimates
                 account in the last six months.”                                             that nearly 12 million adults opened
                                                                                              their first bank account specifically to
                                                   JOÃO BRAGANÇA
                                        Senior director for the financial
                                                                                              receive digital transfers of government
                                 industry at consultancy Roland Berger                        social subsidies, public sector wages, or
                                                                                              pension payments in the country.

                 04 Access to financial products in Brazil
                 From 2005 to 2020*, 87.76 million individuals gained
                 access to a financial product in Brazil. (in number of individuals)


                                                                                                                                               175M
                                                                                                                                         164M
                                                                                                                  153M      158M
                                                                                                      143M   146M
                                                                                   133M    138M
                                                                             127M
                                                          115M   121M
                                               104M    109M
                              92M    98M
                          87M


                          2005 2006 2007 2008 2009 2010 2011 2012 2013 2014 2015 2016 2017 2018 2019 2020*

                                                                                                             04 Source: Central Bank of Brazil. * Until end-September.   11
Another strong indication that more                    While Caixa Econômica Federal

                                                                                                                               01
              people were included in the Brazilian                  estimates that more than 30 million

                                                                                                                               W H Y L AT I N A M E R I C A , A N D W H Y N O W ?
              banking system this year than in                       people in Brazil may have gained
              other periods, is the increase in the                  access to their first account, as
              number of people with “active banking                  presented in the previous page of this
              relationships” (which refers to access                 study, according to the Central Bank
              to any type of product or service in                   of Brazil, from March to September
              financial institutions in the country,                 of 2020, 9.8 million Brazilians started
              not necessarily an account).                           some kind of relationship with a
                                                                     financial institution. This figure is
                                                                     more than the double of the 3.5 million
      “I believe that today, thinking                                people that entered the banking
    about the Brazilian scenario, we                                 system this way in the same period last
 have a format that is the payments                                  year, as pointed out by the Brazilian
        account. I would say that an                                 Central Bank data. It is also the biggest
        unbanked person is a person                                  annual growth registered since 2005,
    who doesn’t have an investment                                   when this historical series started to
      account or a deposits account.                                 be released by the entity. The numbers
       What we have to reflect on is:                                gathered by the Brazilian Central Bank
    “banking” means having only a                                    do not consider payment institutions,
 place to store and deposit money or                                 which already offer millions of basic
 should we look at it from a broader                                 payment accounts in the country
    perspective, like having access to                               today. Only Nubank, Inter and PicPay,
      other types of resources within                                all together, have more than 63 million
                                                                     customers in Brazil. Many of them
     a financial institution, such as
                                                                     may also have accounts at traditional
  investments, access to credit, etc?”
                                                                     institutions, many may not.
                               HELENA LOPES CALDEIRA
                          CFO at the Brazilian neobank Inter

+175 million                     +23 million                      +7 million                  +33 million
Brazillians or 83% of the        That is the number of            That is the number of       That is the number of
country’s total population       customers with digital           customers with digital      customers of PicPay, one of
have some kind of active         accounts at Nubank, the          accounts at Inter, one      the largest digital wallets in
relationship with a financial    largest neobank in Latin         of the largest fintech      Brazil – around 15.5% of the
institution, according to end-   America, according to official   companies in Brazil.        country’s total population.
September 2020 data from         numbers from their website,      It reached this number      The company has added 18
the country’s Central Bank       consulted in mid-December,       of customers by end-        million users only during the
– a much higher banking rate     2020 – around 11% of the         September – around 3% of    COVID-19 pandemic in Brazil,
than that of Latin America as    Brazilian population.            the Brazilian population.   and reached this number of
a whole.                                                                                      customers by end-September.

                                                                                                                               12
Colombia

                                                                                                                                                                             01
                                                                                                                                                                             W H Y L AT I N A M E R I C A , A N D W H Y N O W ?
                            In Colombia, the COVID-19 pandemic                                     between December 2019 and June
                            also helped to accelerate the popula-                                  2020. In this way, 25.8 million adults
+31 million                 tion’s financial inclusion, driven by                                  fulfilled this condition at the end
Colombians (or 85.9%        emergency aid programs. The latest                                     of the first semester of 2020 – the
of the country’s adult      financial inclusion report of Banca                                    growth of this indicator during the
population) have
access to a banking
                            de las Oportunidades, body linked                                      first semester of 2020 was 5.6 pp,
product or service,         to Colombia’s National Planning                                        while a year ago it was 0.8 pp.
according to first          Department, shows that, in the first half                                 According to Banca de las
half of 2020 data
from Banca de las
                            of this year, 31 million adults already                                Oportunidades, emergency aid and
Oportunidades.              had access to at least one deposit or                                  VAT compensation programs of
                            credit financial product in the country.                               the National Government played a
+3.2 million                   This figure represents an increase                                  fundamental role in the progress
That is the number of       of 1.6 million people who entered the                                  observed in the indicators of access
customers of Nequi,         financial system for the first time –                                  and use of financial products.
the Colombian digital
wallet owned by Ban-        an increase of 3.4 percentage points                                   Because of them, more than 730,000
colombia – 1 million        (pp) when considered the data from                                     Colombians activated their products
of them were added          December 2019 (29.4 million). A year                                   or opened one for the first time.
between the first and
the second quarters         ago this increase was only 0.6 pp. That                                   The digital inclusion promoted by
of 2020. The company        means that the financial inclusion                                     COVID-19 also leads us to think of a
already covers about        target of 85% of adults set for 2022                                   new concept that considers digital
6.5% of the country’s
total population.           was met much earlier than planned.                                     payment accounts, which normally
                               In terms of use of these products,                                  come with a debit card and a limited
A new kind of               an important metric when it comes to                                   number of operations, and are
banking, led                real financial inclusion, the number                                   provided by fintechs, as a possible
by fintechs?                of adults with an active financial                                     new and important step for financially
The increasing number       product in Colombia rose from 66%                                      included people in Latin America,
of fintechs that offer
digital accounts, along     to 71.6% of the total adult population                                 even among high informality rates.
with the rising of digi-
tal wallets, mean that a
big change is in course
in Latin America. In
                               05 Access to financial products in Colombia
order to consolidate           From 2008 to 2020*, 14 million adults gained access to a financial
this process, however,         product in Colombia. (in % of the adult population)
neobanks and fintechs          

will have to offer the         
                                                                                                                                                       85.9%
right range of services,
                                                                                                                                           82.5%
with solutions built                                                                                                      80.1%
                                                                                                                                    81.4%
to solve historical            
                                                                                                       76.3% 77.3%
issues in the region,          
                                                                                   71.5%
                                                                                             73.9%
like informality, if they
                                                                       67.2%
really want to keep all
                                                                64.9%
these people inside the        
                                                       62%
banking system.                           57.3%
                                     55.5%
                               
                                     2008 2009 2010 2011 2012 2013 2014 2015 2016 2017 2018 2019 2020*

                                             05 Source: Banca de las Oportunidades/Transunión/Departamento Administrativo Nacional de Estadística (Dane). *Until end-July.
                                                                                                                                                                             13
5G? No, the 4G revolution

                                                                                                                                                                                   01
                                                                                        “We expect that 4G will still be the

                                                                                                                                                                                   W H Y L AT I N A M E R I C A , A N D W H Y N O W ?
          Alongside the fintech revolution in Latin                                     dominant technology for many years,
          America, mobile phone ownership                                               coexisting with the growing number of
          and mobile internet access are key                                            5G connections. By 2025, the 4G share
          to increase the financial inclusion                                           will rise to 67% of the total connections
          in the region – and, therefore, the                                           driven by the growing number of
          number of digital consumers.                                                  smartphones, whose adoption will rise
             Mobile phone ownership is relatively                                       to 79% in 2025 from 69% in 2019.”
          widespread in the Latin American
                                                                                        ALEJANDRO ADAMOWICZ
          countries, although the penetration of
                                                                                        Director of Technology and Strategic
          subscribers to mobile phone services                                          Engagement for Latin America at GSMA
          varies by country. According to GSMA
          Intelligence’s report The Mobile Economy
          Latin America 2019, there were 422                                        has finally become the main technology
          million unique mobile subscribers                                         in Latin America, according to another
          across Latin America by the middle of                                     report from GSMA, called Region in
          2019, that is 68% of the region’s total                                   Focus, Latin America, with consolidated
          population. Furthermore, 81% of them                                      data from the first-quarter of 2020.
          also subscribe to mobile internet.                                           According to Alejandro Adamowicz,
             By 2025, GSMA forecasts that                                           Director of Technology and Strategic
          unique mobile subscribers penetration                                     Engagement for Latin America at GSMA,
          will reach 73% of the region’s total                                      Latin America is one of the top regions in
          population, and that 87% of them will                                     terms of traffic growth, driven by video and
          have access to mobile internet.                                           social networking applications. “The mobile
             Besides that, an important milestone                                   networks traffic is growing at an average
          to fuel this increasing connectivity                                      50% per year, and in some countries is
          emerged in the first quarter of 2020: 4G                                  doubling every 12 months,” he adds.

06 Mobile subscription evolution in Latin America
The historical evolution of mobile unique subscribers in Latin America from 2000-2020.


                                                                                           426M
                                                                    378M
                                                                                                                             AVERAGE
                                                                                                                         ANNUAL
                                                308M                                                                         GROWTH*


                                                                                                                         11.1%

                            163M


             52M
   
              2000          2005                 2010                    2015                   2020

                               *The CAGR measures the average rate that unique subscribers (i.e. human users of mobile services) grew in this region per year from 2000 to 2020.
                                                                                                                                                   06 Source: GSMA Intelligence.   14
01
   07 Mobile internet

                                                                                                                                                                         W H Y L AT I N A M E R I C A , A N D W H Y N O W ?
                                                         Latin America                                                          World
   overview in LatAm
   4G finally becomes the                        4G
   prevalent mobile technology                               34%
                                                                           43%            51%
   in Latin America.                                                                                                                 53%
   (in % of total connections)
                                                 3G          41%
                                                                           36%
                                                                                          32%                                        25%

                                                 2G          26%           21%                                                       22%
                                                                                          17%

                                                           Q1 2018       Q1 2019        Q1 2020                                   Q1 2020

                                       66%            67%           68%                                        66%


                                                             77%            79%           81%                                        75%

                           
                                        63%            66%           70%                                        66%

“Smartphone technology                                   “Across the world, people                  “This is one of the main
has allowed us to change                                 increasingly do their                      factors for us to democratize
our consumption, work,                                   banking through mobile                     financial services. Currently,
and shopping habits. And                                 phones or the internet.                    the technology already allows
these innovations tend                                   Mobile phones—including                    anyone with a smartphone
to be accentuated next                                   smartphones—not only                       to access complex financial
year with 5G technology                                  help previously excluded                   services. Just a cell phone,
when we will have an                                     adults get financial                       secure internet connection and
increase in the offer of                                 services. Research also                    some installed applications,
products and services                                    suggests they can help                     such as PayPal’s digital
via cell phone. Our                                      people manage economic                     wallet, for example, and this
expectation is that this                                 risks and deliver a host of                taxpayer has, in the palm of
will bring a new universe                                development benefits.”                     their hand, a powerful tool
of possibilities for services                            LEORA KLAPPER
                                                                                                    to buy, sell, pay their bills,
and consumption that                                     Lead economist of the World Bank’s         make investments etc. It is a
will be commercialized.                                  Development Economics Research             revolution in motion - and
                                                         Group, and manager of the Global
In addition, they will                                   Findex database                            one that will not stop. These
demand innovative                                                                                   mobile technologies are much
payment solutions and we                                                                            faster to develop and have
are prepared to serve this                                                                          a gigantic capillarization
market.”                                                                                            capacity.”
AUGUSTO LINS                                                                                        CARLOS NOMURA
President at Brazilian                                                                              Head of Payments at
company Stone                                                                                       PayPal Brazil

                                                                                                07 Source: Region in Focus, Latin America, Q1/2020, GSMA Intelligence.   15
01
                                                                                        W H Y L AT I N A M E R I C A , A N D W H Y N O W ?
Smartphones and internet
penetration driving e-commerce
in Latin America

           As already mentioned, connectivity
           is taking the region by storm, making
                                                      “The biggest contributing
           room for new digital commerce              factor [for e-commerce
           strategies to flourish, and this is one    growth in the region] has
           of the main reasons why the region is
                                                      been the widespread use
           such a key market for e-commerce.
              According to Ricardo Sfeir, digital     of smartphones.”
           commerce expert at Euromonitor,            SOFIA MERCER
           countries with greater development         Research analyst at AMI

           in the region, such as Brazil and
           Chile, also tend to have a high share      “The smartphone is
           of mobile versus desktop access,
                                                      at the center of digital
           something that discloses the evolution
           of the sector, and beyond that: the        transformation for
           greater use of apps for purchases and      consumers in the region,”
           activities in general.                     EDUARDO TUDE
              Indeed GSMA’s Region in                 President of the Brazillian
                                                      consultancy company specialized
           Focus, Latin America report, with          in telecommunications, Teleco
           consolidated data from the first
           quarter of 2020, shows that regular
           digital application engagement in Latin
           America is the highest in the world
           and a key driver for data traffic growth
           – and therefore, for digital goods and
           services consumption in general.

                                                                                        16
“Live Streaming-driven

                                                                                                             01
sales have become one

                                                                                                             W H Y L AT I N A M E R I C A , A N D W H Y N O W ?
of the hottest trends in
e-commerce, reshaping                “Mobile data usage in          According to the company’s head
the retail industry               Latin America doubled year     for Latin America, Ken Huang, during
                                  on year, reaching 4.7 GB       this year AliExpress’ global ‘Summer
by developing a ‘see-
                                  per subscriber per month       Sale’ Shopping Festival, its first large-
now, buy-now’ trend               in 2019. And usage is ex-      scale sales event after the pandemic,
that offers consumers             pected to grow more than       live streaming took the festival by
instant gratification.”           fivefold by 2025. This trend   storm. “Customers from 213 countries
                                  has been boosted by strong     watched 1,844 live streaming sessions to
KEN HUANG
AliExpress’ head for              smartphone adoption rates      purchase products. Over 1,300 brands
Latin America                     in the region (around 70% at   and 109 influencers participated in
                                  year-end 2019),” stated the    the sessions, covering 32 languages.
                                  organization.                  Russia, Spain, France, Brazil, and Poland
                                     Another key factor when     were the top 5 countries that led the
                       it comes to the region’s potential for    live streaming viewership,” Huang told
                       e-commerce is how passionate about        EBANX.
                       social media and online engagement           In late May, the company launched
                       as a whole Latin Americans are. As        a platform called AliExpress Connect
                       consumers in the region spend more        that bridges influencers and the
                       time online, they also consume more       company’s top sellers and brands, and
                       online.                                   sees in Latin America one of the main
                          As forecasted by the marketing         markets where the initiative can most
                       Saas company Socialbakers, even           develop itself.
                       before the COVID-19 pandemic,                This scenario, combined with Latin
                       2020 was set to be the year that social   Americans’ willingness for sharing
                       commerce would take off worldwide,        their lives through social media and
                       reaching Latin America as well.           for mobile engagement as a whole,
                       Alibaba’s international online            urges e-commerce companies and
                       marketplace AliExpress, which has         digital services providers to look at
                       Brazil as one of its top 5 markets        this social commerce potential, but
                       in the world, is one of the pioneers      also to understand its particularities
                       when it comes to shopping videos.         and strategies that encompass local
                                                                 preferences, language and payment
                                                                 methods.

                                                                                                             17
Forced digitization and the newcomers

                                                                                                                                                                   01
to e-commerce in Latin America

                                                                                                                                                                   W H Y L AT I N A M E R I C A , A N D W H Y N O W ?
The COVID-19 pandemic put digitization                       2020, more than double the amount                             “Consumers
to play a role at an unprecedented                           expected prior to COVID-19.                                   that repelled the
pace in the region. Latin Americans                             By 2022, e-commerce is likely to reach                     idea of using an
are buying on digital channels like                          63% penetration of the total population,                      online service
never before. And this wave of rapid                         compared to the 45% penetration at                            have no choice
digitization is likely here to stay.                         the beginning of 2020, winning 84                             but to. And
Those who had not yet bought online                          million new consumers (70% more                               the better the
before are being highly encouraged                           than would have done so organically).                         experiences,
to do so in the current stay-at-home                            The reality has shown that                                 the more open
circumstances. They are using digital                        business and payments digitization                            you are to using
tools to shop, compare prices, and pay.                      has left the realm of trends: stores                          and trying out
   In Latin America as a whole,                              will need to think of ways to deliver                         different forms.”
AMI data points out that 52 million                          everything; banks will need to
                                                                                                                           SOFIA MERCER
new latino consumers are expected                            offer efficient, instant, and easy-                           Research analyst
to buy online for the first time in                          to-use access to their services.                              at AMI

   08 Newcomers to LatAm’s e-commerce                                         09 E-commerce consumers
   COVID-19 more than doubled the estimates about new                         per country
   online consumers in Latin America.                                         Consumers that have never bought online
   (in millions of consumers)                                                 before are being highly encouraged to do so
                                                                              in the current stay-at-home circumstances.
  
                                                             63% e-comm
                                                             penetration
                                                                              % of the population that are        % of the population that will be
                                                                                 e-commerce users, January 2020      e-commerce users, December 2020
                 52 M
  
                                                             55% e-comm                                               64% 68%
                                                             penetration             61%         60%                                      61%
                                                                                                           55%                   57%
                                                                               49%                                                                       51%
                                                                                           46%          43%                                        43%
              23 M
  

                                                                             Brazil      Mexico      Colombia      Argentina        Chile          Peru
        Q1 20 Q2 20   Q3 20 Q4 20   Q1 21   Q2 21   Q3 21   Q4 21   Q1 22

                                                                                25%          31%          29%            5%            6%            32%
        Time period      Forecast pre-COVID     Forecast under COVID-19              2020 expected growth in the number of e-commerce consumers

    EBANX TIP

In this scenario, the e-commerce industry must devise ways to
make its channels and platforms convenient and user-friendly
enough to entice the recently digitized Latin America.

                                                                                                                                                08 Source: AMI.
                                                                                                          09 Source: Visa plus local open sources, AMI analysis.   18
02
                                                                                               L AT I N A M E R I C A’ S P O T E N T I A L F O R E - C O M M E R C E
CHAPTER 02

Latin America’s
potential for
e-commerce
             COVID-19 has just emphasized this:
             Latin America is still the next big
             thing when it comes to e-commerce

             Currently, both consultancy firms            The reason for this comes
             Americas Market Intelligence (AMI)        from an undergoing change in
             and Euromonitor place Latin America       the distribution of e-commerce
             as the second-fastest-growing market      expenditure caused by the COVID-19
             for e-commerce in the world, only         crisis, not just in the region, but
             behind South East Asia.                   worldwide. The travel vertical
                AMI estimates that, in 2020,           was the most hit by the crisis due
             e-commerce market in Latin America        to the isolation measures caused
             will grow almost 8.5% over 2019,          by the pandemic, pushing down
             which is a number surprisingly low        e-commerce sales as a whole.
             when compared to the double digits        Retail and digital goods were also
             growth registered in the past years.      affected, but reacted faster (see the
             In 2019, e-commerce grew 20% over         details in the next page).
             the previous year, reaching $177.56
             billion in TPV. The region, however, is
             expected to gain a new pace in 2021.

                                                                                               19
02
   If we consider the forecasts for                      10 GDP growth versus e-commerce growth

                                                                                                                                                               L AT I N A M E R I C A’ S P O T E N T I A L F O R E - C O M M E R C E
economic growth in Latin America                         in Latin America
and other regions, however, we can                       Despite the political uncertainties and the economic setbacks,
                                                         the e-commerce sector is growing way ahead of the region’s
infer that the region could become                       general economy.
“the” fastest-growing region for
                                                                                                           GDP growth*         E-commerce growth **
e-commerce, alongside SE Asia.
   “[In our view] Latin America will                     

experience an -8.5% decline in GDP
                                                                       20%
                                                                                                                                     19.43%
growth in 2020, compared to -8% in                       

Europe, -10% in South East Asia, and
                                                                                                   8%
-3% in Africa. As a result, we expect                    
                                                                                                                                     3.6%
Latin America to match SE Asia in                                     0.8%
e-commerce growth, whereas in                             

the past it was trailing just behind,”                                                           -8.1%

evaluates Lindsay Lehr, associate                       
                                                                      2019                        2020                               2021
managing director at AMI.

Retail                                Travel                                    Digital goods
It is growing at 21% this year, and   This segment experienced the              and services
it will have recovered by 2021, but   biggest hit, falling almost to zero       An industry that has been
growing to similar rates to 2019.     in April, and slowly recovering           growing 20% to 30% YoY, in 2020
                                      throughout 2020, but still                is reaching 45% growth.
Key drivers for growth after          ending the year with negative
COVID-19: home-office, gym,           performance. AMI expects a 37%            Key drivers for growth after
and home gym, toys for kids,          drop in travel this year. For the         COVID-19: delivery apps,
electronics to support being at       consultancy firm, this segment            grocery delivery, streaming,
home.                                 will take around two years to             online content, online gaming.
                                      fully recover from the COVID-19           Other emerging categories:
                                      impact.                                   online education, telemedicine,
                                                                                productivity services, SaaS.
                                      Key drivers for growth after
                                      COVID-19: local/domestic
                                      tourism, and business trips.
                                      But only with a vaccine will the
                                      segment really recover.

                                                                                10 Sources: *annual growth and projections by the IMF; **projections by AMI.   20
Ricardo Sfeir, a digital commerce    11 Latin American international vs. domestic

                                                                                                                                                                    02
expert at Euromonitor, emphasizes       e-commerce spend

                                                                                                                                                                    L AT I N A M E R I C A’ S P O T E N T I A L F O R E - C O M M E R C E
that the region held the second-        The cross-border share of e-commerce spend suffered in 2020 due
                                        to COVID-19, but it is likely to fully recover by 2023. (billion of USD)
highest growth in digital commerce
in the last five years, from 2014 to
                                                                                                                                     Total volume
                                        
2019, and it will probably be the one                                                                                            International
                                                                                                                                          Domestic
leading the sector’s growth in the                
                                        
coming years (2020-2024).                                                                     

   Latin America’s first and biggest    
                                                  
                                                                                                            
economy, Brazil remains the
                                                  
regional giant, representing 58%        
                                                                                                                        
of total e-commerce spend in 2019,                
                                        
according to AMI. By 2023, the                                                                                                       

market intelligence firm forecasts
that the region will surpass $300       Y-o-Y growth in total volume                                   International e-commerce
                                                                                                       share of the total spend
billion in e-commerce volume.              Domestic         International


“Delivery apps have                                                       
gotten Latin American                     
                                                                                 

consumers used to a                       
                                                                          
                                                                                                                                      
greater array of things                                                  
                                          
online, becoming more                                                          

comfortable with the
online channel in
general. This has lifted
digital goods overall.”                 12 E-commerce volume per country
                                        Brazil and Mexico are the largest markets in Latin America,
LINDSAY LEHR                            but Colombia and Chile are growing at a faster pace. (billion of USD)
Payments expert and associate
managing director at AMI
                                                                                                                                                Brazil
                                                                                                                          12.09%                    Mexico
                                        
                                                                                                                                                    Colombia
                                                                                                    13.77%                                      Chile

                                                                                    19.43%
                                                                         8.35%
                                                     21.37%


                                                                                                                        14%
                                                                                                          17%
                                                                                         25%
                                                                       12%
                                                          18%                                                              27%
                                                                                                          32%
                                                                           9%            16%
                                                       28%

                                                          25%              1%            23%              31%              25%
                                           
                                                  2018            2019           2020            2021            2022              2023

                                                                                                                                 11 Source: AMI. *Projections.
                                                                                                                 12 Source: AMI. From 2020-2023: Projections.       21
An overview of the

                                                                                                                                              02
                                                                                                                                              L AT I N A M E R I C A’ S P O T E N T I A L F O R E - C O M M E R C E
e-commerce market
in Brazil, Mexico,
Colombia, and Chile
Brazil
The Brazilian E-commerce
Association (ABComm) estimates an
18% growth for e-commerce in 2020,         45%                          32%                            61%
reaching BRL 106 billion in revenue        It is the share that         It is the share that           of the Brazillian
                                           the digital goods            the retail segment             adults will be online
– but as the sector gains ground with      segment will have of         will have of the total         consumers by
newcomers pushed by the pandemic,          the total e-commerce         e-commerce market              the end of 2020, a
this forecast is likely to be surpassed,   market in Brazil by the      in Brazil by the               25% growth when
                                           end of 2020, a 42%           end of 2020, a 23%             compared to 2019.
according to the organization.             growth over 2019.            growth over 2019.
AMI, in its turn, forecasts a 10%
growth for the country’s domestic
e-commerce market, and a -11%
                                              13 E-commerce in Brazil
drop for the cross-border market.
                                              The largest e-commerce market in LatAm is likely
   This negative growth on cross-             to more than double its growth next year.
border e-commerce reflects a scenario
where international purchases                  Historic and projected
decreased during this year, ending             market growth                                Volume, in billion of USD     Y-o-Y growth

up with only 7% of 2020’s total share                                                                                          

of the e-commerce market. In 2020,             
                                                                 21%
                                                                                          19%                           
                                                                                                                                  
                                                                                                       
as travel was the most impacted                                                          
                                                                                                        14%
sector, digital goods is likely to take        
                                                                 
                                                                                                                    12%       

                                                      
the lead as the main vertical in terms
                                                                               8%
                                                                                                                                

of expenditure, with a projected $50
billion spend, out of $112.4 in total                                                                                            

                                                      2018      2019        2020*       2021*         2022*             2023*
volume (please check the “market size
by vertical” graphic, on the next page).

                                           “Brazilians tend to be first movers, fast technology
                                           adopters. [The country] is already a very vibrant
                                           ecosystem for digital goods and services. We see Brazil as
                                           a very fertile ground for digital goods; it is most likely the
                                           most competitive market.”
                                           LINDSAY LEHR
                                           Payments expert and associate managing director at AMI

                                                                                                                 13 Source: AMI. *Forecast.   22
02
Cross-border e-commerce vs. Domestic e-commerce

                                                                                                                                                                                                                 L AT I N A M E R I C A’ S P O T E N T I A L F O R E - C O M M E R C E
 Volume, in billion of USD                        Total        Cross-border        Domestic


                                                                                                                                         2020                              Cross-border
 
         
                                                                                                                                         share*                            Domestic


         Y-o-Y growth                                                                    Split by vertical
                                                                                         2019
         2019-2020* growth

                                                                                                                                                                                
                  Cross-border
                  
                                          Domestic
                                                                                                                                                                                  Digital
                                                                                                                                                                                  goods
                                                                                               Retail                               Travel
                                          Total
                                                                                                                                                                          

        -15      -10     -5           0           5            10        15

E-commerce by device (desktop vs. mobile)
 Volume, in billion of USD                              Total         Desktop      Mobile                                                   Y-o-Y growth
                                                                                                                                            2019-2020* growth


                                                                                                                                      Mobile
                                                                                                                                                
                                                                                                            2020           
                                                                                                         share*                                    Desktop
                                                                                                                                                     
                                                                           
                                                                                                                                                Total


                                                                                              Desktop        Mobile               0      2%    4%    6%   8%     10%      12%     14%   16%   18%


Market size by vertical
 Volume, in billion of USD                Total       Retail         Travel     Digital Goods                                               Y-o-Y growth
                                                                                & Services
                                                                                                                                            2019-2020* growth

         
                                                                                                                                                                     Retail
                                                                                                                                                       
                                                                                                            2020                                  Travel
                                                                                                               share*                                
         
                                                                                                                                                                     Digital Goods
                                                                                                                                                          
                                                                                                                    
                                                                                                                                                                             Total
                                                                                                                                                                       
                                                                                                      Retail    Travel
                                                                          
                                                                                                                                          -40% -30% -20% -10%       0      10%      20%     30%   40%   50%
                                                                                                           Digital Goods & Services

                                                                                                                                                                                    13 Source: AMI. *Forecast.   23
02
                                                                                                                                                  L AT I N A M E R I C A’ S P O T E N T I A L F O R E - C O M M E R C E
Mexico

The second-largest market in the                    with an underserved population when it
region, Mexico has been showing a                   comes to payments and digital adoption.
digital goods growth of 37% during
2020 and an e-commerce penetration
                                                       For Ricardo Sfeir, digital commerce
                                                    expert at Euromonitor, Mexico has
                                                                                                               30%
                                                                                                               It is the share that the
that grows faster than in Brazil.                   two major traits that define its digital                   digital goods segment
   But according to AMI, Mexico has                 market: low internet penetration, but                      will have of the total
                                                                                                               e-commerce market
been particularly laggard in the adoption           a massive economy. “This difference
                                                                                                               in Mexico by the end
of digital technologies. “You have the              explains why the country is still far                      of 2020, a 37% growth
upper-middle class who looks and                    behind Brazil in the development of                        when compared to 2019.

feels like folks who live in first world            e-commerce, for example. However,
countries, fast technology adopters                 any increase ends up causing a
                                                                                                               63%
                                                                                                               It is the share that the
very comfortable with e-commerce.                   massive boost due to its economic size,                    retail segment will have
Then you have a large segment of the                which results in the country filling                       of the total e-commerce
population that still operates very much            the second place in the ranking of                         market in Mexico by
                                                                                                               the end of 2020, a 16%
in cash, in the informal economy, and is            digital market size,” says Ricardo.                        growth over 2019.
much slower to adopt digital payments                  Digital payments, however, are still
and digital goods,” stresses Lehr.                  a hurdle: “The expectation is that the                     60%
   According to her, the landscape is               country will follow the steps of Brazil in                 of the Mexican
                                                                                                               adults will be online
changing, fueled by the pandemic. The               terms of speed in the rise of digital, but                 consumers by the end
acceleration towards digitization is                we know that Mexico is still way behind                    of 2020, a 31% growth
particularly strong in Mexico, a country            in the development of digital payments.”                   when compared to 2019.

   14 E-commerce in Mexico
   The second largest e-commerce market in LatAm has been showing
   an e-commerce penetration that grows faster than in Brazil.
                                                                                                      “Mexico is an
   Historic and projected market growth                  Volume, in billion of USD     Y-o-Y growth   exciting market
                                                                                                for the increased
                         32%
   
                                                                                     
                                                                                                   adoption of digital
   
                                                             25%                              goods.”
                 19%
                                                            
                                         18%
                              17%                                     17%                   
                                                 
                                                                                      14%
                                                                                                      LINDSAY LEHR
                                         
                                          12%                                          
                                                                                                      Payments expert and associate
                         
                                                                                       
                                                                                                      managing director at AMI


         2015    2016    2017    2018    2019    2020*      2021*      2022*         2023*

                                                                                                                     14 Source: AMI. *Forecast.   24
02
Cross-border e-commerce vs. Domestic e-commerce

                                                                                                                                                                                                              L AT I N A M E R I C A’ S P O T E N T I A L F O R E - C O M M E R C E
Volume, in billion of USD                 Total      Cross-border       Domestic


                                                                                                                                   2020                                  Cross-border

        
                                                                                                                                   share*                                Domestic


        Y-o-Y growth                                                          Split by vertical
        2019-2020* growth                                                     2019

            Cross-
            border
                                                                                                    
            Domestic
                                                                                                                                                                         Digital
                                                                                                                                                                goods
                                                                                                                                                                                          
                                                                                             Retail                              Travel
            Total
            

        0        2%    4%   6%   8%   10%    12%     14%      16%

E-commerce by device type (desktop vs. mobile)
Volume, in billion of USD                     Total        Desktop      Mobile                                                        Y-o-Y growth
                                                                                                                                      2019-2020* growth


                                                                                                                                Mobile
                                                                                                                                          
                                                                                                       2020           
                                                                                                     share*                          Desktop
                                                                                                                                      
                                                                
                                                                                                                                          Total


                                                                                         Desktop        Mobile              0             5%         10%         15%            20%      25%

Market size by vertical
Volume, in billion of USD         Total     Retail        Travel     Digital Goods                                                    Y-o-Y growth
                                                                     & Services
                                                                                                                                      2019-2020* growth

                                                                                                                                                                            Retail
                                                                                           
                                                                                                                                                                   
                                                                                                          2020                                     Travel
                                                                                                          share*                                   
        
                                                                                                                                                                Digital Goods
                                                                                                                                                           
                                                                                                                                                                              Total
                                                                                                                                                                         
                                                                                                 Retail    Travel
                                                                    
                                                                                                                                    -60%          -40%      -20%     0        20%          40%     60%
                                                                                                      Digital Goods & Services

                                                                                                                                                                                 14 Source: AMI. *Forecast.   25
02
                                                                                                                                                    L AT I N A M E R I C A’ S P O T E N T I A L F O R E - C O M M E R C E
Colombia
With a fast-growing pace of digital                        For Euromonitor, although
goods (63%), Colombia has in a local                    Colombia is the most delayed
player one of the major drivers for its                 country among the largest                                18%
digitization. According to AMI, Rappi,                  economies in the region when it                          It is the share that the
the popular Colombian super app, has                    comes to development of digital                          digital goods segment
                                                                                                                 will have of the total
been boosting the digital category in                   commerce and connectivity                                e-commerce market in
the country, and beyond that: preparing                 rates, the country has the highest                       Colombia by the end
Colombians to adopt digital goods                       growth rates in digital commerce                         of 2020, a 63% growth
                                                                                                                 over the previous year
and services, as well as e-commerce,                    and its rapid and steady increase
in all areas of their daily lives.                      in the penetration of mobile                             68%
   “Similar to Mexico, Colombia has two                 devices is having an effect on the                       It is the share that
worlds: urbanized people who are very                   development of the local ecosystem.                      the retail segment
                                                                                                                 will have of the total
used to technology and are already avid                 “The country, for instance, ends
                                                                                                                 e-commerce market
adopters of digital goods, and outside                  up having higher rates of digital                        in Colombia by the
the major cities, people who are coming                 payments under total digital trade                       end of 2020, a 19%
                                                                                                                 growth over 2019.
to e-commerce for the first time,” points               than Mexico,” points out Sfeir.
out Lehr. E-commerce penetration in the
                                                                                                                 55%
country is likely to reach 55% in 2020.                                                                          of the Colombian
                                                                                                                 adults will be
                                                                                                                 online consumers
                                                                                                                 by the end of 2020,
                                                                                                                 a 29% growth when
   15 E-commerce in Colombia                                                                                     compared to 2019.
   The country has the highest growth rates in digital commerce.

    Historic and projected market growth                Volume, in billion of USD     Y-o-Y growth

                                                                                               “Colombia is perhaps
                                 46%
                                                                                                     the most favorable


                                                                        32%
                                                                                              
                                                                                              
                                                                                                     market for digital goods
                                         28%
    
                  21%
                         25%                               
                                                                                     27%
                                                                                                  adoption in 2020.”


                                                       16%                               
                                                                                                     LINDSAY LEHR
                                                 9%                                           
                                                                                               Payments expert and associate
                                                                                          
          
                                                                                                   managing director at AMI
          2015   2016    2017   2018     2019   2020*      2021*      2022*         2023*

                                                                                                                       15 Source: AMI. *Forecast.   26
02
Cross-border e-commerce vs. Domestic e-commerce

                                                                                                                                                                                                               L AT I N A M E R I C A’ S P O T E N T I A L F O R E - C O M M E R C E
 Volume, in billion of USD                      Total       Cross-border         Domestic


                                                                                                                                      2020                                  Cross-border
 
          
                                                                                                                                      share*                                Domestic


         Y-o-Y growth                                                                Split by vertical
         2019-2020* growth                                                           2019

                  Cross-border
                                                                                                         
                                                                                                                                                                                            
                                        Domestic                                                                                              
                                                                                                                                                                               Digital
                                                                                                                                                                                  goods
                                                                                                    Retail                          Travel
                                        Total
                                                                                                                                                             
                                                                                            
        -20%    -15%   -10%   -5%   0      5%      10%      15%     20%

E-commerce by device type (desktop vs. mobile)
Volume, in billion of USD                           Total         Desktop      Mobile                                                   Y-o-Y growth
                                                                                                                                        2019-2020* growth


                                                                                                                                            Mobile
                                                                                                                                                    
                                                                                                           2020          
                                                                                                         share*                                Desktop
                                                                                                                                                
                                                                        
                                                                                                                                                    Total


                                                                                                Desktop      Mobile            -5      0             5%       10%         15%       20%     25%

Market size by vertical
Volume, in billion of USD           Total        Retail       Travel        Digital Goods                                               Y-o-Y growth
                                                                            & Services
                                                                                                                                        2019-2020* growth

                                                                                                   
                                                                                                                                                                  Retail


                                                                                                              2020                             Travel
                                                                                                              share*                           
         
                                                                                                                                                               Digital Goods
                                                                                                                                                          
                                                                                                                                                                         Total
                                                                                                                                                                    
                                                                                                    Retail    Travel
                                                                            
                                                                                                                                      -60%   -40%      -20%       0         20%      40%     60%    80%
                                                                                                         Digital Goods & Services

                                                                                                                                                                                  15 Source: AMI. *Forecast.   27
02
                                                                                                                                                      L AT I N A M E R I C A’ S P O T E N T I A L F O R E - C O M M E R C E
Chile

With the most banked population                        has experienced a surge in digital goods
among all the other Latin American                     during the pandemic and is likely to see
countries, almost everyone in Chile                    this segment reach a share of 26% of all                    26%
has access to a debit card and a                       e-commerce volume.                                          It is the share that the
bank account.                                             According to Euromonitor, Chile                          digital goods segment
                                                                                                                   will have of the total
   On the other hand, due to the closed                leads the internet penetration rate in the                  e-commerce market in
payments acquiring landscape, there are                region, with 86.1% of consumers online                      Chile by the end of 2020,
lower levels of new technology moving                  in 2019. On the other hand, it is the only                  a 53% growth over the
                                                                                                                   previous year.
into the country. “On the e-commerce                   country that has the highest percentage
side, we have really sophisticated and                 of use of desktop as an online shopping                     51%
advanced online retailers and players in               device: a cultural trait. Chile is also the                 It is the share that the
the travel industry, but less movement in              only country in the region, along with                      retail segment will have
                                                                                                                   of the total e-commerce
digital goods because of this less flexible            Brazil, to have bill payments as the
                                                                                                                   market in Chile by the end
payments infrastructure, that has held                 main industry within digital commerce,                      of 2020, a 25% growth
back the fintech revolution a little bit,”             with good levels of internet banking                        over 2019.
points out Lehr. Even so, the country                  nationally.
                                                                                                                   61%
                                                                                                                   of the Chilean adults will
                                                                                                                   be online consumers
   16 E-commerce in Chile                                                                                          by the end of 2020, a 6%
                                                                                                                   growth when compared
   It has the most banked population among all the other Latin American countries.
                                                                                                                   to 2019.

    Historic and projected market growth                 Volume, in billion of USD     Y-o-Y growth

                                                                                                “Chile is the smallest market
                                                                                               
   
                          38%
                                                                         31%
                                                                                          
                                                                                                      in terms of the number of
                                                                     
                                                                                                   people [...] But you have got
                                  28%                         23%
                                                                                                      an opportunity to really
                                                                                               
                  26%                     25%                                         25%


                                                                                           get in the door in the early


                                                                                                      stages and take advantage


                                                  1%
                                                                                                    of this acceleration of digital
                                                                                              
                                                                                                      goods we are seeing under the
          2015   2016    2017    2018     2019   2020*      2021*      2022*         2023*
                                                                                                      pandemic.”
                                                                                                      LINDSAY LEHR
                                                                                                      Payments expert and associate
                                                                                                      managing director at AMI

                                                                                                                         16 Source: AMI. *Forecast.   28
02
Cross-border e-commerce vs. Domestic e-commerce

                                                                                                                                                                                                                  L AT I N A M E R I C A’ S P O T E N T I A L F O R E - C O M M E R C E
 Volume, in billion of USD                Total         Cross-border        Domestic


                                                                                                                                  2020                                       Cross-border
          
                                                                                                                              share*                                     Domestic


         Y-o-Y growth                                                            Split by vertical
         2019-2020* growth                                                       2019

                 Cross-border
                                                                                                                                                                                

                                               Domestic
                                                                                                                                                                              Digital
                                                                                                                                                                           goods
                                               Total
                                                                                          Retail                                Travel
                                                                                                                                                                    
                                                                                        
        -40%     -30%     -20%   -10      0%           10%       20%

E-commerce by device type (desktop vs. mobile)
Volume, in billion of USD                       Total         Desktop      Mobile                                                   Y-o-Y growth
                                                                                                                                    2019-2020* growth


                                                                                                                                                     Mobile
                                                                                                                                                          
                                                                                                         2020
                                                                                                     share*                                Desktop


                                                                                                                                                              Total


                                                                                         Desktop         Mobile                                         2%
                                                                                                                                   -6%   -4%    -2%      0             4%     6%       8%   10% 12% 14%

Market size by vertical
Volume, in billion of USD         Total       Retail         Travel     Digital Goods                                               Y-o-Y growth
                                                                        & Services
                                                                                                                                    2019-2020* growth

                                                                                                                                                                     Retail
 
                                                                                                                                                                
                                                                                                         2020                               Travel
                                                                                                         share*                                
         
                                                                                                                                                                        Digital Goods
                                                                                                                                                             
                                                                                                                                                                            Total
                                                                                                                                                                        
                                                                                                Retail    Travel
                                                                                         Digital Goods & Services     -60%     -40%          -20%          0             20%      40%      60%

                                                                                                                                                                                     16 Source: AMI. *Forecast.   29
The main players in Latin America

                                                                                                                                                                                                        02
                                                                                                                                                                                                        L AT I N A M E R I C A’ S P O T E N T I A L F O R E - C O M M E R C E
The AI-based market intelligence                                                             To compose the overall ranking of
platform SimilarWeb, founded in 2007 by                                                   main e-commerce players in Latin
Or Offer, measures the digital market by                                                  America (infographic 17), SimilarWeb
providing traffic intelligence to monitor                                                 first analyzed the relevance of websites
and understand data. In this ranking                                                      within the category of e-commerce in
provided for EBANX, SimilarWeb                                                            each country. Next, it added all the main
discloses the top ten e-commerce                                                          websites of each country (infographic
players in Latin America, and also                                                        18) in a customized category in order
the ten top websites per country.                                                         to analyze them side by side.

   17 Top 10 e-commerce websites in Latin America

   Traffic Share              Data from July 2020                                                   Traffic Share January 2020 - July 2020
                                                                                                    
    BR                                                                            
    AR                                                                                           

    BR                                          
                                                                                                    
    MX                                          
    BR                                        
                                                                                                    
    BR                                
    BR                                                                                          

    BR                           
                                                                                                    
    MX                         
    CO                                                                                             
                          0           5%             10%            15%           20%        25%           JAN 20        FEB 20    MAR 20    APR 20           MAY 20       JUN 20       JUL 20

   Monthly Visits               In millions
    BR                                                                  
    AR                                       
                                                                                                    Desktop vs Mobile
    BR                                                                                                                                                  
                                                                                                       Desktop                              CO                                MX
    MX                              
                                                                                                       Mobile
    BR                                  
    BR                      
    BR                        
                                                                                                      
    BR                 
    MX                                                                                                                                              
                                                                                                                    BR                      BR                                BR
    CO              
                          0         50M         100M         150M         200M     250M      300M

   Unique Visitors               In millions

    BR                                                                     
    BR                                                                                                                                          
                                                                                                                    BR                      MX
    MX                                                                                                                                                         BR

    BR                                           
    AR                                     
    BR                                 
    BR                                       
    BR                                                                                                                     
                                                                                                                    AR                      BR
    MX                       
    CO                  
                          0         10M          20M          30M         40M      50M       60M

                                                                                                                                                                               17 Source: SimilarWeb.   30
You can also read