A Systematic Study on the Analysis of the Emission of CO, CO2 and HC for Four-Wheelers and Its Impact on the Sustainable Ecosystem - MDPI
←
→
Page content transcription
If your browser does not render page correctly, please read the page content below
sustainability

Article
A Systematic Study on the Analysis of the Emission
of CO, CO2 and HC for Four-Wheelers and Its Impact
on the Sustainable Ecosystem
Rohit Sharma 1 , Raghvendra Kumar 2 , Pradeep Kumar Singh 3, * , Maria Simona Raboaca 4,5, *
and Raluca-Andreea Felseghi 5
 1    Departments of Electronics & Communication Engineering, SRM Institute of Science and Technology,
      NCR Campus, Ghaziabad 201204, India; rohitapece@gmail.com
 2    Department of Computer Science and Engineering, GIET University, Gunupur, Odisha 765022, India;
      raghvendraagrawal7@gmail.com
 3    Department of CSE, ABES Engineering College, Ghaziabad, Uttar Pradesh Pin-201009, India
 4    National Research and Development Institute for Cryogenic and Isotopic Technologies—ICSI Rm. Valcea,
      Uzinei Street, No. 4, P.O. Box 7 Raureni, 240050 Valcea, Romania
 5    Faculty of Electrical Engineering and Computer Science, Stefan cel Mare University of Suceava,
      Universităţii Street, No.13, 720229 Suceava, Romania; Raluca.FELSEGHI@insta.utcluj.ro
 *    Correspondence: pradeep_84cs@yahoo.com (P.K.S.); simona.raboaca@icsi.ro (M.S.R.)

 Received: 14 June 2020; Accepted: 9 August 2020; Published: 19 August 2020

 Abstract: The urbanization in Delhi NCR has led to a rapid increase in the vehicle count concerning
 the rise in population and mobilization. The emissions from the vehicles are currently counted
 amongst the main sources of air pollution in Delhi. This affects the quality of air. The emission
 criterion of various pollutants that are emitted from vehicles is evaluated through various International
 models, which include various vehicles, their modes of pollutants emitted while driving and other
 factors that are affecting the weather. The approximate emission of pollutants such as Carbon
 Monoxide (CO) and/or Particulate Matter (PM), from a variety of vehicles and different fuel types, has
 undergone diurnal variation over the years, depending on the time of the day. This study presents
 the emission factor of gaseous pollutants Hydrocarbons (HC), Carbon Monoxides (CO) and Carbon
 Dioxide (CO2 ) of 181 four-wheeler cars from different companies containing different types of fuels.
 The measurement of gaseous pollutants is performed for Delhi, the most polluted city in India.
 The various facts and data were calculated and analyzed with reference to the standard values set
 by the national schemes of the Pollution and Environment. Based on this statistical data obtained
 and analyzed, the scenarios regarding future vehicle growth rate and its impact on air quality are
 mentioned to overcome emission problems. Therefore, it is important to develop and deploy methods
 for obtaining real-world measurements of vehicle emissions, to estimate the pollutants. The analysis
 shows that few parameters need to be a concern for reducing the pollutants emission by vehicles.
 These major parameters are the high survival rates, decrease in annual mileage and major enforcement
 for three-to-five-year-old vehicles. This study shows that many old vehicles are used in different
 regions of the country, regardless of many notifications of banning old vehicles by the Government of
 India. These old vehicles are the major source of vehicle pollutants. The analysis stated that the diesel
 engine would emit less CO2 /km than a petrol engine if having an almost similar engine capacity.

 Keywords: vehicular emissions; pollutants; Carbon Monoxide; Particulate Matter (PM)

Sustainability 2020, 12, 6707; doi:10.3390/su12176707                     www.mdpi.com/journal/sustainability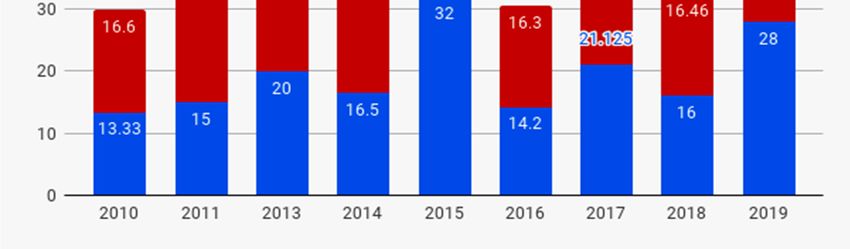
Sustainability 2020, 12, 6707                                                                        2 of 22

1. Introduction
      India is one of the biggest emitters of pollutants, and vehicle pollution is one of the major sources
of these pollutants. Here we present an inventory of vehicle pollution for different car models and
companies. This inventory is the study of major pollutants Hydrocarbons (HC), Particulate Matter (PM),
Carbon Monoxides (CO) and Carbon Dioxide (CO2 ), for the period from 2005 to 2019. These inventories
play a very important role when we discuss the input for modeling of atmospheric composition, about
the air and other pollution. In this paper, we study the major makers/companies of four-wheelers
vehicles that emit the pollutants in the air. The maker/companies considered for this study are Toyota,
Maruti Suzuki, Hyundai, Honda, Mahindra, TATA and some other luxury makers.
      According to WHO, air pollution kills around seven million people worldwide every year.
The data show that approximately 90% of the population breathes air containing high levels of
pollution, resulting in around seven million deaths every year due to such exposure. In January 2019,
the state-run Central Pollution Control Board’s air-quality index shows that the concentration of
poisonous Particulate Matter, also known PM 2.5, stood at 440 and about 12 times more than the
US-government-recommended level, i.e., the level of 35. Therefore, it becomes imperative for us to
deeply understand and analyze the causes of air pollution in our surroundings. Vehicles are one of the
major sources of emission of pollutants, especially in urban areas. The major pollutants associated
with vehicular emission are Hydrocarbons (HC), Particulate Matter (PM), Carbon Monoxides (CO)
and Carbon Dioxide (CO2 ). In this paper, we analyze these major pollutants emitted by different fuel
vehicles. In the next section, we detail these pollutants in brief. The fuel and air can be the source of
different pollutants that can be harmful to human health. Here we discuss some of the major pollutants
caused by vehicular emission.
      Fuel + Air ←Hydrocarbons + Carbon Dioxide + Carbon Monoxide + Nitrogen Oxide + Sulfur
Dioxide + water.
      Hydrocarbons (HC) are considered to be specks of molecules of fuel that are not fully burned.
These react when sunlight and oxides of Nitrogen are present, and the reaction results in the formation
of ground-based ozone. The ozone so formed majorly contributes to smog and irritates the eyes and
nose and also damages the lungs. Some exhausts’ HCs are harmful, too, with the potential to cause
cancer. Carbon Monoxide (CO) is the product of the incomplete burning of Hydrocarbons-based fuels.
It is a colorless, odorless and poisonous gas. Mostly, when cars are about to start, and if they are
not tuned in a proper way or at higher altitudes, where the fraction of oxygen that is available for
combustion decreases, then the CO formed has a low air-to-fuel ratio in the engine. Two-thirds of the
CO emissions arise from the sources of transport, cars being the largest contributor. In some areas,
the contribution of on-road vehicles to Carbon Monoxide pollution may rise up to 90%. The affinity
of CO to hemoglobin is about 250 times more than the oxygen. This may cause mild-to-severe
poisoning, depending upon the concentration of CO and its exposed length. The symptoms include
headache, dizziness, nausea, vomiting and loss of consciousness. Carbon Dioxide (CO2 ), as per the US
Environmental Protection Agency (EPA), initially inspected CO2 as a result of “complete” combustion,
but now suspects Carbon Dioxide as the concern of pollution. CO2 is a greenhouse gas that traps the
heat of the earth and contributes to the change in the climate.
      We have seen that the new vehicles are comparatively less polluting than before, but the number
of vehicles and the overall distances traveled by them has considerably increased, and the people,
especially while commuting, are heavily exposed to such pollutants. One such region which has
an air-quality level of criticism is the Delhi National Capital Region. Delhi, also being the capital,
is undergoing rapid development, with an ever-increasing number of vehicles, reaching more than
10 million now. Delhi NCR has been given the worst position among the 14 major cities of the
country, on the basis of vehicular emissions, according to a study conducted by the Centre for Science
and Environment (CSE). A survey conducted by IIT-Kanpur has revealed that such emissions from
vehicles contribute 9% of the total Particulate Matter 10 (PM10) and 20% of the total PM2.5 in the
national capital. Recently there have been some initiatives taken to curb or reduce vehicular pollution,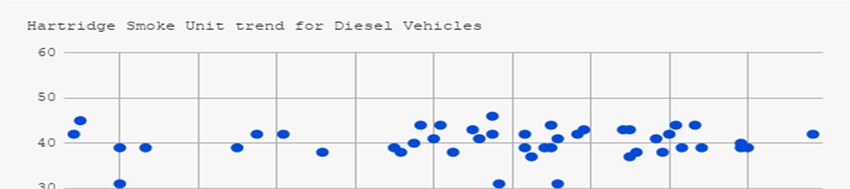
Sustainability 2020, 12, 6707                                                                        3 of 22

including public-awareness campaigns, registration of only those first-sale four-wheeled petrol-driven
vehicles which have catalytic converters installed, the expansion of the rapid public transport
system, the phasing out of old commercial vehicles, compliance of tightened emission standards and
improvement in fuel quality by completely phasing out leaded petrol, and introduction to low Sulfur
diesel. However, despite all of these measures taken, the problem still persists, and there is a large and
excessive need for studies and analyses, to understand the problem at a deeper level, and with those
results, a more practical approach can be strategized. Hence, our paper analyses the different types of
pollutants emitting from distinct vehicles, at different periods of time, and gives an overall view of the
most current situation in this region.
      Timely differences in vehicle emissions are influenced by many inter-mixing factors in the real
world. Post tailpipe emission the particles go through a change as they come into the contact with
atmosphere, as observed when we see two times the increase in emission factors from summer
to winter [1]. Taking cost-effectiveness into account is one of the major things when it comes to
implementing policies for the reduction of vehicular emissions. It was seen that implementing a policy
of limited driving was less cost-effective than a policy of elimination of old cars [2]. Pollutants such as
SO2 , HC, CO2 , CO and PM are emitted by vehicles in very high quantities [3]. Detailed specifications of
the compound of gases where the particles are studied at different stages, such as cooling, equilibrating
to current conditions, are needed for the evaluation of vehicular emissions [4–6]. Usually, the estimation
of vehicular and engine emissions is done by using a chassis dynamometer and engine, but these
are costly and require quite a high amount without the representation of real-life emissions [6].
Tunnel studies and remote sensing aptly represent the road fleet emissions, but traffic flow, road
conditions and technology lead to varying real-life emissions [7,8].
      Certain studies have been conducted for the evaluation of pollutant emission from Particulate
Matter and gaseous pollutants [9].However, mostly, these evaluations are carried out for a few specific
developing countries only. Intergovernmental Panel on Climate Change (IPCC) (2007) states that
activity data and emission profiles from a regional source are required for the calculation of tier-two
emissions. A large dataset is required for the refined estimation of emission from the road transport
sector, while encompassing the effects of all the region-specific variables.
      The indoor air quality has been measured by the emission evolution of specific indoor sources.
This procedure included three typical activities, namely cooking style, biofuels and different levels of
toasting bread [10]. In another study [11], three different models were integrated into a hybrid model
for the prediction of vehicular emission, at a specific location and time, in Malaysia. A method has
been proposed for emission estimation and energy consumption based on the condition of vehicles in
different regions such as Spain, Malaysia and Colombia [12]. In another study, the author discussed the
delay issues and time complexity on the internet of vehicles [13]. The prediction of boiler performance
in terms of mass flow rate and the temperature was performed by using Artificial Neural Networks
(ANNs) [14,15].
      An inventory was performed for the Bangaluru region at a grid resolution of 1 km [16]. Another study
provides the PM10 and PM2.5 concentration data for a populated region in Erongo [17]. The properties
of SO2 adsorption have been explored and evaluated [18]. Another study investigated the combustion
and emission characteristics of diesel engines [19].
      Strict vehicle emission regulations make sure that vehicles are efficient during their operation [20].
For major vehicle categories, the emission limits from the late 1990s are given by Euro Path; in 2000,
2004 and 2007, they were given by National-1, N-2 and N-3 standards. However, while implementing
N-3 standards, it has been observed that the vehicle degradation occurs as the vehicle emission factors
reach their highest values (Zhang et al., 2008). Hence, it was seen that, only after enforcing the N-4
standards, the pollutant emission factor was decreased [20]. Findings from the American Environment
Protection Agency showed that NOx emission was decreased by 5%, HC emission was decreased
by 7% and CO emission was decreased by 8% when the Sulfur (S) content in fuel was decreased to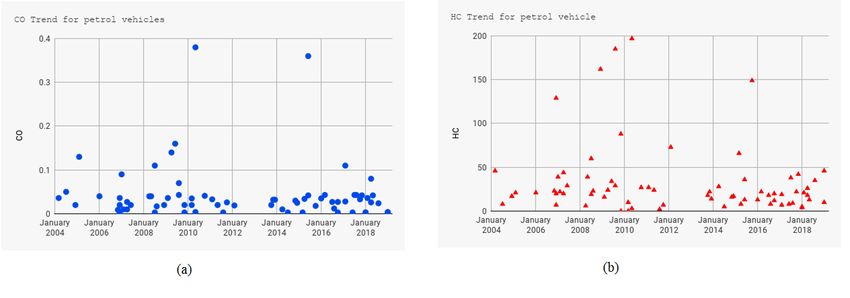
Sustainability 2020, 12, 6707                                                                       4 of 22

49 mg/kg, which was almost similar to the N-4 fuel standard from 327 mg/kg, which was similar to
N-3 fuel standard.
      In Delhi, the road traffic increased from 128 to 191 vehicles per kilometer in the time frame from
2003 to 2009 [21]. Due to this, the availability of road space in Delhi increased by 678 lane kilometers
between 2003 and 2009. In Delhi, the average annual rate of the vehicle population growth is about
9.150% for commercial and 7.40% for private vehicles. Annual growth in the vehicle population is
causing severe environmental problems in Delhi [22]. Delhi occupies the fifth position when it comes
to the worst traffic congestion/jams in a major city. Various models, like Spreadsheet, Long-Range
Energy Alternative Planning (LEAP) and Vehicle Air Pollution Information System (VAPIS), do not
take into consideration many distinguishing factors in the local environment, such as management of
traffic and behavior of the driver; along with this, there is also an assumption that vehicles having
lower speed increase the pollutant emission. Considering the above discussion, an IVE model which
has been applied in various major cities all over the world, including cities such as Shanghai and
Beijing in China, can be used for emission estimations [23]. For differently fueled vehicles, features
such as meteorological variables, emission factors and different modes of driving are being used in this
model, with further related studies in References [24–54].
      The study by Reference [55] concentrated on the analysis of CO2 emission for five NMI subsectors.
Authors have studied the CO2 emission for the time period of 30 years, from 2010 to 2030. In another
study, authors have estimated the environmental technical efficiency and shadow prices for SO2
emissions of China’s provinces, from 2001 to 2013 [56]. Authors have highlighted the incompatibility
in Carbon neutrality assumptions, system boundaries, methodologies and functional units in LCA
studies of paper and pulp making [57]. An analysis has also been carried out which measures the effect
of acceleration and speed on the emission of HC, CO and NOX in four-stroke motorcycle exhaust [58].
Another study has discussed the prospect of ethanol as an effective substitute for gasoline and also
analyzed its effect on the emissive behavior of SI engines [59].
      Some initiatives have been already taken to curb or reduce vehicular pollution: public awareness
campaigns, registration of only those first-sale four-wheeled petrol-driven vehicles which have
catalytic converters installed, the expansion of the rapid public transport system, the phasing out of
old commercial vehicles, the compliance of tightened emission standards and improvement in fuel
quality by completely phasing out leaded petrol and introduction of low Sulfur diesel. However,
despite all of these measures taken, the problem still persists as a large and excessive need to study
this situation, and analyses are required to understand the problem at a deeper level; with those
results, a more practical approach can be strategized. This study shows that few parameters need to
be a concern for reducing the pollutants emission by vehicles. These major parameters are the high
survival rates, decrease in annual mileage and major enforcement for three-to-five-years-old vehicles.
This study shows that many old vehicles are used in different regions after the many notifications
regarding banning old vehicles by the Government of India. These old vehicles are the major source of
vehicle pollutants.
      The urbanization in Delhi NCR has led to a rapid increase in the vehicle count with respect to the
rise in population and mobilization. The emissions from the vehicles are currently counted amongst
the main sources of air pollution in Delhi, and this affects the quality of air. The emission criterion of
various pollutants that are emitted from vehicles is evaluated through various international models
that include the different vehicles, their driving modes, pollutants emitted and other meteorological
factors. The estimated emissions of pollutants such Carbon Monoxide (CO) and Particulate Matter
(PM) from different types of vehicles and different fuel types have undergone diurnal variation over
the years, depending upon the time of the day. This paper makes an attempt to study and analyze the
pollutants by the emission of gases by vehicles which emit from them. The various facts and data were
calculated and analyzed with reference to the standard values set by the national schemes of pollution
and the environment. Based on this statistical data obtained and analyzed, the scenarios regarding
future vehicle growth rate and its impact on air quality are mentioned, to overcome emission problems.
Sustainability 2020, 12, 6707 5 of 22
Therefore, it is important to develop and deploy methods for obtaining real-world measurements of
vehicle emissions, to estimate the pollutants. The comprehensive review reveals whether the moving
vehicles create a significant impact on air quality on specific locations or not.
The significant contribution of this paper is its presentation of the gaseous pollutants (Hydrocarbons
(HC), Carbon Monoxides (CO) and Carbon Dioxide (CO2 )) emission factor of 181 four-wheeler cars
from different companies and of different types of fuels. Based on this statistical data obtained and
analyzed, the scenarios regarding future vehicle growth rate and its impact on air quality are mentioned,
to overcome emission problems. This study shows that many old vehicles are used in different regions,
even after the many notifications regarding banning old vehicles by the Government of India. These old
vehicles are the major source of vehicle pollutants. The unauthorized installation of compressed natural
gas (CNG) kits also has to be banned strictly. Secondly, technological advancement not only targets fuel
efficiency but also targets the reduction of CO, CO2 and HC. It will be helpful to pollution-monitoring
authorities for making new and effective policies against the emission of pollutants by vehicles.
The paper is organized as follows: The methodology is discussed in Section 2, which includes the
quantification of emissions, studied area, experimental setup and data collection; Section 3 presents
the result analysis; and, finally, the study is concluded in Section 4.
2. Methodology
2.1. Quantification of Emissions
The estimation of the emissions from the on-road vehicles is done on the basis of a number of vehicles
and distance traveled in a particular year per different vehicle. This can be expressed as follows:
X
Ei = (Vehj × Dj) × Eijkm (1)
where Ei = emission of compound (i); Vehj = number of vehicles per type (j); Dj = distance traveled
in a year per different vehicle type (j); and Ei,j, and km = emission of compound (i) from bottom-up
approach [60] were taken into account so as to estimate gaseous and particulate emission based on
annual average utilization for a different vehicle category, number of registered vehicles and the
corresponding emission factors vehicle type (j) per driven kilometer. Annual utilization of cars and
jeeps and taxi were assumed to be 33,500, 12,600 and 12,600 km, respectively. These values were taken
on the basis of five-year planning reports of India. For other sections of vehicles, annual utilization
was calculated by taking the average of all the above values. The CO2 emission [61] is estimated by
using the value of the consumption of fuel [24,62] and emission factor, as follows:
X
Ei = (Fuelj, k × EFi, j) (2)
where Ei = emission of compound (i); Fuel j,k = consumption of fuel (j) for transport type (k);
and EFi,j= emission factor for compound (i) emitted from fuel (j).
Emissions of CO and HC were estimated by using the following equation:
TJ kg
Emissions (kt) = Fuel Consumption (kt) × NCV Kt × Gas Specific Emission Co − efficients TJ (3)
Stoichiometric air–fuel ratio and equivalence air–fuel ratio or Lambda(λ) are the important
parameters for the analysis of pollution emitted by vehicles. To understand the Stoichiometric air–fuel
ratio, we need to look at the fuel combustion process. It is a process in which the mixture of fuel and
water produces water, heat and Carbon Dioxide. Activation energy is also required for the occurrence
of such an oxidation reaction.
Spark (SI)
Fuel + Oxygen → (Activation Energy) → CO2 + H2 O + Energy
HighTemperature (CI)Sustainability 2020, 12, 6707 6 of 22
With the help of Stoichiometric air–fuel ratio, the value of Lambda can be calculated by using the
following equation:
AFRactual
Lambda (λ) = (4)
AFRideal
Hence, the Lambda factor can be calculated by using the actual and ideal value of air–fuel ratio.
2.2. Locations
The most appropriate region chosen for the analysis of vehicular emission and its pollutants is the
Delhi Northern Central Region. Delhi, a vast metropolitan area in the northern part of the country,
is India’s capital territory as shown in Figure 1. The city covers the area of 1484 square kilometers
(573 sq. mi) bordered by Haryana and Uttar Pradesh. The urban area of Delhi extends afar from the
national capital territory border. The National Capital Region (NCR) consists of cities like Gurgaon,
Noida, Ghaziabad and Faridabad. The National Capital Region (NCR) also includes Delhi, which is
considered to be an“interstate regional planning” area by the National Capital Region Planning Board
Act of 1985. A survey conducted by the World Health Organization (WHO) in 2014 shows that Delhi
was the most polluted city in the world. Delhi was downgraded to the eleventh-worst city in the urban
air-quality database in 2016. The air quality of Delhi is usually Moderate (101–200) level between
January to September, and then it becomes Very Poor (301–400), Severe (401–500) or Hazardous (500+)
between October and December. There is such deterioration in air quality due to various factors like
stubble burning, firecrackers burning during festivals like Diwali and cold weather. The levels of
Particulate Matter (PM) in Delhi have increased by about 44%, mainly due to high industrial and
vehicular emissions, construction work and crop burning in neighboring states. The level of airborne
Particulate Matter is also very high, that is, around PM 2.5, which is considered as most harmful to
health. Increasing levels of vehicular pollution have consequently caused diseases such as asthma
and lung cancer amongst the population of Delhi. The dense smog results in major air and rail traffic
disruptions every year, during the winter season. The Indian meteorologists lately stated that the
average peak temperature during winters has decreased in Delhi since 1998 due to rising vehicular
emissions and, hence, the air pollution. Some measures have been taken to overcome air pollution in
Delhi. Delhi has been ranked third amongst the other Indian cities in the count of trees. The world’s
largest fleet of eco-friendly compressed natural gas (CNG) buses is controlled by Transport Cooperation
of Delhi. The CSE began public interest litigation that ordered the Delhi’s transport system to switch on
CNG and not to use the leaded petrol in 1998. The Department of Energy of the United States declared
Delhi as its first “Clean Cities International Partner of the Year” in 2003 for its efforts to overcome air
pollution by choosing eco-friendly fuel initiatives. The air pollutants in the city are also reduced by
choosing Delhi metro cooperation as the main transport source in the city.
Therefore, as per various studies, many of the gains are lost. There’s a significant decrement in
bus ridership due to an increment in the market share of diesel cars. The city remains assessed at basic
sustainability due to the Carbon emissions of its poorer neighborhoods.Sustainability 2020, 12, 6707 7 of 22
Sustainability 2020, 12, x FOR PEER REVIEW 7 of 24
Figure 1. Selected
Figure 1. Selectedarea
areaforfor on-road
on-road emission
emission estimation
estimation in Delhi
in Delhi National
National Capital
Capital RegionRegion
(NCR). (NCR).
Source:
Source: https://www.sketchbubble.com/en/presentation-delhi-map.html.
https://www.sketchbubble.com/en/presentation-delhi-map.html.
2.3. Experimental
Therefore, asSetup
per various studies, many of the gains are lost. There’s a significant decrement in
bus ridership
In this section,towe
due andiscuss
increment in the
the test market used
procedure shareforof analyzer
diesel cars. The city
gasses. Some remains assessed at
of the compulsory
basic sustainability due to the Carbon emissions of its poorer neighborhoods.
steps needed to be performed for the analysis of gas. For the gas analyzer, as per the specifications of
the fabricator, the power supply is checked, and earthing also needs to be proper, in order to perform a
2.3. Experimental Setup
test on vehicles. The electrical calibration should be checked. The availability and the functionality of
Incomponents
all the this section,as weperdiscuss the test need
the fabricator procedure used for With
to be checked. analyzer gasses.
the help Some
of the of the
sample gascompulsory
of suitable
value needed
steps for Carbon to beMonoxide
performed (CO)
for and Hydrocarbons
the analysis of gas. (HC),
For the thegas
span and zero
analyzer, as calibrations are checked.
per the specifications of
the also
We fabricator,
need tothe power
check supply
if the is checked,
sampling systemand earthing also
is leak-proof needs
or not. to beitproper,in
Finally, is checked order
if thetoprinter
perform is
working efficientlyThe
a test on vehicles. andelectrical
the print-out information
calibration shouldisbe correct.
checked. The availability and the functionality
of allWe
thealso
components
discuss theastest perprocedure
the fabricatorused need to be meters.
for smoke checked. Withofthe
Some the help of thesteps
necessary sample gas of
needed to
suitable
be carried value
out on forsmoke
Carbon Monoxide
meters. (CO) and
It is checked thatHydrocarbons
if the calibration (HC), themeter
of the spanisand zeroand
at zero calibrations
midscale
are checked.
point while the Weneutral
also need to check
density filter if
is the sampling
available, aftersystem is leak-proof
the warm-up of the or not. The
meter. Finally,
idealitvalue
is checked
must
if
liethe printer
within 0.1 is −1 . The components,
mworking efficiently and suchtheasprint-out
the sample information is correct.
hose, internal pipes, etc., are checked if they
We also discuss
are deteriorated or havethedamages,
test procedure
to ensureused thatforthere
smoke aremeters. SomeThe
no leakages. of the necessary of
functionality steps
the needed
heating
to be carried
system for theout on smoke
optical chamber meters. It is checked
is checked. The purge that air
if the calibration
system and visualof the meter should
displays is at zero alsoand
be
midscale
checked, to point
see while
if theytheareneutral
working density filterThe
correctly. is available,
functioning after
of the warm-up of the and
oil temperature meter. The ideal
Revolutions
value must (RPM)
Per Minute lie within 0.1 m
sensor −1. needs
also The components,
to be checked. suchFinally,
as the itsample hose,ifinternal
is checked pipes,
the printer etc., are
is working
checked
efficientlyifand
theytheareprintdeteriorated
out information or have damages,
is correct, and the to instrument
ensure thatcasing thereshould
are no be leakages.
proper, with Thea
functionality
proper of the
electrical heating system for the optical chamber is checked. The purge air system and
earthling.
visual displays
The should
prescribed also be checked,
standard for differentto see if they are
fuel-type working
vehicles correctly.
consists Theappropriate
of the functioningvaluesof the oil
of
temperature
Carbon monoxide and Revolutions Per Minute
(CO), Hydrocarbon (HC) (RPM) sensor also
and Lambda needs
in the to be checked.
different Bharat stageFinally,
norms it isaschecked
shown
if
inthe printer
Table is working
1. Here, CO andefficiently
HC have and the print
emitted out information
pollutants, and Lambda is correct,
indicatesandthetheoptimum
instrument casing
condition
should
neededbe forproper,
the properwithfunctioning
a proper electrical earthling.
of catalytic converters. The estimation of the pollutants emitted
The
is also prescribed
based standard for
on the prescribed differentSmoke
Hartridge fuel-type Unitvehicles
(HSU) and consists of the HSU.
measured appropriate values of
HSU (Hartridge
Carbon monoxide (CO), Hydrocarbon (HC) and Lambda in the different Bharat stage norms as
shown in Table 1. Here, CO and HC have emitted pollutants, and Lambda indicates the optimumSustainability 2020, 12, 6707 8 of 22
Smoke Unit) is a unit of measurement used to measure the capacity of exhaust gases of emissions,
especially in diesel engines. The HSU limit for pre-Bharat Stage 4 norms was 65. The prescribed values
for petrol vehicles consisting of pollutants and Lambda are stated as follows:
Prescribed Standard for Petrol Vehicles in Bharat Stage 4 norms:
Carbon Monoxide (CO): −0.3 ppm.
Hydrocarbon (HC): −200 ppm.
Lambda (λ): Should be in the range of 0.97–1.03.
Prescribed Standard for Petrol Vehicles in Bharat Stage 3 norms:
Carbon Monoxide (CO): −0.5 ppm.
Hydrocarbon (HC): −750 ppm.
Table 1. Air-quality standards for national ambient [24–54].
Concentration in Ambient Air
Time Weighted Ecologically
S. No. Pollutant Industrial,
Average Sensitive Area Methods of
Residential, Rural
(Notified by Central Measurement
and Other Areas
Government)
(1) (2) (3) (4) (5) (6)
Sulfur Dioxide(SO2 ), Annual * 50 20 Improved West and Gaeke
1
µg/m3 24 h ** 80 80 Ultraviolet Fluorescence
Modified Jacob and
Nitrogen Annual * 40 30
2 Hochheiser (Na-Arsenite)
Dioxide(NO2 ), µg/m3 24 h ** 80 80
Chemiluminescence
Particulate Matter(size Gravimetric
Annual* 60 60
3 less than 10µm) or TOEM
24 h ** 100 100
PM10 µg/m3 Beta attenuation
Particulate Matter(size Gravimetric
Annual * 40 40
4 less than 2.5µm) or TOEM
24 h ** 60 60
PM2.5 µg/m3 Beta attenuation
UV Photometric
8 h ** 100 100
5 Ozone(O3 ) µg/m3 Chemiluminescence
1 h ** 180 180
Chemical Method
AAS/ICP method after
Annual * 0.50 0.50 sampling on EPM 2000 or
6 Lead(Pb) µg/m3
24 h ** 1.0 1.0 equivalent filter paper
ED-XRF using Teflon filter
Carbon Monoxide(CO) 8 h ** 0.2 0.2 Non-Dispersive Infrared
7
mg/m3 1 h ** 0.4 0.4 (NDIR) spectroscopy
Ammonia(NH3) Annual * 100 100 Chemiluminescence
8
µg/m3 24 h ** 400 400 Indophenol blue method
* Annual arithmetic mean of minimum 104 measurements in a year, ** 24 hourly monitored values shall be complied
with 98% of the time.
The emission estimation rate for petrol vehicles is evaluated using the prescribed values and the
measured values of various pollutants and other different factors. The values of Carbon Monoxide
(CO), Hydrocarbon (HC) and Carbon Dioxide (CO2 ) ppm. These measured values are then compared
with the prescribed values based on various factors such as Bharat Stage norms, Manufacturer of the
vehicle, Model of the vehicle, Year of Registration of the vehicle.
Similar to the emission evaluation of petrol vehicles is the emission estimation of petrol/CNG
fuel type vehicles. It consists of the estimation of emission of pollutants from petrol/CNG vehicles by
collecting the appropriate values of pollutants emitted with reference to the prescribed values as per
the Bharat Stage norms. Here, we consider the prescribed standards of the petrol fuel type vehicles
in Bharat Stage Norm 3 and Norm 4. Moreover for the CNG/petrol fuel type vehicles, the Carbon
Monoxide (CO) and Hydrocarbon (HC) are considered only (in ppm) and not Carbon Dioxide and
Lambda. The values of CO and HC are measured from vehicles which are then compared with the
prescribed values of the petrol type vehicles based on various factors such as Bharat Stage norms,
Manufacturer of the vehicle, Model of the vehicle, Year of Registration of the vehicle.Sustainability 2020, 12, 6707 9 of 22
The estimation of the emission of various pollutants in diesel type vehicles is done by comparing
the prescribed and measured values of HSU. HSU is the unit of estimation to evaluate the capacity of
exhaust gases of emissions in diesel engines. HSU stands for Hartridge Smoke Unit. The prescribed
standard of HSU (Hartridge Smoke Unit) for diesel vehicles in Bharat Stage 3 norm and Bharat
Stage 4 norm is 65 and 50, respectively. The HSU values of different diesel vehicles are collected.
The comparison is then made between diesel vehicles with respect to different comparable factors,
such as Bharat stage norms, a manufacturer of the vehicle, vehicle model number, year of registration
of the vehicle, prescribed values of HSU and measured values of HSU.
2.4. Data Collection
The following data were collected from pollution certificate centers of Delhi NCR. A total
data of 181 vehicles were used and analyzed collectively, to reach the following outcomes. Table 2
showcases the characteristics of the different vehicles which were analyzed by displaying varying
vehicle maker/companies having different models and registration dates. It also shows the varying
or similar engine capacities between two fuel types (diesel and petrol) from different vehicle models.
Engine capacity of a vehicle simply depicts the area in which any engine’s pistons work/operate; hence,
a larger amount of fuel and air is being processed when a vehicle is moving with a larger engine
capacity. The average engine capacity calculated from the given table is 1778 cm3 (approximately) for
diesel engines and 1295 cm3 (approximately) for petrol engines; hence, we can observe that vehicles
having a diesel engine have a larger engine capacity, on average, than vehicles having a petrol engine,
meaning that it is processing more fuel than its counterpart. A major difference between diesel and
petrol engines is that the diesel engine uses more air and less fuel than the petrol engine to operate
at the same level, hence emitting less CO2 despite having a larger concentration of Carbon in it than
petrol. The analysis stated that the diesel engine would emit less CO2 /km than a petrol engine if having
an almost-similar engine capacity.
Table 2. Characteristics of selected cars [24–54].
Maker/Company Model Registration Date Fuel Type Engine Capacity (cm3 ) *
Toyota Innova 2009 Diesel 2494
Toyota Fortuner 2010 Diesel 2982
Toyota Altis 2014 Diesel 1364
Maruti Suzuki Dzire 2009 Diesel 1248
Maruti Suzuki Sx4 2011 Diesel 1248
Maruti Suzuki Swift 2012 Diesel 1248
Maruti Suzuki Ciaz 2015 Diesel 1248
Maruti Suzuki Ritz 2016 Diesel 1248
Honda Amaze 2014 Diesel 1498
Honda Mobilio 2015 Diesel 1498
Honda City 2018 Diesel 1498
Mahindra Scorpio 2010 Diesel 2179
Mahindra XUV 2014 Diesel 2179
Mahindra Thar 2017 Diesel 2523
BMW X1 2011 Diesel 1995
BMW 520D 2013 Diesel 1995
Maruti Suzuki Zen 2004 Petrol 993
Maruti Suzuki Wagonr 2005 Petrol 1061
Maruti Suzuki Alto 2006 Petrol 796
Maruti Suzuki Esteem 2007 Petrol 1298
Maruti Suzuki Ritz 2009 Petrol 1197
Maruti Suzuki Swift 2010 Petrol 1298
Maruti Suzuki EECO 2011 Petrol 1196
Maruti Suzuki Ertiga 2013 Petrol 1373
Maruti Suzuki Dzire 2014 Petrol 1197Sustainability 2020, 12, 6707 10 of 22
Table 2. Cont.
Maker/Company Model Registration Date Fuel Type Engine Capacity (cm3 ) *
Maruti Suzuki Ciaz 2015 Petrol 1373
Maruti Suzuki Celerio 2017 Petrol 998
Maruti Suzuki Ignis 2018 Petrol 1197
Hyundai Santro 2006 Petrol 1086
Hyundai I10 2009 Petrol 1086
Hyundai EON 2013 Petrol 814
Hyundai Xcent 2015 Petrol 1186
Hyundai Creta 2017 Petrol 1591
Hyundai Grand i10 2018 Petrol 1197
Honda Accord 2006 Petrol 2354
Honda Civic 2007 Petrol 1799
Honda City 2009 Petrol 1497
Honda Amaze 2013 Petrol 1198
Toyota Innova 2010 Petrol 1998
Toyota Etios 2014 Petrol 1496
Tata Indica 2007 Petrol 1193
Tata Tiago 2016 Petrol 1199
* Inventory shows the characteristics for petrol and diesel cars registered in 2004–2019. Engine capacity also affects
the environment, as high-capacity engines emit high amounts of pollutants in the air.
Tables 3–5 display the value/level of pollutants emitted by each vehicle, with its prescribed value.
It also shows the Bharat stage norms each car is following, and their registration dates are in the
chronological order.
Table 3. Measured Hartridge Smoke Unit (HSU) values for diesel vehicles [24–54].
S No. Bharat Stage Maker/Model Registration Date Prescribed HSU Measured HSU
1 3 Toyota/Innova June 2009 65 42.21.27
2 3 Toyota/Innova July 2009 65 45.41.41
3 3 Maruti Suzuki/Dzire Sept 2009 65 44.31.36
4 3 Mahindra/Scorpio Jan 2010 65 31.70.89
5 3 Toyota/Innova Jan 2010 65 39.81.18
6 3 Toyota/Fortuner May 2010 65 39.81.18
7 4 Toyota/Innova Oct 2011 50 42.51.29
8 4 BMW X1 July 2011 50 39.91.07
9 4 Maruti Suzuki/Swift Sept 2011 50 42.51.28
10 4 Hyundai/Verna Feb 2012 50 42.71.29
11 4 Maruti Suzuki/Sx4 Aug 2012 50 38.61.13
12 4 Maruti Suzuki/Dzire July 2013 50 39.21.15
13 4 BMW 520D Aug 2013 50 38.31.12
14 4 Volkswagen/Vento Oct 2013 50 40.01.19
15 4 Ford/ EcoSport Nov 2013 50 44.61.37
16 4 Volvo/XC60 Jan 2014 50 41.41.24
17 4 Maruti Suzuki/Sx4 Feb 2014 50 44.01.35
18 4 Mahindra/XUV April 2014 50 38.81.14
19 4 Toyota/Etios July 2014 50 43.01.30
20 4 Maruti Suzuki/Swift Aug 2014 50 41.51.24
21 4 Toyota/Altis Sept 2014 50 43.81.34
22 3 TATA/Indigo Oct 2014 65 46.01.43
23 1 Audi/A6 Oct 2014 65 42.11.27
24 4 Honda/Amaze Nov 2014 50 31.50.88
25 4 Toyota/Etios March 2015 50 42.31.28
26 4 BMW March 2015 50 39.91.18
27 4 Honda/Mobilio April 2015 50 37.71.10
28 4 Renault/Duster June 2015 50 39.21.15
29 4 Maruti Suzuki/Swift July 2015 50 39.81.18
30 4 Mahindra/Scorpio July 2015 50 44.61.37Sustainability 2020, 12, 6707 11 of 22
Table 3. Cont.
S No. Bharat Stage Maker/Model Registration Date Prescribed HSU Measured HSU
31 4 Hyundai/Creta Aug 2015 50 41.21.39
32 4 Mercedes Ml250 Aug 2015 50 31.50.88
33 4 Maruti Suzuki/Ciaz Sept 2015 50 30.90.86
34 4 Mahindra/XUV Sept 2015 50 39.41.16
35 4 Toyota/Fortuner Nov 2015 50 42.41.28
36 4 Maruti Suzuki/Dzire Dec 2015 50 43.41.33
37 4 Hyundai/Creta June 2016 50 43.51.33
38 4 Honda/Mobilio July 2016 50 37.91.10
39 4 Maruti Suzuki/Ritz July 2016 50 43.91.34
40 4 FCA/Aventura Aug 2016 50 38.21.12
41 4 Maruti Suzuki/Ciaz Nov 2016 50 41.31.24
42 3 Toyota/Innova Dec 2016 65 38.91.14
43 4 Toyota/Innova Jan 2017 50 42.61.29
44 4 Maruti Suzuki/Dzire Feb 2017 50 44.21.36
45 4 Honda/City March 2017 50 39.11.15
46 4 Mahindra/THAR May 2017 50 44.71.37
47 4 Maruti Suzuki/Ciaz June 2017 50 39.01.15
48 4 Toyota/Innova Dec 2017 50 40.01.19
49 4 Honda/Amaze Dec 2017 50 39.31.16
50 4 Ford/Endeavour Jan 2018 50 39.01.15
51 4 Maruti Suzuki/Ciaz Sept 2018 50 43.11.31
52 4 Honda/City Nov 2018 50 42.11.27
Table 4. Measurement of CO, CO2 and λ for petrol vehicles [24–54].
S No. Bharat Stage Maker/Model Registration Date CO (ppm) HC (ppm) CO2 (ppm) Λ
1 3 Maruti/M800 March 2004 0.036 46
2 3 Maruti Suzuki/Zen July 2004 0.050 8
3 3 Maruti Suzuki/Versa Sept 2004 0.036 11
4 3 Maruti Suzuki/Zen Dec 2004 0.020 17
5 3 Maruti Suzuki/Wagonr Feb 2005 0.130 21
6 3 Hyundai/Santro Jan 2006 0.040 21
7 3 Maruti/Maruti Nov 2006 0.009 23
8 3 Honda/Accord Dec 2006 0.003 7
9 3 Maruti Suzuki/Alto Dec 2006 0.036 20
10 3 Maruti Suzuki/Wagonr Dec 2006 0.020 129
11 3 Hyundai/Santro Jan 2007 0.090 39
12 3 Honda/City Feb 2007 0.010 22
13 3 Maruti/Maruti April 2007 0.027 44
14 3 TATA/Indica April 2007 0.010 20
15 3 Honda/Civic June 2007 0.020 29
16 3 Honda/City Sept 2007 0.001 75
17 3 Maruti Suzuki/ Esteem Sept 2007 0.100 107 Pre-Bharat Stage 4 norms *
18 3 Maruti Suzuki/Alto April 2008 0.040 6
19 3 Hyundai/Santro May 2008 0.040 39
20 3 Maruti Suzuki/Zen July 2008 0.003 19
21 3 Hyundai/Santro July 2008 0.110 60
22 3 Honda/Accord Aug 2008 0.017 23
23 3 Honda/City Dec 2008 0.020 162
24 3 Maruti Suzuki/Wagonr Feb 2009 0.036 16
25 3 Hyundai/i10 April 2009 0.140 24
26 3 Maruti Suzuki/Swift June 2009 0.160 34
27 3 Maruti Suzuki/Alto Aug 2009 0.070 185
28 3 Hyundai/i10 Sept 2009 0.100 17
29 3 Ford/IKON Sept 2009 0.020 25
30 3 Hyundai/i10 Sept 2009 0.110 31
31 3 Honda/City Aug 2009 0.043 29
32 3 Maruti Suzuki/Ritz Nov 2009 0.020 0
33 3 Hyundai/i10 Nov 2009 0.003 88
34 3 Maruti Suzuki/Swift March 2010 0.020 0
35 4 Hyundai/i10 March 2010 0.035 10 17.20 0.999
36 3 Maruti Suzuki/Wagonr May 2010 0.380 197
37 4 Toyota/Innova May 2010 0.004 3 15.4 1.005
38 4 Maruti Suzuki/Dzire Oct 2010 0.041 27 17.20 1.003
39 4 Maruti Suzuki/EECO Feb 2011 0.033 27 16.70 1.009
40 4 Maruti Suzuki/AStar May 2011 0.020 24 17.30 1.003Sustainability 2020, 12, 6707 12 of 22
Table 4. Cont.
S No. Bharat Stage Maker/Model Registration Date CO (ppm) HC (ppm) CO2 (ppm) Λ
41 4 Mitsubishi/Outlander Aug 2011 0.003 2 17.10 1.004
42 4 Maruti Suzuki/Dzire Oct 2011 0.026 7 16.80 1.009
43 4 Volkswagen/Polo Feb 2012 0.019 73 16.70 1.000
44 4 Maruti Suzuki/Wagonr Sept 2013 0.034 26 16.80 1.000
45 4 Maruti Suzuki/Ertiga Oct 2013 0.020 18 16.60 1.003
46 4 Honda/Amaze Nov 2013 0.032 22 15.70 1.001
47 4 Hyundai/EON Dec 2013 0.032 14 15.70 1.003
48 4 Hyundai/Verna April 2014 0.010 28 17 1.007
49 4 Maruti Suzuki/Dzire July 2014 0.003 5 15.30 1.009
50 4 Maruti Suzuki/Ciaz Nov 2014 0.030 16 16.70 0.998
51 4 Toyota/Etios Dec 2014 0.025 17 17.10 1.003
52 4 Ford/Eco March 2015 0.003 66 16.60 1.011
53 4 Honda/Amaze April 2015 0.034 8 17.10 1.004
54 4 Maruti Suzuki/Ciaz June 2015 0.36 36 17 1.001
55 4 Honda/City June 2015 0.042 13 16.60 1.002
56 3 Hyundai/Xcent Oct 2015 0.018 149
57 4 Maruti Suzuki/Dzire Jan 2016 0.035 13 15.50 1.003
58 3 Honda/Amaze March 2016 0.043 22
59 4 Maruti Suzuki/Swift July 2016 0.027 18 16.90 1.003
60 4 Renault/Kwid Aug 2016 0.012 8 15.40 1.003
61 4 TATA/Tiago Oct 2016 0.027 12 16.80 1.004
62 4 Honda/City Oct 2016 0.003 20 16.90 1.002
63 4 Honda/City Feb 2017 0.11 7 16.90 1.004
64 4 Hyundai/Grand i10 Feb 2017 0.028 19 17 1.003
65 4 Maruti Suzuki/Swift June 2017 0.003 8 17.30 1.003
66 4 Maruti Suzuki/Dzire July 2017 0.043 38 17.30 1.002
67 4 Hyundai/Creta Aug 2017 0.043 9 16.80 1.004
68 4 Maruti Suzuki/Celerio Oct 2017 0.033 22 17 1.003
69 4 Maruti Suzuki/EECO Sept 2017 0.017 24 16.50 1.029
70 4 Maruti Suzuki/Dzire Nov 2017 0.042 42 16.90 1.002
71 4 Renault/Kwid Jan 2018 0.003 5 16 1.003
72 4 Maruti Suzuki/Dzire Jan2018 0.003 4 17.10 1.003
73 4 Maruti Suzuki/Ertiga Feb 2018 0.036 21 16.4 1.003
74 3 Hyundai/ Grand i10 April 2018 0.080 26
75 4 Maruti Suzuki/Dzire April 2018 0.026 18 16.6 1.003
76 4 Maruti Suzuki/Ignis May 2018 0.042 13 15.7 1.002
77 4 Maruti Suzuki/Ignis Aug 2018 0.024 35 17 1.003
78 4 TATA/Tiago Jan 2019 0.004 46 17 1.001
79 4 Maruti Suzuki/EECO Jan 2019 0.002 10 12.9 1.004
* Pre-Bharat Stage 4 norms cars do not have the CO2 and λ values.
Table 5. Petrol/compressed natural gas (CNG) vehicles [24–54].
S No. Bharat Stage Maker/Model Registration Date CO (ppm) HC (ppm)
1 3 Honda/City Dec 2004 0.026 10
2 3 Honda/City Jan 2005 0.170 9
3 3 Maruti Suzuki/Wagonr March 2005 0.050 34
4 3 Maruti Suzuki/Esteem March 2005 0.020 7
5 3 Maruti Suzuki/Esteem Oct 2005 0.034 7
6 3 Ford/Ikon Feb 2007 0.310 35
7 3 Maruti Suzuki/Esteem Oct 2007 0.020 12
8 3 Maruti Suzuki/Esteem Dec 2007 0.020 16
9 3 Maruti Suzuki/Swift March 2008 0.100 9
10 3 Maruti Suzuki/Alto April 2008 0.020 0
11 3 Maruti Suzuki/Wagonr May 2008 0.040 9
12 3 Maruti Suzuki/Wagonr May 2008 0.020 3
13 3 Maruti Suzuki/Wagonr Aug 2008 0.010 14
14 3 Maruti Suzuki/Omni Aug 2008 0.001 5
15 3 Hyundai/Santro Oct 2008 0.016 4
16 3 Toyota/Altis December 2008 0.040 27
17 3 Chevrolet/Aveo Feb 2009 0.010 6
18 3 Hyundai/Accent April 2009 0.040 7
19 3 Maruti Suzuki May 2009 0.004 8
20 3 Maruti Suzuki/Alto May 2009 0.100 44Sustainability 2020, 12, 6707 13 of 22
Table 5. Cont.
S No. Bharat Stage Maker/Model Registration Date CO (ppm) HC (ppm)
21 3 Hyundai/i10 Nov 2009 0.050 0
22 3 Maruti Suzuki/Wagonr Sept 2009 0.041 9
23 3 Maruti Suzuki/Sx4 March 2010 0.040 7
24 3 Maruti Suzuki/Sx4 March 2010 0.040 16
25 3 Maruti Suzuki/Dzire May2010 0.001 31
26 4 Maruti Suzuki/Swift Sept 2010 0.003 132
27 4 Maruti Suzuki April 2011 0.027 77
28 4 Maruti Suzuki/EECO June 2011 0.019 18
29 4 Hyundai/i20 July 2011 0.010 93
30 4 Hyundai/Santro Oct 2011 0.030 19
31 4 Maruti Suzuki/Wagonr Nov 2011 0.040 18
32 4 Maruti Suzuki/Alto Aug 2012 0.004 58
33 4 Maruti Suzuki/Alto Dec 2012 0.027 42
34 4 Hyundai/i10 June 2013 0.018 12
35 4 Maruti Suzuki/Sx4 Oct 2013 0.041 88
36 4 Maruti Suzuki/Wagonr Oct 2013 0.003 85
37 4 Maruti Suzuki/Dzire Nov 2015 0.020 161
38 4 Maruti Suzuki/Dzire Dec 2015 0.010 7
39 4 Maruti Suzuki/EECO Jan 2016 0.030 29
40 4 Honda/Amaze Jan 2016 0.028 69
41 4 Maruti Suzuki/Wagonr April 2016 0.043 62
42 4 Hyundai/Xcent Feb 2017 0.027 128
43 4 Maruti Suzuki/EECO March 2017 0.020 22
44 4 Maruti Suzuki/Celerio April 2017 0.027 58
45 4 Maruti Suzuki/Tour Sept 2017 0.050 22
46 4 Maruti Suzuki/Dzire Oct 2017 0.020 41
47 - Bajaj Auto/Compact Oct 2018 0.026 21
48 4 Maruti Suzuki/Tour Nov 2018 0.025 24
49 4 TATA/Truck LPT Jan 2019 0.050 27
50 - Bajaj Auto/Compact Jan 2019 0.001 187
Table 3 displays the value/level for vehicles using diesel as a fuel type. Emission from diesel
vehicles is measured on the basis of HSU (Hartridge Smoke Unit), which is a unit of measurement used
to measure the capacity of exhaust gases during emission. The HSU limit for pre-Bharat Stage 4 norms
was 65, and for Bharat Stage 4 norms, it has been reduced to 50. Some of the major maker/companies
being showcased through the table are Toyota, Maruti Suzuki, Hyundai, Honda, Mahindra, TATA and
some luxury makers. As can be seen from the information mentioned above, we used vehicles from both
indigenous and foreign makers/companies, thus adding another dimension to the analysis. The given
data of HSU range from the value of 30.90.86 to 46.01.43, leading to the conclusion that most of the
diesel vehicles are well below the current prescribed limits of HSU emission, yet the pollution levels are
increasing at an alarming rate. Here we can also conclude that some of the old cars are well maintained
and not emitting a large number of pollutants; it may be because the regular maintenance and service
by car owner. Many old-car owners followed the pollution-under-control norms introduced by the
Government of India. They always adopt new steps for reducing the pollution emission, while driving
their cars. The following are the steps that can be helpful for someone for reducing the maintenance
cost of vehicles, as well as the emission of pollution, too. Everyone needs to keep vehicles well-tuned
and inflate the tires regularly, use biofuels such as CNG for regular derive, kept regular maintenance
and test vehicles every 3 months by nearby installed pollution-under-control-norms center.
Details about the petrol type fuel are presented in Table 4, in which emissions are measured
from three different pollutants which are CO (Carbon Monoxide), HC (Hydrocarbons) and CO2
(Carbon Dioxide). Another parameter that is being measured for petrol driven vehicles is Lambda
(λ), indicating the optimum conditioning needed for the proper functioning of catalytic converters.
The vehicles registered during the pre-Bharat Stage 4 norms are only tested for CO and HC, having a
prescribed limit of 0.5 and 750 ppm. For Bharat Stage 4 norms which were adopted in 2010 theSustainability 2020, 12, 6707 14 of 22
prescribed limit for CO and HC are 0.3 and 200 ppm; Lambda should be in the range of 0.97 to 1.03.
The given data of CO ranges from 0.001 to 0.380 ppm, and for HC, the data range from 0 to 197 ppm.
The given data for both the pollutants have a large range, which shows that there are many parameters
which give any vehicle its emission results, e.g., the distance traveled and the terrain on which the
vehicle has been driven, the maintenance of the vehicle and the maker/company of the vehicle.
Table 5 showcases the details about vehicles that operate/run on petrol/CNG. For such vehicles,
only CO and HC are measured with the same prescribed limit as according to pre-BS4 and BS4 norms;
Lambda (λ), as a parameter, is not measured for such vehicles. In the data collected for petrol/CNG,
the value of CO ranges from 0.001 to 0.310 ppm, and the value of HC ranges from 0 to 187 ppm. We can
also notice that the data for petrol and petrol/CNG driven vehicles almost have the same range.
Tables 6–8 displays the average emissions over different years of HSU for diesel-driven vehicles
and CO, HC and CO2 for petrol and for petrol/CNG-driven vehicles. Calculating the average emission
over different years helps in realizing how a change in technology over the year can affect vehicular
emissions. The average emissions in chronological order for vehicles operating from a diesel engine
are given by Table 6. The average HSU emission is calculated from the year of 2009 to 2018. The lowest
HSU emission average (38.53.36) is calculated from the year 2015, and the highest average (43.31.35) is
calculated from the year 2009. Table 7 displays the average emissions of three pollutants (CO, HC and
CO2 ) for vehicles operating on a petrol engine. The average values of pollutants are calculated from
the year of 2010 to 2019.
Table 6. Average emissions over different years of HSU for diesel-driven vehicles [24–54].
Year HSU HSU HSU HSU
42.21.27 31.70.89 42.51.29
42.71.29
2009 45.41.41 2010 39.81.18 2011 39.91.07 2012
38.61.13
44.31.36 39.81.18 42.51.28
Average * 43.31.35 Average * 36.77.41 Average * 41.64.21 Average * 40.66.21
HSU HSU HSU HSU
42.31.28
39.91.28
41.41.24
37.71.10
44.01.35
39.21.15 43.51.33
38.81.14
39.21.15 39.81.18 37.91.10
43.01.30
38.31.12 44.61.37 43.91.34
2013 2014 41.51.24 2015 2016
40.01.19 41.21.39 38.21.12
43.81.34
44.61.37 31.50.88 41.31.24
46.01.43
30.90.86 38.91.14
42.11.27
39.41.16
31.50.88
42.41.28
43.41.33
Average * 40.29.21 Average * 41.35.35 Average * 38.53.36 Average * 40.63.21
HSU HSU HSU HSU
42.61.29
44.21.36
39.11.15 39.01.15
2017 44.71.37 2018 43.11.31
39.01.15 42.11.27
40.01.19
39.31.16
Average * 41.28.24 Average * 41.08.24
* The average values are calculated by using data collected for diesel cars. * The results demonstrate that the new
advancement in automobile industries is not very concerned about maintaining the HSU level for vehicles.Sustainability 2020, 12, 6707 15 of 22
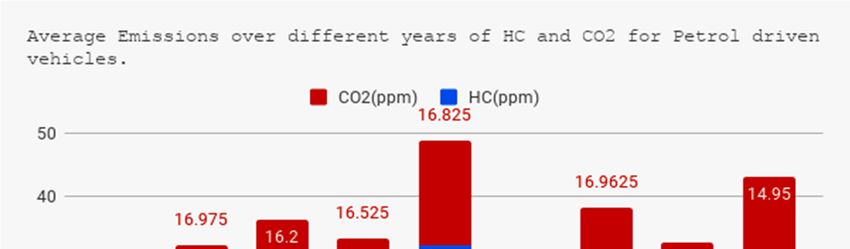
Table 7. Average emissions over different years of CO, HC and CO2 for petrol-driven vehicles [24–54].
Year CO (ppm) HC (ppm) CO2 (ppm) CO (ppm) HC (ppm) CO2 (ppm) CO (ppm) HC (ppm) CO2 (ppm)
0.033 27 16.70 0.034 26 16.80
0.035 10 17.20
0.020 24 17.30 0.020 18 16.60
2010 0.004 3 15.4 2011 2013
0.003 2 17.10 0.032 22 15.70
0.041 27 17.20
0.026 7 16.80 0.032 14 15.70
Average * 0.026 13.33 16.6 Average * 0.0205 15 16.975 Average * 0.0295 20 16.20
0.035 13 15.50
0.010 28 17 0.003 66 16.60
0.027 18 16.90
0.003 5 15.30 0.034 8 17.10
2014 2015 2016 0.012 8 15.40
0.030 16 16.70 0.36 36 17
0.027 12 16.80
0.025 17 17.10 0.042 18 16.60
0.003 20 16.90
Average * 0.017 16.5 16.525 Average * 0.10975 32 16.825 Average * 0.0694 14.20 16.3
0.11 7 16.9
16
0.028 19 17 0.003 5
17.10
0.003 8 17.30 0.003 4
16.40
0.043 38 17.30 0.036 21 0.004 46 17
2017 2018 16.60 2019
0.043 9 16.80 0.026 18 0.002 10 12.9
15.70
0.033 22 17 0.042 13
17
0.017 24 16.50 0.024 35
0.042 42 16.90
Average * 0.0398 21.125 16.9625 Average * 0.022 16 16.46 Average * 0.003 28 14.95
* The average values are calculated by using data collected for petrol cars. * The table demonstrates the emission of CO, HC and CO2 . * The average values for HC are rapidly growing
every year. This is a matter of concern. New advancement in automobile industries do not take this into consideration to maintain these values.Sustainability 2020, 12, 6707 16 of 22
Table 8. Average emissions over different years of CO and HC for petrol/CNG-driven vehicles [24–54]
CO HC CO HC CO HC
Year Year Year
(ppm) (ppm) (ppm) (ppm) (ppm) (ppm)
0.026 10 0.31 35 0.1 9
0.17 9 0.02 12 0.02 0
0.05 34 0.02 16 0.04 9
0.02 7 0.02 3
2005 2007 2008
0.034 7 0.01 14
0.001 5
0.016 4
0.04 27
Average * 0.06 13.4 Average * 0.116 21 Average * 0.0308 8.875
CO HC CO HC CO HC
Year Year Year
(ppm) (ppm) (ppm) (ppm) (ppm) (ppm)
0.01 6 0.04 7 0.027 77
0.04 7 0.04 16 0.019 18
0.004 8 0.001 31 0.01 93
2009 2010 2011
0.1 44 0.003 132 0.03 19
0.05 0 0.04 18
0.041 9
Average * 0.0408 12.33 Average * 0.021 46.5 Average * 0.0252 45
CO HC CO HC CO HC
Year Year Year
(ppm) (ppm) (ppm) (ppm) (ppm) (ppm)
0.004 58 0.018 12 0.02 161
2012 0.027 42 2013 0.041 88 2015 0.01 7
0.003 85
Average * 0.0155 50 Average * 0.0206 61.66 Average * 0.015 84
CO HC CO HC
Year Year
(ppm) (ppm) (ppm) (ppm)
0.03 29 0.027 58
2016 0.028 69 2017 0.05 22
0.043 62 0.02 41
Average * 0.0336 53.33 Average * 0.0323 40.33
* The average values are calculated by using data collected for diesel cars. * The average values are calculated by
using data collected for petrol/CNG cars. * The cars registered in 2017 are emitting higher pollutants compare to the
cars registered in 2005. * This is due to the easy availability of unauthorized installation of CNG kits in the Delhi
NCR region.
The lowest average of CO (0.003 ppm) is derived from the year 2019, and the highest average
(0.10975 ppm) is derived from the year 2015. The lowest average of HC (13.33ppm) is derived from
the year 2010, and the highest average (32 ppm) is derived from the year 2015. The lowest average
of CO2 (14.95 ppm) is from the year 2019, and the highest average (19.975 ppm) is from the year
2011.Table 8 displays the average emissions of just two pollutants (CO and HC) for vehicles operating
on petrol/CNG. The average values of pollutants are calculated from the year 2005 to 2017. The lowest
average of CO (0.0150 ppm) is from the year 2015, and the highest average (0.116 ppm) is from the year
2007. The lowest average of HC (8.875 ppm) is from the year 2008, and the highest average (84 ppm) is
from the year 2015.
3. Result Analysis
Our analysis is based on the data collected from the different pollution tracker nodes installed
across the different locations in Delhi NCR. The analysis shows that few parameters need to be a
concern for reducing the pollutants emission by vehicles. These major parameters are the high survival
rates, decrease in annual mileage and major enforcement for three-to-five-year-old vehicles. In Table 2,
we can track out that a large number of old vehicles are used in different regions after the various
notifications in regard to banning old vehicles by the Government of India. These old vehicles are the
major source of vehicle pollutants (Figures 2–4).Sustainability
Sustainability 2020,
2020, 12,
12, xx FOR
FOR PEER REVIEW
PEER REVIEW 1818
ofof
2424
In
In Table
Table 2,
2, we
we can
can track
track out that aa large
out that large number
numberof
ofold
oldvehicles
vehiclesare
areused
usedinindifferent
differentregions
regionsafter
afterthe
the
various
various notifications
Sustainability 2020, 12, 6707 in
notifications in regard to banning
regard to banning old
oldvehicles
vehiclesby
bythe
theGovernment
GovernmentofofIndia.
India.These
Theseold
oldvehicles
vehicles
17 of 22
are
are the
the major
major source
source of
of vehicle pollutants (Figures
vehicle pollutants (Figures2–4).
2–4).
Figure2.2.Trend
Figure ofHSU
Trendof HSU over
HSUover an
overan eight-year
eight-yearperiod
aneight-year periodfor
period fordiesel
dieselvehicles
vehicles[24–54].
vehicles [24–54].
[24–54].
Figure
Figure 3. 3. Different
Different emissiontrend
emission trendfor
forpetrol
petrolvehicles:
vehicles:(a)
(a)CO
COtrend
trendfor
forpetrol
petrolvehicles,
vehicles,(b)
(b)HC
HCtrend
trendfor
Figure 3. Different emission trend for petrol vehicles: (a) CO trend for petrol vehicles, (b) HC trend
for petrol
petrol vehicles
vehicles and
and (c) (c)and
HC HC COand2 CO 2 combined
combined trend
trend for for petrol
petrol vehicles.
vehicles. [24–54].
[24–54].
for petrol vehicles and (c) HC and CO2 combined trend for petrol vehicles. [24–54].
This situation can be handled by introducing the low survival rate for vehicles. It would correspond
to easy replacement or breakdown of old vehicles. Thus, after introducing this, the pollutants share of
old vehicles would be low. Lowering the survival rate will down the percentage of pollutants emission
by old vehicles.
Lowering the mileage can also result in low fuel consumption and reduce emissions, too.
The vehicles can be categorized in different mileage levels. For new vehicles, the mileage should be high,
and for old vehicles, those having a high emission, the mileage level should be low. Major enforcement
is also needed for reducing vehicle pollution. Time to time, vehicle services and enforcement are
very important to reduce the pollutants emission by vehicles (Figure 5). The current study can make
significant correlations with the impact of emission components toward sustainable development.
We can further investigate in terms of green ICT and pollution, as well. In the future, based on several
available studies found from the work done by several researchers, we may try to further explore the
solutions for reducing pollutants. We can find some IoT sensor-enabled technologies to raise alarms if
the pollution level or emission of specific gases, such as CO, CO2 and HC, go beyond the acceptable
limits [63–68].You can also read