A Wide-Range, Wireless Wearable Inertial Motion Sensing System for Capturing Fast Athletic Biomechanics in Overhead Pitching - MDPI
←
→
Page content transcription
If your browser does not render page correctly, please read the page content below
sensors
Article
A Wide-Range, Wireless Wearable Inertial Motion
Sensing System for Capturing Fast Athletic
Biomechanics in Overhead Pitching
Michael Lapinski 1 , Carolina Brum Medeiros 2 , Donna Moxley Scarborough 3 , Eric Berkson 3 ,
Thomas J. Gill 4 , Thomas Kepple 5 and Joseph A. Paradiso 1, *
 1    Responsive Environments Group, MIT Media Lab, Cambridge, MA 02139, USA
 2    Input Devices & Musical Interaction Lab, McGill University, Montreal, QC H3A 1E3, Canada
 3    Sports Medicine Service, Department of Orthopaedic Surgery, Massachusetts General Hospital,
      Boston, MA 02114, USA
 4    New England Baptist Hospital, Boston, MA 02120, USA
 5    C-Motion Inc., Germantown, MD 20874, USA
 *    Correspondence: joep@media.mit.edu; Tel.: +1-617-253-8988

 Received: 10 June 2019; Accepted: 15 August 2019; Published: 21 August 2019

 Abstract: The standard technology used to capture motion for biomechanical analysis in sports has
 employed marker-based optical systems. While these systems are excellent at providing positional
 information, they suffer from a limited ability to accurately provide fundamental quantities such as
 velocity and acceleration (hence forces and torques) during high-speed motion typical of many sports.
 Conventional optical systems require considerable setup time, can exhibit sensitivity to extraneous
 light, and generally sample too slowly to accurately capture extreme bursts of athletic activity.
 In recent years, wireless wearable sensors have begun to penetrate devices used in sports performance
 assessment, offering potential solutions to these limitations. This article, after determining pressing
 problems in sports that such sensors could solve and surveying the state-of-the-art in wearable
 motion capture for sports, presents a wearable dual-range inertial and magnetic sensor platform
 that we developed to enable an end-to-end investigation of high-level, very wide dynamic-range
 biomechanical parameters. We tested our system on collegiate and elite baseball pitchers, and have
 derived and measured metrics to glean insight into performance-relevant motion. As this was,
 we believe, the first ultra-wide-range wireless multipoint and multimodal inertial and magnetic
 sensor array to be used on elite baseball pitchers, we trace its development, present some of our
 results, and discuss limitations in accuracy from factors such as soft-tissue artifacts encountered with
 extreme motion. In addition, we discuss new metric opportunities brought by our systems that may
 be relevant for the assessment of micro-trauma in baseball.

 Keywords: baseball; pitching; ballistic motion; jerk; wearable wireless sensor; high-dynamic range
 motion capture; wearable inertial sensor; wearable IMU; wireless wearable motion sensing; MARG;
 inertial measurement vs. optical tracking

1. Introduction
     Elbow and shoulder injuries among baseball players, in particular pitchers, continue to be a
concern despite maximum pitch count recommendations and regulations [1–6]. Ligament and muscular
damage at the elbow and shoulder has been associated with the repeated micro trauma sustained
by these structures during the demands of high-speed throwing and pitching [1,7,8]. In addition to
financial costs associated with ligamentous injuries, typically requiring surgical treatment, functional
day-to-day limitations and a long rehabilitation process create further loss to an athlete and/or an

Sensors 2019, 19, 3637; doi:10.3390/s19173637                                   www.mdpi.com/journal/sensors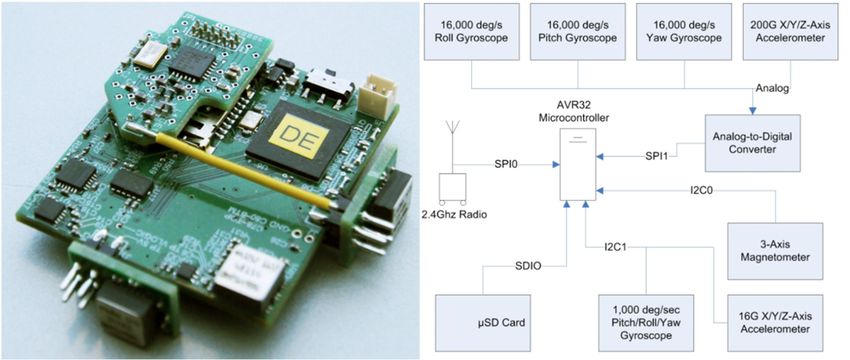
Sensors 2019, 19, 3637                                                                               2 of 15

athlete’s professional organization. Measurements of accelerations and angular velocities per segment,
plus computed torques and forces on the joints during pitching, may lead to better development of
injury avoidance and return to sport after injury programs. Currently, optical motion capture is the
standard tool that sports medicine biomechanists and clinicians use to study the mechanics of motion
and their correlation with injuries. These systems provide data to guide diagnosis, treatment, training
modifications, return to sport, or removal from training.
      New technology is advancing motion capture to wearable sensor systems. The quality of these
systems ranges from gadgets with limited or no calibration to accurate scientific tools. Whether
lab-based or body-worn, current technologies are limited by sampling body segment motion collection
at rates too slow to fully capture the ballistic human motion performed during pitching. The act of
pitching includes body segment motion which is relatively slow at the start of the activity, creating a
base for transferring momentum through the body in a proximal-to-distal pattern out to the throwing
arm [9,10]. Pitching also includes the fastest recorded human body segment movement; the arm
segment rotating about the shoulder joint measuring over 7000◦ /s [11]. In recent years, physicians
and team managers have observed, with attention and enthusiasm, the possibilities brought by new
technology and methods for quantifying and qualifying high-speed sport performance [12–14]. Using
systems that evolved from our initial prototypes fielded in 2006, this paper reports one of the earliest
efforts, to our knowledge, of providing reliable sports data using portable wireless wearable electronics
that leverage an ultra-wide-range wireless multipoint inertial and magnetic sensor array.
      As introduced above, most quantitative athletic biomechanical analyses still rely on manual
video inspection or commercial marker-based optical systems [15,16], which consist of near-infrared
camera arrays measuring at up to hundreds of frames per second, compromising resolution for
capture speed. Setting up and calibrating a camera-based tracking system is time consuming, and the
stability of the data processing can be affected by visual artifacts, occlusion, and changing background
light. The expenses to purchase, maintain, and operate camera-based laboratories also limit access
to biomechanical pitch analyses for many institutions and athletes. The accepted standard motion
capture systems are mostly indoor lab-based equipment setups, which limit simulation of the outdoor
game environment and potentially the athlete’s performance. Commodity depth-sensing cameras, as
embodied in the Microsoft Kinect™, have had some application in sports analysis [17], but range, speed,
and accuracy limitations have constrained their capability. Active magnetic trackers are light-insensitive,
but susceptible to distortion from conductive and/or ferrous metal and present very limited range
of operation, as well as often inclusive of tethered cabled sensors [18]. Mechanical measurement
methods, such as goniometers [19] and exoskeletons [20], require the body to be restrictively cabled
up or constrained. Vests, shirts, and garments, generally wired with embedded inertial, bioelectric,
and fabric sensors, have likewise been explored and adapted for motion capture, including athletic
sensing [21–25]. One example is a system composed of a single inertial sensor applied onto the elbow
via a skin-tight sleeve [26,27] for athletic applications. Also, high-quality flexible goniometers with
embedded inertial units have recently become available [28].
      Sensors of nearly all types have grown smaller and cheaper, enabling their seamless integration
into nearly everything, as envisioned decades ago by the pioneers of Ubiquitous Computing [29].
Inertial systems have a limited history in basic motion and biomechanical research, dating back to the
1970s [30], before integrated miniature accelerometers were available. Wired and wireless wearable
inertial systems have appeared commercially over the last decade (e.g., [24–26,28,31]) and in research
(e.g., [32–35]), but have been mainly applied to non-ballistic motion capture, where the average
motion speed is typical of human gait, as opposed to high-intensity sports analysis, only very recently
providing the ability to capture high speed motion [36]. Some researchers use inertial technology
to only recognize posture and activity, dispensing the need for high range sensors and joint angle
computation [37], albeit at an information sacrifice. Additional information can be found in these
recent review articles discussing the use of inertial sensors for lower limb movement [38,39], generic
human motion [40], and sports [41].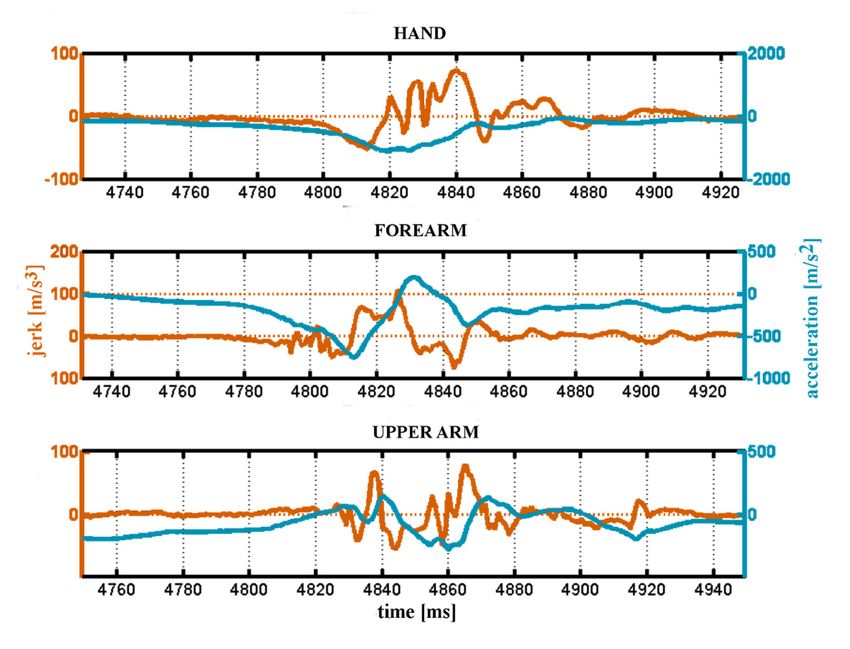
Sensors 2019, 19, 3637 3 of 15
However, while the product market has been successful in putting these small wearable devices
on athletes and moving the athlete out of the lab setting, the data application in sport is still constrained
by range and sampling rate [42]. To address the challenge of quantifying the high-speed stresses
incurred on the upper extremity during throwing, specifically baseball pitching, we set out to create a
new inertial measurement unit (IMU) that can capture 3D motions occurring at both low and high
speeds. Accordingly, we have developed a wearable inertial sensor platform to enable end-to-end
investigation of high-level, very wide dynamic-range biomechanical parameters. Unlike commercially
available wireless systems that have been designed for motion capture, our device has extremely high
dynamic range and exhibits precise synchronization across multiple wearable nodes.
Using the state-of-the-art camera-based motion capture systems, shoulder and elbow distraction
forces are calculated using the second derivative of the measurement system data, i.e., linear acceleration,
and inverse kinematics. Unfortunately, the derivatives of orders greater or equal to two have high
levels of noise, often resulting in limited or no physical significance, unless the original data—in
position units—is filtered down to 10–20 Hz. This filtering damps rapid signal variations, and hampers
proper inference of higher-order derivatives that happen during excessive joint load. Accordingly,
we assert that classical optical systems are limited in producing meaningful assessment of these forces.
Finally, we introduce the concept of jerk to the evaluation of pitching mechanics using our IMU
system. As defined in classical mechanics literature (e.g., [43]), jerk is the third derivative of position,
and it expresses the rate of change of acceleration (as opposed to acceleration itself which is the rate of
change in velocity over time). We suggest that the rate of change of acceleration may be more related to
microtrauma than the absolute value of acceleration, which is canonically used to obtain force metrics.
Given the assertion about the noise inherent in the second derivative of the positional data to calculate
acceleration, calculating a third derivative of positional data has been effectively prohibited in previous
optical-based biomechanical evaluations of pitching. We hypothesize that meaningful jerk data could
be obtained from our multi-segment inertial system.
In this paper, we present the scientific requirements needed and the steps taken to build a robust
and accurate wearable sensing system with high autonomy and portability for baseball and provide
initial comparisons to an optical motion analysis system. In baseball, pitch type is often distinguished
based on the grip of the baseball and the motion of the hand and forearm. Wrist flexion and extension
rely on the action of the larger muscles in the forearm, some of which cross the elbow joint. Therefore,
we included wrist joint force and hand angular velocity in our analyses. Elbow valgus/varus torque,
and shoulder and elbow distraction forces were biomechanical metrics selected for comparison based
on their established connection to shoulder injuries and UCL (Ulnar Collateral Ligament) sprain [44,45].
A series of studies were performed to address the following aims: (1) Compare the raw output of
wrist force, wrist angular velocity, shoulder angular velocity, and shoulder and elbow distraction
forces between an optical marker-based system versus our developed inertial system. (2) Investigate
the influence of filter processing on optical system data compared to the data from the multimodal
wide-range IMUs. (3) Investigate the feasibility of using shoulder jerk as a metric from the IMU
wearable system for identifying differences in stress at the shoulder joint across pitch types.
2. Materials and Methods
2.1. Participants
This pilot study was approved by the institutional review board and included two sub-studies.
In the first study, we collected simultaneous data from an optical 3D motion capture system in our
Sports Performance Laboratory and our multi-segment inertial system on two collegiate (age 20.5 years)
pitchers. A second data set was collected on six professional baseball pitchers using our multi-segment
inertial system at an outdoor training facility. All participants provided informed written consent.
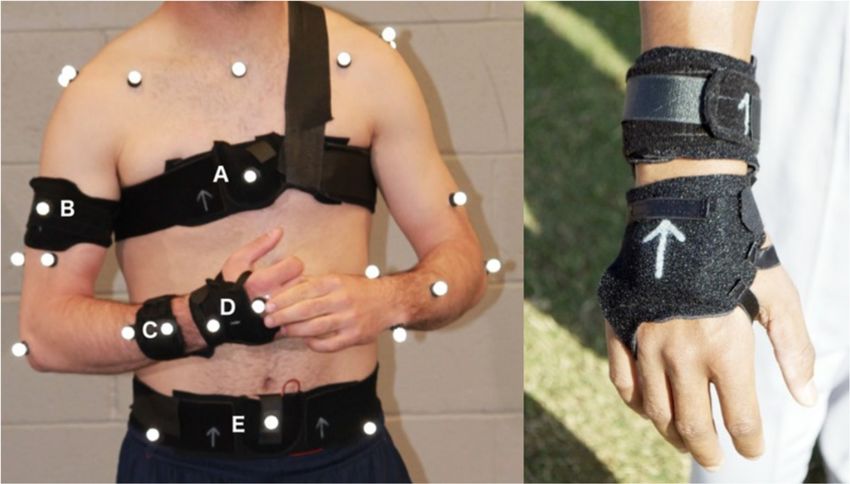
Both studies included placement of five multi-segment inertial measurement units (nodes) to the wrist,
the forearm, the upper arm, the chest and the waist on each participant (Figure 1). In order to affix the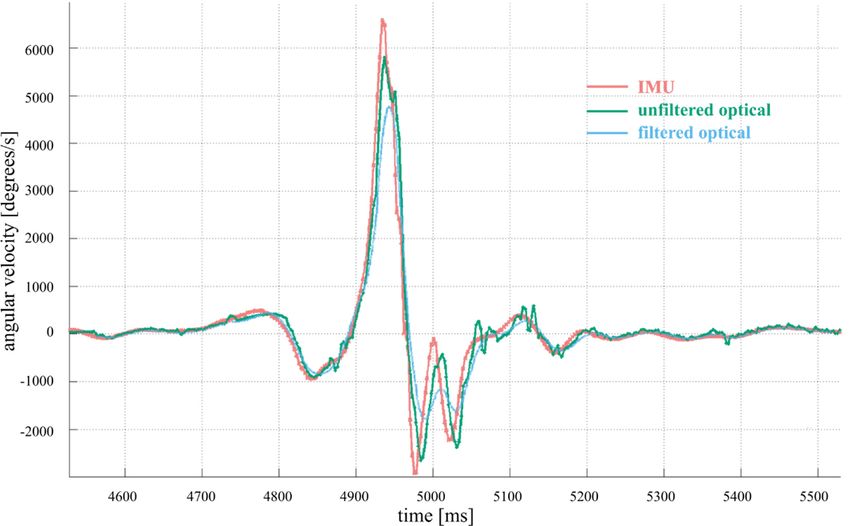
Sensors 2019, 19, 3637 4 of 15
sensors to the players, we co-designed with an orthotics manufacturer, a set of rubberized Neoprene
Snakeskin™ straps with snug pockets to securely hold the sensor nodes [46]. Among the five pockets,
Sensors 2019, 19, x FOR PEER REVIEW 4 of 15
only the one placed on the chest required additional straps to keep it in place during fast motions
(Figure 1, node
during fast A). Due
motions to sweat
(Figure andA).
1, node theDue
fasttomotion, some
sweat and theoffast
themotion,
optical system’s reflective
some of the opticalspherical
system’s
markers came unfixed from the throwing arm. In order to replace them at the same
reflective spherical markers came unfixed from the throwing arm. In order to replace them at anatomical point,
the
we proactively labeled the skin with an ink pen prior to marker placement.
same anatomical point, we proactively labeled the skin with an ink pen prior to marker placement.
Figure 1.
Figure 1. Neoprene
Neoprene straps worn by to a pitcher (left), node locations: chest (A), upper arm (B), forearm
hand (D),
(C), hand (D), waist
waist (E).
(E). Detail
Detail of
of forearm
forearm and
and hand
hand nodes
nodes(right).
(right).
The testing procedure
procedure for for both studies included a warm-up routine prior to data collection, after
the nodes (and reflective markers) markers) were applied.
applied. All participants threw the full distance of 18.44 m
from
from aastandard
standardturf turfmound
moundtoto a target placed
a target placed approximately
approximately 1 m1behind
m behinda standard sized sized
a standard home homeplate.
A professional grade radar gun, Stalker ATS 5.0 (Stalker Radar, Plano, TX,
plate. A professional grade radar gun, Stalker ATS 5.0 (Stalker Radar, Plano, TX, USA), was used to USA), was used to record
all pitchallspeeds
record pitch by measuring
speeds the velocity
by measuring of the ball
the velocity of along
the ball thealong
radar’stheline of sight
radar’s lineusing standard
of sight using
Doppler
standardtechniques. Players pitched
Doppler techniques. Playerstheir standard
pitched their‘side’,
standardthrowing
‘side’,a minimum
throwing aofminimum
25 pitches ofwith
25
apitches
mix ofwith
fastballs,
a mix breaking pitches
of fastballs, and change-ups.
breaking pitches and Pitch Type wasPitch
change-ups. recorded.
TypeEach
was subject’s
recorded.set up
Each
time included
subject’s set upapproximately
time included15 min to prep the
approximately 15 skin
min to (place
prepink themarks whereink
skin (place the marks
markers werethe
where to
be placedwere
markers on the
to bethrowing
placed onarm)
thefollowed
throwingby thefollowed
arm) reflectiveby marker placement.
the reflective markerA 10-min timeAwas
placement. 10-
allocated
min time to place
was the IMUs
allocated to and
placecollect calibration
the IMUs information
and collect of their
calibration positions. Depending
information on the
of their positions.
pace of the pitcher
Depending on the and pacenumber of pitches
of the pitcher and thrown,
number theofdata collection
pitches thrown,timethewas approximately
data collection time20 min.
was
The removal of the sensors took about 5 min, resulting in a total study time
approximately 20 min. The removal of the sensors took about 5 min, resulting in a total study time of approximately 1 to 1 and
of
aapproximately
quarter-hours1intolength.1 and aAll results provided
quarter-hours in thisAll
in length. paper refer
results to Studyin1,this
provided except therefer
paper jerk analysis.
to Study
1, except the jerk analysis.
2.2. Wearable Sensor Hardware and Software
2.2. Wearable Sensor
Our system hadHardware andinSoftware
its genesis a multipoint wearable inertial sensor network that we originally
designed in 2006 had
Our system to instrument
its genesisan
ininteractive dance
a multipoint ensemble
wearable [47].sensor
inertial This system
network was evolved
that from a
we originally
wireless
designed in 2006 to instrument an interactive dance ensemble [47]. This system was evolved fromina
multimodal sensor node that our research group designed and first fielded in a dancing shoe
1997 [48],multimodal
wireless which was subsequently adapted
sensor node that into a very
our research early
group sensor node
designed for wireless
and first fielded ingait analysisshoe
a dancing [49].
From 2006 to 2013, we developed a succession of devices aimed at pitching and batting
in 1997 [48], which was subsequently adapted into a very early sensor node for wireless gait analysis [50–52], each
honed by experience
[49]. From garnered
2006 to 2013, in working
we developed with professional
a succession of devicesplayers
aimedduring spring
at pitching training,
and battingresulting
[50–52],
in ourhoned
each final design shown ingarnered
by experience Figure 2 and detailed with
in working in [46].
professional players during spring training,
resulting in our final design shown in Figure 2 and detailed in [46].
The nodes measure (45 mm × 50 mm × 10 mm) and weigh 25 g (half due to battery mass). Each
node has a 3-axis ± 200 g ADXL377 accelerometer, three orthogonal single-axis, ±20,000°/s ADRXS649
gyros, a 3-axis Invensense IMU-3000 3-axis 1000°/s gyro, a 3-axis ± 16 G ADXL345 accelerometer, and
a HMC5843 digital magnetometer (Figure 2). The multi-range accelerometers and gyroscopes let us
record slow motion with the low-range devices and fast motion with the high-range units, thus
providing high relative resolution across an entire athletic gesture after being fused in a statistically-
based postprocessing interpolation [46]. Synchronized inertial data was sampled at a rate of 1000 Hz
across all calibration and pitch gestures.
is indicative of node health. Our nodes use a 145 mAh lithium polymer rechargeable battery that can
continuously power a node for circa 3 h of use. The nodes are continuously active when switched
on—although adaptive power management techniques can reduce the average needed current, this
degree of node longevity is adequate for our typical testing session. As the inertial components come
with inexact
Sensors            specification, each sensor on each node is custom-calibrated on a controlled highly
        2019, 19, 3637                                                                           5 of 15
accurate rotating platform [46].

            Figure 2.
            Figure 2. Final
                      Final Wearable ‘Sportsemble’ Sensor
                            Wearable ‘Sportsemble’ Sensor Node
                                                          Node (left)
                                                                (left) and
                                                                       and Block
                                                                           Block Diagram
                                                                                 Diagram (right).
                                                                                          (right).

2.3. Optical  3D Motion
      The nodes    measureCapture
                              (45 mmSystem Hardware
                                        × 50  mm × 10  andmm)
                                                            Software
                                                                 and weigh 25 g (half due to battery mass).
Each node has a 3-axis ± 200 g ADXL377 accelerometer, three orthogonal single-axis, ±20,000◦ /s
      A Vicon MX™ 3D motion capture system (Vicon Motion Systems Ltd., Oxford, Oxfordshire, UK)
ADRXS649 gyros, a 3-axis Invensense IMU-3000 3-axis 1000◦ /s gyro, a 3-axis ± 16 G ADXL345
comprised of 20 T-series cameras (collecting at 360 Hz) was used to track the 62 reflective markers
accelerometer, and a HMC5843 digital magnetometer (Figure 2). The multi-range accelerometers and
(14 mm diameter spheres) placed upon each pitcher during the pitching motion. The markers were
gyroscopes let us record slow motion with the low-range devices and fast motion with the high-range
located over anatomical landmarks to identify joints, and additional markers were placed in general
units, thus providing high relative resolution across an entire athletic gesture after being fused in a
locations upon each segment to improve segment tracking in the 3D space. These specific marker
statistically-based postprocessing interpolation [46]. Synchronized inertial data was sampled at a rate
placements were based on a previously described marker set [10] that creates a 15 body-segment
of 1000 Hz across all calibration and pitch gestures.
model for data capture during baseball pitching. For global coordinates, the direction of the pitcher’s
      The nodes are supervised by an AVR32 processor with a removable SD memory card used to store
throw defined the motion capture laboratory’s X axis. The Z axis was identified as the vertical
all data locally (these are removed and uploaded to mass storage at the end of each day). The embedded
direction, and Y defined as the cross-product of the X and Z axes. The C3D motion capture data files
radio, a 2.4 GHz Nordic nRF2401a with RF amplifier, provides a maximum bandwidth of 1 Mbps at
were imported into a biomechanical analysis software, Visual3D™ (Version 5, C-Motion Research
an output power of +4 dBm. It is mounted on a daughter card to isolate the RF electronics from the
Biomechanics, Inc., Germantown, MD, USA) for joint torque and force calculations. The methodology
main board and enable an easy upgrade of the RF hardware. Our radio protocol is a custom-designed
that Visual3D uses for computing kinetics is described in detail in the literature [54]. Our contribution
lightweight TDMA (Time-Division Multiple Access) scheme [53] and is primarily used to synchronize
in relation to the cited work is that the angular velocity and the translational acceleration data used
all nodes to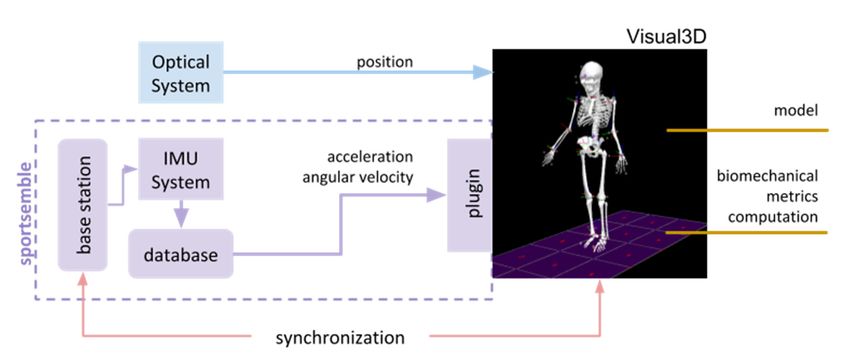
Sensors 2019, 19, 3637                                                                               6 of 15

All joint torques were calculated with respect to participants’ height. Particular details to note for these
study comparisons include the determination of the shoulder joint center following linear regressions
described by Meskers’ protocol [55]. The local coordinate systems for each node location are defined
in [46]. In the case of the hand and arm mounted IMUs and optical targets described here, the local
Za axis of the arm segment was aligned with the longitudinal axis of the humerus (and the local Zh
axis of the hand pointed down along the arm) to create 6-DOF models of the hand and arm segments.
Our modeling of the upper extremity joint followed recommendations of the ISB [56].
      A hardware interface allowed synchronization between the wearable multimodal IMU system
and the optical motion capture system via a general-purpose input output (GPIO) port on the base
station transmitter. The synchronization data was stored on each node’s onboard storage and was
rectified in the analysis engine to provide a single synchronized data set between all nodes and the
optical system.
      The basestation is used for time synchronization of the nodes, and it does not process any of the
data. The basestation sends timestamped synchronization packets and commands to the nodes. When
a node receives these timestamp packets, it annotates the data that was being gathered in real-time
with the timestamp. This made data alignment between the nodes fairly trivial, as all that was required
to align the data was to match timestamp values [46,53].

2.4. Data Analysis
      It is common practice in the field of biomechanics to filter out data derived from the optical
systems [10,45,57–61], as smoothing positional data allows for the use of the optical data for computing
kinetic quantities. A qualitative comparison of optical and inertial data was performed with and
without canonical low pass filters on optical data. A fourth-order, a low-pass Butterworth filter was
applied to the data from the optical marker set at 14 Hz. Attenuation between the optical and the
inertial systems were calculated for the kinetic and kinematic variables of interest.
      Measurements of node placement on each body segment were made relative to anatomical
features [46] and permitted translation between coordinate systems. Kinematic and kinetics data,
including shoulder internal/external rotation torques, elbow valgus torque, and shoulder and elbow
distractive forces, were calculated for both systems. In the second evaluation, pitch motions were
evaluated with the inertial system alone.
      We used the same biomechanical analysis engine, Visual3D™ (v5) [62], to standardize calculations
of kinematic and kinetic data from both the IMU and the optical motion capture systems. This allowed
for direct comparisons between the two data collection approaches (Figure 3). The IMU data undergo
minimal processing—we essentially input the directly-measured angular rates and accelerations into
Visual3D at the node locations instead of using the analogous values that would be derived by complex
analysis of the optical markers. The synchronization time stamp data was stored on each node and
rectified in the analysis engine to provide a single synchronized data set between all nodes and with
the optical system.
      A series of descriptive analyses are presented in this proof of concept study. The limited number
of participants in the simultaneous biomechanical comparison study limited the application of deeper
statistical analyses.
data undergo minimal processing—we essentially input the directly-measured angular rates and
accelerations into Visual3D at the node locations instead of using the analogous values that would
be derived by complex analysis of the optical markers. The synchronization time stamp data was
stored on each node and rectified in the analysis engine to provide a single synchronized data set
Sensors
between 19,nodes
2019,all 3637 and with the optical system. 7 of 15
Figure
Figure 3. System architecture
3. System architecture merging
merging optical
optical and
and inertial
inertial data
data for
for kinetics
kinetics and
and dynamics
dynamics processing.
processing.
3. Results
A series of descriptive analyses are presented in this proof of concept study. The limited number
To meet the
of participants in aims of this study,biomechanical
the simultaneous we collected data in two separate
comparison testing
study limited thescenarios. Weofpresent
application deeper
first the results
statistical of the biomechanical metrics of both the multimodal IMU system and the optical
analyses.
system during the simultaneous data capture testing. The two collegiate pitchers in study one included
Participant A (height = 1.78 M and weight 82.7 kg) with an average fastball speed of 124.4 km/h.
Participant B (height of 1.80 M and weight 79.1 kg) performed during testing an average fastball speed
of 114.9 km/h.
3.1. Qualitative Comparison of Data from the Multimodal IMU System and the Optical System
The final velocity provided to the gripping fingers just prior to ball release is generated by the
hand segment of the pitcher’s throwing arm. The angular velocity of the hand along axis Zh , illustrates
the timing lag and peak attenuation introduced by the standard low pass filtering of the optical
motion capture system (Figure 4). The use of unfiltered optical data mitigates this effect, resulting
in a more similar optical data motion pattern to that of the multimodal IMU system. Averaging
across 26 throws for one of the pitcher subjects, we saw a mean difference between canonically filtered
optical and inertial angular velocity distractive (positive) peaks at the hand along the (Zh ) axis of 32%
(2071◦ /s out of 6466◦ /s), consistent with the example shown in Figure 4. The standard deviation in
this inertial peak across all throws was found to be 331◦ /s (5% of the average peak angular rate) and
the standard deviation in the inertial-to-optical difference in angular velocity was 491◦ /s (24% of the
mean), indicating a consistent undershoot in the optical measurement. The Zh axis considered here at
the location of the hand involves some of the highest and most impulsive angular rates encountered in
the throwing motion, as it corresponds to wrist/arm twist. Nodes at other body locations and along
other axes exhibit lower peak rates, although still tend to exhibit optical-to-inertial undershoot because
of fast-changing dynamics that the inertial system detects and optical system misses [46]. Further
statistical discussion is given in Section 3.2.
In Figure 5, we present comparisons between the IMU data and filtered and unfiltered optical data
for a measurement of the sagittal plane X axis wrist force (along the direction of throw). As anticipated,
the unfiltered data exhibits considerably more noise than either filtered or IMU data. During the joint
compression force phase (positive values of force), however, both filtered and unfiltered optical data
are not able to capture the peak of the motion seen by the IMU, falling over a factor of two short in this
axis, indicating a serious underestimate in the most critical phase of pitching motion.Sensors 2019, 19, 3637 8 of 15
Sensors2019,
Sensors 2019,19,
19,xxFOR
FORPEER
PEERREVIEW
REVIEW 88 ofof 15
15
Figure4.4.Z
Figure
Figure ZZhhhaxis
axisangular
angularvelocity
velocityof thehand
ofthe
the handfor
hand foraaatypical
for typicalfastball
typical fastballpitch:
fastball pitch:IMU,
pitch: IMU,filtered
IMU, filteredand
filtered andunfiltered
and unfiltered
unfiltered
opticaldata.
optical
optical data.The
data. The
The loss
loss of information
of of
loss information
information on filtered
filtered
on filtered
on optical optical data
data isdata
optical isis noticeable
noticeable noticeable in the
the amplitude
in the amplitude
in amplitude and
and dynamics.
and
dynamics.
dynamics.
Figure5.5.Sagittal
Figure
Figure Sagittalplane
Sagittal planeX
plane XXaxis
axis(throwing
axis (throwingdirection)
(throwing direction)wrist
direction) wristjoint
wrist jointforce
joint forcefor
force foraatypical
for typicalfastball
fastballpitch:
fastball pitch:IMU,
pitch: IMU,
IMU,
filteredand
filtered
filtered andunfiltered
unfilteredoptical
opticaldata.
data.
3.2.Elbow
3.2. Elbow Valgus
AfterValgus
the ball Loading and
release,
Loading and Shoulder
high speed
Shoulder Distraction
video has
Distraction Forces
shown that several apparently involuntary and
Forces
somewhat
Wehave oscillatory
have measured movements
twoplayers
players happen
throwing in thea kinematic
seriesof chain [63]
offastball
fastball as the relaxing
andchange-up
change-up arm(the
pitches rocks back
latter
We measured two throwing a series and pitches (the latter isis
and
a forth,
slower contributing
pitch delivered to the
in a ringing
fastball seen
style, in our
meant data
to there
confuse in both
batters) Figures
with 4
both and 5.
systems. What aspects
Table 1 of
shows
a slower pitch delivered in a fastball style, meant to confuse batters) with both systems. Table 1 shows
these motions
thepitch
pitch countsareand
actually
averagebiomechanically
ballspeeds,
speeds,togetherrelevant
together motion
with or arisepeak
theaverage
average fromvalgus
soft tissue
forcesartifacts
(atthe (STAs)
theelbow)
elbow)
the counts and average ball with the peak valgus forces (at
remain thean
and the open research
average question [46].
peak distractive
distractive forcesFor (atthese reasons, we
the shoulder)
shoulder) asdo not derive
derived fromanytheconclusions on the
Visual3D analysis
analysis
and average peak forces (at the as derived from the Visual3D
distractive phase of
describedearlier.
earlier. themeans
The motion (µ)(negative
andstandard valuesdeviations
standard of force). (σ)
Weof also
thespeculate that the
forceestimates
estimates areoptical
shown system
forboth is
both
described The means (µ) and deviations (σ) of the force are shown for
more susceptible
optical and
and IMU to STAs
IMU systems. in
systems. The deriving
The ‘factor’, force values,
‘factor’, isis the
the ratio due to
ratio between the
between the fact that the
the average error
average peak propagation
peak inferred
inferred by and
by the
the IMUthe
IMU
optical
system to the average peak found using the canonically-filtered optical tracker
system to the average peak found using the canonically-filtered optical tracker measurements, and measurements, and
indicates the relative scale by which the optical system underestimated the IMU-inferred data. AA
indicates the relative scale by which the optical system underestimated the IMU-inferred data.Sensors 2019, 19, 3637 9 of 15
rigid-body assumption for deriving force from positional data are much more complex and uncertain
than the process for obtaining force from the inertial data, which is essentially a proportionality.
The positional data of several optical markers is used to approximate a rigid body and determine
its position, which is then differentiated twice to obtain linear acceleration, while the inertial system
directly provides the acceleration itself at the node location, hence making a cleaner measurement,
with the strapdown IMU measurement axes directly fixed to local body segment coordinates.
3.2. Elbow Valgus Loading and Shoulder Distraction Forces
We have measured two players throwing a series of fastball and change-up pitches (the latter
is a slower pitch delivered in a fastball style, meant to confuse batters) with both systems. Table 1
shows the pitch counts and average ball speeds, together with the average peak valgus forces (at
the elbow) and the average peak distractive forces (at the shoulder) as derived from the Visual3D
analysis described earlier. The means (µ) and standard deviations (σ) of the force estimates are shown
for both optical and IMU systems. The ‘factor’, is the ratio between the average peak inferred by the
IMU system to the average peak found using the canonically-filtered optical tracker measurements,
and indicates the relative scale by which the optical system underestimated the IMU-inferred data.
A statistical significance test was performed, given the distribution descriptors and the sample sizes.
For the average peak distraction forces, the p-values were smaller than 0.0001, indicating that there is a
statistically significant difference between the peak measurements for distraction forces on the IMU
system in relation to the baseline optical system. For the measurements of the average peak valgus
force, only one condition was not statistically significant: player B throwing change-up balls, which
had a broader distribution (in general, the small number of change-ups thrown in these tests limit their
accuracy, although the means are in line with expected trends). In general, the optical system’s relative
underestimate is seen to increase with force. Similar results were seen for shoulder compressive and
elbow varus forces [46].
Table 1. Descriptive findings for elbow valgus torque and shoulder distractive force as derived from
inertial and optical systems across the two pitchers.
Pitch Sample Average Average Peak Valgus Force (Nm) Average Peak Distractive Force (N)
Pitcher Speed
Type Size IMU Optical Factor p-value IMU Optical Factor p-value
(km/h)
µ = 159.66 µ = 100.22 µ = 2994.62 µ = 633.29
fastball 33 124.4 1.59 0 4.73 0
A σ = 40.61 σ = 7.17 σ = 345.88 σ = 38.74
µ = 108.76 µ = 93.96 µ = 2290.87 µ = 628.08
change-up 3 116.2 1.16 0 3.65 0
σ = 1.56 σ = 0.73 σ = 228.77 σ = 17.69
µ = 75.84 µ = 45.39 µ = 812.79 µ = 519.22
fastball 18 114.9 1.67 0 1.57 0
B σ = 22.67 σ = 6.77 σ = 90.90 σ = 127.75
µ = 97.57 µ = 65.97 µ = 794.62 µ = 444.90
change-up 4 102 1.48 0.0871 1.79 0
σ = 20.68 σ = 43.76 σ = 154.07 σ = 63.80
3.3. Jerk
Our second data collection included data from a separate population of six minor league
professional baseball pitchers to investigate the application of jerk as a biomechanical metric for pitch
analysis. The linear jerk along the long axis of the humerus (Za -axis) was calculated by directly
differentiating accelerometer data from a total of 206 pitches of various pitch types among the six
pitchers. We have calculated the average jerk value per pitch type: 2-seam fastball (53.6 m/s3 ), breaking
ball (62.3 m/s3 ), change-up (65.0 m/s3 ), fastball (66.8 m/s3 ), and slider (76.3 m/s3 ). In Figure 6, which
shows the jerk profile for a typical fastball pitch, one can note that none of the peak jerk values occurred
right before or right after the time of peak acceleration. This may be an indicator that analyzing the
moment at which the peak jerk occurs could be a relevant assessment for investigating microtrauma
that goes beyond just using peak acceleration.Sensors 2019,
Sensors 19, x3637
2019, 19, FOR PEER REVIEW 1010of
of 15
15
Figure 6. Peaks of acceleration and jerk do not happen at the same moment and have different dynamics.
Figure 6. Peaks of acceleration and jerk do not happen at the same moment and have different
4. Discussion
dynamics.
Current optical systems have allowed clinicians to gain insight into the velocities, forces,
4. Discussion
and torques placed on joints susceptible to injury during ballistic motions and repetitive microtrauma.
These Current opticalhowever,
estimations, systems have allowedbyclinicians
are limited factors such to gain insight
as data into the
filtering velocities,
methods, forces,
lower and
camera
torques
resolution placed on joints
during peak susceptible
speed of optical to injury during
camera ballisticand
systems, motions
artifactand repetitive
motion due microtrauma.
to soft tissue
These
movement estimations,
caused by however,
the highare motionlimited by factors
speed. Our data such as first
is the datatofiltering
comparemethods,
a multimodal lowerwearable
camera
resolution
IMU system during
to thatpeakof anspeed of optical
optical system camera
during the systems, andaction
ballistic artifact motion
of the due topitch
overhand soft and
tissueto
movement
investigate caused by the of
the influence high motion
filtering of speed.
opticalOur data compared
systems is the first to compare
IMU data.a multimodal wearable
IMU Smoothing
system to that of an optical
positional system for
data allows during
the theuse ballistic
of the action
opticalofdata the overhand
for computing pitch and to
kinetic
investigate the influence of
quantities [10,45,57–61]. filtering of
However, optical systems
qualitative compared
comparisons to IMU pitching
of filtered data. data show loss of
Smoothing
potentially positional
meaningful data allows
information withforthethe use
use of of the optical
standard data
filters. for computing
When kinetic quantities
looking specifically at valgus
[10,45,57–61].
elbow torque, However,
our limitedqualitative comparisons
dataset demonstrates ofcalculated
that filtered pitching data show
optical system elbow loss of potentially
torques fall short
meaningful information
of those calculated from the with the use
inertial of standard
system filters.that
and suggests When looking
stresses specifically
on the elbow may at be
valgus
higherelbow
than
torque,
previously ourevaluated.
limited datasetSomedemonstrates
of this limitedthat calculated
resolution optical
is related to system elbow
the capture torques
rate fall shortand
of the systems of
those
the morecalculated from the inertial
direct relationship between system andmeasurements
inertial suggests that and stresses
forces onandthetorques.
elbow may Thebe higher
higher than
capture
previously
rate of our evaluated.
sensor-based Some of this
system limited
(1000 Hz) resolution
versus opticalis related
systems to the
thatcapture
commonly rate capture
of the systems and
pitch trials
the more 240–500
between direct relationship
Hz, appearsbetween to allow inertial measurements
for a better descriptionand of theforces
peakand torques.These
dynamics. The higher
results
capture
raise an rate of ourconcern
important sensor-based
for thesystem
field of(1000 Hz) versus
biomechanics. optical
It is common systems thattocommonly
practice capture
low-pass filter the
pitch trials between 240–500 Hz, appears to allow for a better description
optical data to smooth out inherent jitter in the reconstructed optical data. However, the conservative of the peak dynamics. These
results
cutoffs raise
used onan these
important
filtersconcern for the fieldto
appear detrimental ofthe
biomechanics.
data output,Itlimiting
is common practice
the ability to low-pass
to capture peak
filter
dynamicsthe optical data to athletic
in high-speed smooth motion.
out inherent jitter in the reconstructed optical data. However, the
conservative
This study cutoffs
also used on these
introduces the filters
concept appear detrimental
of ‘jerk’ to the data
to the evaluation output, biomechanics.
of pitching limiting the ability Jerk,
to
thecapture
changepeak dynamics over
in acceleration in high-speed
time (the athletic motion.
3rd derivative of positional data) cannot be properly derived
fromThis study
optical dataalso introduces
of pitching duethe concept
to the noiseofwithin
‘jerk’ the
to the evaluation
data, but as shown of pitching biomechanics.
in this paper, Jerk,
can be usably
the changefrom
calculated in acceleration
IMU data.over time (the
Measured 3rdand
levels derivative
timing of of jerk
positional
may offer data) cannot
new be properly
assessments derived
of soft tissue
from
injuryoptical data of pitching
risk. Evaluation of jerkdueforces to the noise
at the withininthe
shoulder data,
this study butshowed
as shown in this
a trend paper,
toward canjerk
high be
usably calculated from IMU data. Measured levels and timing of jerk may
forces with sliders compared to fastballs [46], but this did not reach statistical significance with our offer new assessments of
soft tissue injury risk. Evaluation of jerk forces at the shoulder in this study showed a trend toward
high jerk forces with sliders compared to fastballs [46], but this did not reach statistical significanceSensors 2019, 19, 3637 11 of 15
limited sample of pitchers. A deeper insight into the implications of jerk forces in the shoulder and
elbow will benefit from more data collected from such high-rate, wide-range wearable inertial systems.
Clinical speculation is that ligament, tendon, and muscle tissue integrity breaks down due to
repetitive microtrauma from repeated high speed pitch deliveries [5,64]. Our preliminary studies have
seen indications of frequent changes in acceleration occurring throughout the pitching motion [46].
Although some of this may arise from soft tissue artifacts, such frequent changes in node-measured
peak angular velocities indicate accelerations and decelerations not observed in the optical motion
data, and may directly contribute to these microtrauma tissue stresses. If this is the case, then the
true severity of the trauma is under-measured with use of optical systems. High-speed, wide-range
inertial data has the potential to provide both clinician and athlete accurate force/torque information,
and in combination with clinical measures/symptoms, offers a unique way to monitor joint stress and
joint health.
Although our studies posit a strong argument for the superior veracity of wearable inertial
sensors over optical tracking systems for accelerations, forces, torques and parameters inferred from
them, one must admit that neither of these systems provide the absolute ground truth. Both systems,
camera-based and wearable sensors, measure physical quantities at the skin overlay, and from this data,
we are estimating quantities for the underlying rigid bodies, i.e., bones, such as forces and torques.
Therefore, there is no noninvasive method today that is able to provide direct, dynamic information of
the hidden rigid body structures, especially for fast motion like pitching.
Hence, like all motion analysis studies, this study is limited by soft tissue artifacts (STAs) [46].
For baseball pitching, the ballistic nature of the motion magnifies the effect of STAs. In optical
motion-capture systems, STAs are considered the most troublesome source of error [65]. Soft-tissue
artifacts manifest in several different ways, such as the inertial reaction of the sensor against elastic skin,
and rocking of the sensor as muscles move, contract/extend, and deform underneath during an extreme
athletic gesture like pitching [66]. Previous work has shown that upper arm axial rotation (humerus
internal-external rotation), is the upper arm motion most affected by STAs [67]. Some studies proposed
the mechanical coupling of forearm and upper-arm to compensate for upper-arm artifacts [68]. This
technique mitigates the noise in the upper arm data. Even if successful compensation for this coupling
is obtained, the solution is limited to motion where the elbow does not reach full extension [68]. This
argues that single segment IMU evaluations may not be as accurate as multi-segment models in the
future [69].
Wearable sensors offer the ability to collect data across body segments and discover motion
patterns that may correlate fatigue with risk of injury to the elbow or shoulder [10]. The inter-segment
timing sequence data provided by this system is more accurate than optical systems by nature of
the IMU’s high frequency response and rapid synchronized sampling rate. The sensors hence nicely
yield the relationship between the timing of each segment’s peak angular velocity, as each transfers its
momentum out to the hand during both pitching and bat swinging [46].
Magnetometer-augmented IMU-derived position can be performed when using this system on
its own and ‘in the field’, but is not as accurate as position obtained from optical motion capture
systems. However, we have seen that the sensors used in the present study provide superior measures
of angular velocity, acceleration, and jerk. If one wants to obtain a best set of kinematic and kinetic
data, it seems likely that the optimal approach would be to fuse the position and orientation data from
a motion capture system with the inertial data obtained from the sensors. One method for fusing the
inertial and motion capture data would be to use well-established estimation algorithms based on
Bayesian inference that provide a principled way for making optimal inferences from the inertial data
and the motion capture system [70]. The use of probabilistic sensor fusion as outlined by Todorov [71]
may improve the quality of the joint force and moment estimates, as well as provide the dynamics
consistency required for the development of the musculoskeletal models needed to estimate the muscle
and ligament forces during a baseball pitch [72].Sensors 2019, 19, 3637 12 of 15
Using the state-of-the-art camera-based motion capture systems has limitations in data capture
rate. The shoulder and elbow distraction torques and forces from such systems are calculated using
the second derivative of the measurement system data, i.e., linear acceleration, and inverse kinematics.
Unfortunately, the derivatives of orders greater or equal to two have high levels of noise, often resulting
in limited or no physical significance, unless the original data—in position units—is filtered down
to 10–20 Hz [46]. This filtering damps rapid signal variations, and hampers proper inference of
higher-order derivatives that happen during excessive joint load. Accordingly, we assert that classical
optical systems do not permit complete insight to the ballistic motion of the baseball pitch, and we
hypothesize that a multi-segment inertial system can produce these quantities with increased precision
over optical systems.
Our nodes seemed to be mechanically adequate for evaluative scenarios. Skilled motor performers
are known to be able to adapt to new setups and interferers around their body easily. The nodes
are light and the players did not express concerns related to movement constraints. Most players
were queried and there was not a single report of the IMU-based system hindering their performance.
The common response indicated that after a few pitches the player “got used to it” and “did not
feel it at all”. During our experiments, the players completed their typical bullpen session without
complaints for their routine of approximately 50 pitches. We did not design the mechanics of our nodes
to be used in actual competitive games, which involve deeper physical and regulatory constraints.
The underlying hardware for wearable IMUs is steadily evolving. The now-common integration
of all inertial components onto a single die has been driven by the large mobile devices market,
and although this enables a much more compact form factor, such combined devices do not yet provide
the extreme dynamic range we need here. The eventual development of log-scale accelerometers and
gyros will enable ultra-wide-range, high-resolution devices that do not need redundant measurements
at different scales, and will be well suited to measuring athletic gesture in high-intensity sports. Finally,
the continual evolution of stretchable electronics is enabling devices such as ours to be embedded in a
conformable form factor better suited to mounting on the body [73–75], with the caveat that STAs and
inertial reaction in intense athletic motion may introduce more effects in a deformable platform.
Author Contributions: Conceptualization, J.A.P., T.J.G., E.B., and M.L.; Methodology, E.B., D.M.S., M.L., J.A.P.;
Software, M.L., C.B.M., T.K.; Hardware, M.L., J.A.P.; Validation, M.L., D.M.S., T.K.; Formal Analysis, M.L, C.B.M.;
Data Curation, M.L.; Writing, J.A.P., C.B.M., D.M.S., E.B., M.L.; Visualization, M.L., T.K., C.B.M.; Supervision,
J.A.P., E.B.; Project Administration, J.A.P.; E.B.; Funding Acquisition, E.B., T.J.G., J.A.P.
Funding: This research was funded by a grant from Major League Baseball and the MIT Media Laboratory
research consortia.
Acknowledgments: The authors would like to thank our colleagues at the Media Lab’s Responsive Environments
Group (especially Brian Mayton, Mark Feldmeier, Mat Laibowitz, and Gershon Dublon). The authors also would
like to thank Marcelo Wanderley of McGill University for his support and for the use of CIRMMT motion capture
infrastructure. This work was supported by the sponsors of the MIT Media Lab and Major League Baseball.
Conflicts of Interest: The authors declare no conflict of interest.
References
1. Fleisig, G.S.; Andrews, J.R. Prevention of Elbow Injuries in Youth Baseball Pitchers. Sports Health 2012,
4, 419–424. [CrossRef]
2. Posner, M.; Cameron, K.L.; Wolf, J.M.; Belmont, P.J., Jr.; Owens, B.D. Epidemiology of Major League Baseball
Injuries. Am. J. Sports Med. 2011, 39, 1676–1680. [CrossRef]
3. Carroll, W. The Alarming Increase in MLB Pitchers Who’ve Had Tommy John Surgery. 2013. Available
online: https://bleacherreport.com/articles/1699659-the-alarming-increase-in-mlb-pitchers-whove-had-
tommy-john-surgery (accessed on 27 February 2019).
4. Rechel, J.A.; Collins, C.A.; Comstock, R.D. Epidemiology of Injuries Requiring Surgery Among High School
Athletes in the United States 2005 to 2010. Trauma 2011, 71, 982–989. [CrossRef]
5. Calabrese, G.J. Pitching mechanics, revisited. Int. J. Sports Phys. Ther. 2013, 8, 652–660.Sensors 2019, 19, 3637 13 of 15
6. Chalmers, P.N.; Erickson, B.J.; D’Angelo, J.; Ma, K.; Romeo, A.A. Epidemiology of Shoulder Surgery Among
Professional Baseball Players. Am. J. Sports Med. 2019, 47, 1068–1073. [CrossRef]
7. Anz, A.W.; Bushnell, B.D.; Griffin, L.P.; Noonan, T.J.; Torry, M.R.; Hawkins, R.J. Correlation of torque and
elbow injury in professional baseball pitchers. Am. J. Sports Med. 2010, 38, 1368–1374. [CrossRef]
8. Braun, S.; Kokmeyer, D.; Millett, P.J. Shoulder injuries in the throwing athlete. JBJS 2009, 91, 966–978. [CrossRef]
9. Putnam, C. A Sequential motions of body segments in striking and throwing skills: Descriptions and
explanations. J. Biomech. 1993, 26 (Suppl. 1), 125–135. [CrossRef]
10. Scarborough, D.M.; Bassett, A.J.; Mayer, L.W.; Berkson, E.M. Kinematic sequence patterns in the overhead
baseball pitch. Sports Biomech. 2018, 14, 1–18. [CrossRef]
11. Fleisig, G.S.; Andrews, J.R.; Dillman, C.J.; Escamilla, R.F. Kinetics of Baseball Pitching with Implications
About Injury Mechanisms. Am. J. Sports Med. 1995, 23, 233–239. [CrossRef]
12. Waltz, E. Rocky Start for Wearables in Professional Sports Games. IEEE Spectrum Online. (Human OS Blog).
15 August 2016. Available online: https://spectrum.ieee.org/the-human-os/biomedical/devices/rocky-start-
to-wearables-in-professional-sports (accessed on 20 August 2019).
13. Lightman, K. Silicon Gets Sporty. IEEE Spectr. 2016, 53, 48–53. [CrossRef]
14. Fleisig, G.S. Editorial Commentary: Changing Times in Sports Biomechanics: Baseball Pitching Injuries and
Emerging Wearable Technology. Arthroscopy 2018, 34, 823–824. [CrossRef] [PubMed]
15. Vicon Website. Available online: http://www.vicon.com (accessed on 27 February 2019).
16. Qualysis Website. Available online: http://www.qualisys.com (accessed on 27 February 2019).
17. Choppin, S.; Wheat, J. The potential of the Microsoft Kinect in sports analysis and biomechanics. Sports
Technol. 2013, 6, 78–85. [CrossRef]
18. Raab, F.H.; Blood, E.B.; Steiner, T.O.; Jones, H.R. Magnetic Position and Orientation Tracking System. IEEE
Trans. Aerosp. Electron. Syst. 1979, 5, 709–718. [CrossRef]
19. Cousins, S.J.; Hannah, R.E.; Foort, J. A clinically viable electrogoniometer. In Proceedings of the 2nd Annual
Interagency Conference on Rehabilitation Engineering, Atlanta, GA, USA, 26–31 August 1979.
20. Danisch, L.A. Patented Measurand Fiber Optic Sensors: Overview and Background Information. White Paper.
25 May 1995. Available online: http://www.shapewrap.com/shapewrap.html (accessed on 15 March 2019).
21. Suh, M. Wearable Sensors for Athletes. In Electronic Textiles—Smart Fabrics and Wearable Technology; Dias, T.,
Ed.; Woodhead Publishing Series in Textiles: Number 166; Elsevier: Amsterdam, The Netherlands, 2015;
Chapter 12; pp. 257–274.
22. Sawchik, T. Plethora of New Tools Shows Analytics’ Growth in MLB. TRIB Live, 26 March 2015. Available
online: http://triblive.com/sports/pirates/9952324-74/pirates-analytics-tools (accessed on 27 February 2019).
23. Baard, M. Northeastern’s Smart Shirt Aims to Prevent Pitcher’s Elbow. The Boston Globe, 1 March 2010;
p. B5. Available online: http://archive.boston.com/business/technology/articles/2010/03/01/northeasterns_
smart_shirt_aims_to_prevent_pitchers_elbow/ (accessed on 16 August 2019).
24. Xsens Technologies Website. Available online: http://www.xsens.com (accessed on 27 February 2019).
25. Synertial UK Ltd. IGS Motion Cobra Suit Website. 2017. Available online: https://synertial.com/products/
suits/ (accessed on 27 February 2019).
26. Motus Global. Motus Baseball. Available online: http://motusglobal.com/motusbaseball.html (accessed on
27 February 2019).
27. Camp, C.L.; Tubbs, T.G.; Fleisig, G.S.; Dines, J.S.; Dines, D.M.; Altchek, D.W.; Dowling, B. The Relationship
of Throwing Arm Mechanics and Elbow Varus Torque: Within-Subject Variation for Professional Baseball
Pitchers across 82,000 Throws. Am. J. Sports Med. 2017, 45, 3030–3035. [CrossRef] [PubMed]
28. Figur8 Website. Available online: https://www.figur8.me/ (accessed on 27 February 2019).
29. Weiser, M. The Computer for the 21st Century. Sci. Am. 1991, 265, 94–104. [CrossRef]
30. Morris, I. Accelerometry—A Technique for the Measurement of Human Body Movements. J. Biomech. 1973,
6, 729–736. [CrossRef]
31. Great Lakes Neurotechnologies. Continuous Parkinson’s Monitoring Using Wearables & App. Available
online: http://glneurotech.com/kinesia/products/kinesia-360/ (accessed on 14 August 2017).
32. Young, A.D.; Ling, M.J.; Arvind, D.K. Orient-2: A realtime wireless posture tracking system using local
orientation estimation. In Proceedings of the 4th Workshop on Embedded Networked Sensors (EmNets ‘07),
Cork, Ireland, 25–26 June 2007; ACM: New York, NY, USA, 2007; pp. 53–57.Sensors 2019, 19, 3637 14 of 15
33. Comotti, D.; Ermidoro, M.; Galizzi, M.; Vitali, A. Development of a Wireless Low-Power Multi-Sensor
Network for Motion Tracking Applications. In Proceedings of the 2013 IEEE International Conference on
Body Sensor Networks, Cambridge, MA, USA, 6–9 May 2013.
34. Arvind, D.K.; Bates, C.A. The Speckled Golfer. In Proceedings of the ICST 3rd International Conference on
Body Area Networks, Tempe, AZ, USA, 13–17 March 2008.
35. Arvind, D.K.; Valtazanos, A. Speckled Tango Dancers: Real-Time Motion Capture of Two-Body Interactions
Using On-body Wireless Sensor Networks. In Proceedings of the Sixth International Workshop on Wearable
and Implantable Body Sensor Networks, Berkeley, CA, USA, 3–5 June 2009; pp. 312–317.
36. Sports Sensing Website. Available online: http://www.sports-sensing.com/products/sensor/dspms.html
(accessed on 15 August 2017).
37. Khan, A.; Nicholson, J.; Plotz, T. Activity Recognition for Quality Assessment of Batting Shots in Cricket
using a Hierarchical Representation. Proc. ACM Interact. Mob. Wearable Ubiquitous Technol. 2017, 1, 62.
[CrossRef]
38. Picerno, P. 25 years of lower limb joint kinematics by using inertial and magnetic sensors: A review of
methodological approaches. Gait Posture 2017, 51, 239–246. [CrossRef]
39. Iosa, M.; Picerno, P.; Paolucci, S.; Morone, G. Wearable inertial sensors for human movement analysis.
Expert Rev. Med. Devices 2016, 13, 641–659. [CrossRef]
40. Fong, D.T.; Chan, Y.Y. The use of wearable inertial motion sensors in human lower limb biomechanics studies:
A systematic review. Sensors 2010, 10, 11556–11565. [CrossRef] [PubMed]
41. Camomilla, V.; Bergamini, E.; Fantozzi, S.; Vannozzi, G. Trends Supporting the In-Field Use of Wearable
Inertial Sensors for Sport Performance Evaluation: A Systematic Review. Sensors 2018, 18, 873. [CrossRef]
[PubMed]
42. Colyer, S.L. A Review of the Evolution of Vision-Based Motion Analysis and the Integration of Advanced
Computer Vision Methods towards Developing a Markerless System. Sports Med. Open 2018, 4, 24. [CrossRef]
[PubMed]
43. Kleppner, D.; Kolenkow, R. An Introduction to Mechanics, 2nd ed.; Cambridge University Press: Cambridge,
UK, 2013.
44. Oyama, S. Baseball pitching kinematics, joint loads, and injury prevention. J. Sport Health Sci. 2012, 1, 80–91.
[CrossRef]
45. Fleisig, G.S.; Barrentine, S.W.; Zheng, N.; Escamilla, R.F.; Andrews, J.R. Kinematic and kinetic comparison of
baseball pitching among various levels of development. J. Biomech. 1999, 32, 1371–1375. [CrossRef]
46. Lapinski, M. A Platform for High-Speed Biomechanical Data Analysis Using Wearable Wireless Sensors.
Ph.D. Dissertation, MIT, Cambridge, MA, USA, 2013.
47. Aylward, R.; Paradiso, J.A. A Compact, High-Speed, Wearable Sensor Network for Biomotion Capture
and Interactive Media. In Proceedings of the Sixth International IEEE/ACM Conference on Information
Processing in Sensor Networks (IPSN 07), Cambridge, MA, USA, 25–27 April 2007; pp. 380–389.
48. Paradiso, J.A.; Hsiao, K.Y.; Benbasat, A.Y.; Teegarden, Z. Design and Implementation of Expressive Footwear.
IBM Syst. J. 2000, 39, 511–529. [CrossRef]
49. Bamberg, S.J.M.; Benbasat, A.Y.; Scarborough, D.M.; Krebs, D.E.; Paradiso, J.A. Gait analysis using a
shoe-integrated wireless sensor system. IEEE Trans. Inf. Technol. Biomed. 2008, 12, 413–423. [CrossRef]
[PubMed]
50. Lapinski, M.; Berkson, E.; Gill, T.; Reinold, M.; Paradiso, J.A. A Distributed Wearable, Wireless Sensor
System for Evaluating Professional Baseball Pitchers and Batters. In Proceedings of the IEEE International
Symposium on Wearable Computers (ISWC 2009), Linz, Austria, 4–7 September 2019; pp. 131–138.
51. Lapinski, M.; Feldmeier, M.; Paradiso, J.A. Wearable Wireless Sensing for Sports and Ubiquitous Interactivity.
In Proceedings of the 2011 IEEE SENSORS Conference, Limerick, Ireland, 28–31 October 2011.
52. Berkson, E.; Aylward, R.; Zachazewski, J.; Paradiso, J.; Gill, T. IMU arrays: The biomechanics of baseball
pitching. Orthop. J. Harv. Med. Sch. 2007, 8, 90–94.
53. Lapinski, M. A Wearable, Wireless Sensor System for Sports Medicine. Master’s Dissertation, MIT, Cambridge,
MA, USA, 2008.
54. Hamill, J.; Selbie, W.S.; Kepple, T. Three-Dimensional Kinetics. In Research Methods in Biomechanics, 2nd ed.;
Robertson, G.E., Caldwell, G.E., Hamill, J., Kamen, G., Whittlesey, S., Eds.; Human Kinetics: Champaign, IL,
USA, 2013.You can also read