A2 Adenosine Receptors Mediate Whole-Body Insulin Sensitivity in a Prediabetes Animal Model: Primary Effects on Skeletal Muscle
←
→
Page content transcription
If your browser does not render page correctly, please read the page content below
ORIGINAL RESEARCH
                                                                                                                                                 published: 28 April 2020
                                                                                                                                         doi: 10.3389/fendo.2020.00262

                                             A2 Adenosine Receptors Mediate
                                             Whole-Body Insulin Sensitivity in a
                                             Prediabetes Animal Model: Primary
                                             Effects on Skeletal Muscle
                                             Joana F. Sacramento 1 , Fátima O. Martins 1 , Tiago Rodrigues 2 , Paulo Matafome 2,3 ,
                                             Maria J. Ribeiro 1 , Elena Olea 4 and Silvia V. Conde 1*
                                             1
                                               CEDOC, NOVA Medical School, Faculdade de Ciências Médicas, Universidade Nova de Lisboa, Lisbon, Portugal, 2 Faculty
                                             of Medicine, Institute of Physiology and Institute of Clinical and Biomedical Investigation of Coimbra (iCBR), University of
                                             Coimbra, Coimbra, Portugal, 3 Escola Superior de Tecnologia da Saúde, Departmento de Ciências Complementares,
                                             Instituto Politécnico de Coimbra, Coimbra, Portugal, 4 Departamento de Bioquímica y Biología Molecular y Fisiología,
                                             Facultad de Medicina, CSIC, Ciber de Enfermedades Respiratorias, CIBERES, Instituto de Biología y Genética Molecular,
                                             Instituto de Salud Carlos III, Universidad de Valladolid, Valladolid, Spain

                          Edited by:
           Carolyn Mary Ecelbarger,          Epidemiological studies showed that chronic caffeine intake decreased the risk of
 Georgetown University, United States        type 2 diabetes. Previously, we described that chronic caffeine intake prevents and
                       Reviewed by:          reverses insulin resistance induced by hypercaloric diets and aging, in rats. Caffeine
                         Xavier Prieur,
INSERM U1087 l’Unité de Recherche
                                             has several cellular mechanisms of action, being the antagonism of adenosine receptors
      de l’Institut du Thorax, France        the only attained with human coffee consumption. Here, we investigated the subtypes
             Anne-Francoise Burnol,          of adenosine receptors involved on the effects of chronic caffeine intake on insulin
              INSERM U1016 Institut
                       Cochin, France        sensitivity and the mechanisms and sex differences behind this effect. Experiments were
                   *Correspondence:          performed in male and female Wistar rats fed either a chow or high-sucrose (HSu) diet
                        Silvia V. Conde      (35% of sucrose in drinking water) during 28 days, to induce insulin resistance. In the
              silvia.conde@nms.unl.pt
                                             last 15 days of diet the animals were submitted to DPCPX (A1 antagonist, 0.4 mg/kg),
                   Specialty section:        SCH58261 (A2A antagonist, 0.5 mg/kg), or MRS1754 (A2B antagonist, 9.5 µg/kg)
         This article was submitted to       administration. Insulin sensitivity, fasting glycaemia, blood pressure, catecholamines, and
    Diabetes: Molecular Mechanisms,
                                             fat depots were assessed. Expression of A1 , A2A , A2B adenosine receptors and protein
               a section of the journal
           Frontiers in Endocrinology        involved in insulin signaling pathways were evaluated in the liver, skeletal muscle, and
       Received: 29 November 2019            visceral adipose tissue. UCP1 expression was measured in adipose tissue. Paradoxically,
           Accepted: 08 April 2020           SCH58261 and MRS1754 decreased insulin sensitivity in control animals, whereas they
           Published: 28 April 2020
                                             both improved insulin response in HSu diet animals. DPCPX did not alter significantly
                             Citation:
          Sacramento JF, Martins FO,
                                             insulin sensitivity in control or HSu animals, but reversed the increase in total and visceral
Rodrigues T, Matafome P, Ribeiro MJ,         fat induced by the HSu diet. In skeletal muscle, A1 , A2A, and A2B adenosine receptor
     Olea E and Conde SV (2020) A2
                                             expression were increased in HSu group, an effect that was restored by SCH58261
       Adenosine Receptors Mediate
   Whole-Body Insulin Sensitivity in a       and MRS1754. In the liver, A1 , A2A expression was increased in HSu group, while A2B
  Prediabetes Animal Model: Primary          expression was decreased, being this last effect reversed by administration of MRS1754.
           Effects on Skeletal Muscle.
            Front. Endocrinol. 11:262.
                                             In adipose tissue, A1 and A2A block upregulated the expression of these receptors. A2
     doi: 10.3389/fendo.2020.00262           adenosine antagonists restored impaired insulin signaling in the skeletal muscle of HSu

Frontiers in Endocrinology | www.frontiersin.org                                    1                                                 April 2020 | Volume 11 | Article 262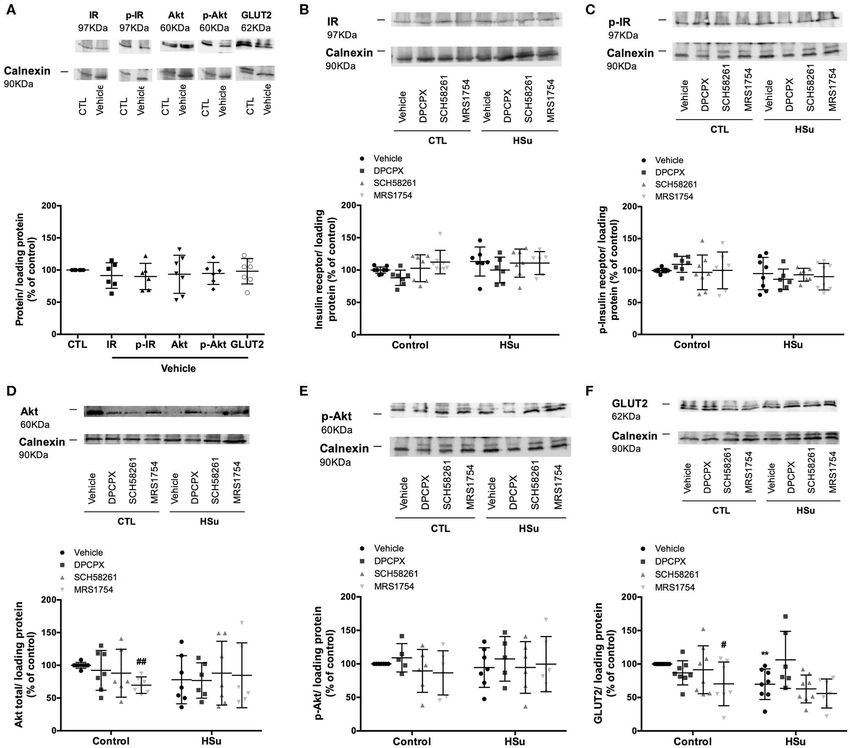
Sacramento et al.                                                                                                     Adenosine Receptors and Insulin Sensitivity

                                             rats, but did not affect liver or adipose insulin signaling. Our results show that adenosine
                                             receptors exert opposite effects on insulin sensitivity, in control and insulin resistant states
                                             and strongly suggest that A2 adenosine receptors in the skeletal muscle are the majors
                                             responsible for whole-body insulin sensitivity.

                                             Keywords: adenosine, adenosine receptors, insulin resistance, insulin signaling, adipose tissue, skeletal muscle,
                                             gender differences

INTRODUCTION                                                                        a stimulatory effect of insulin-induced glucose transport via A1
                                                                                    adenosine receptors (17–19).
In the past decades the prevalence of lifestyle diseases associated                     In isolated rat hepatocytes, activation of A1 adenosine
with metabolic disturbances like insulin resistance and obesity,                    receptors triggers glycogenolysis, whereas the activation of
core features in type 2 diabetes, has increased. Prediabetes and                    adenosine A2A receptors increased gluconeogenesis (20). In
type 2 diabetes are characterized by defects in insulin secretion                   contrast, other studies showed that the stimulation of adenosine
and insulin resistance, which leads to a decrease in whole-body                     A2B receptors augments glycogenolysis and gluconeogenesis (21,
glucose disposal (1). These diseases, seen as men’s illness for                     22). In adipose tissue, it is consensual that adenosine inhibits
decades, presently are more common in women than in men,                            lipolysis and stimulates lipogenesis through A1 adenosine
and obesity has a higher association to insulin-resistance related                  receptors (23–27). This is in agreement with the increase in
risk factors in women than in men. Females tend to be more                          lipolysis, fat oxidation, and thermogenesis observed with caffeine
obese than men (2) with more women being overweight or obese                        intake and which contribute to its protective role in type 2
after the age of 45 year, being this correlated with the higher                     diabetes (28–30).
incidence of insulin resistance and type 2 diabetes in females (2).                     There is accumulating evidences from animal and human
Genetic effects and epigenetic mechanisms, nutritional factors,                     studies showing that central sympathetic overactivity plays
and sedentary lifestyle affect risk and complications differentially                a pivotal role in the etiology and complications of insulin
affect males and females and may be in the origin of sexes                          resistance (31, 32). Activation of sympathetic nerves innervating
differences regarding metabolic diseases (3). Therefore, the study                  the liver produce a rapid and marked production of glucose
of the differential mechanisms on overall insulin sensitivity and                   following a meal but promotes gluconeogenesis when fasted;
metabolism between sexes may contribute to fill the gap in the                      and adrenal medulla activation can also stimulate the release
current knowledge on sex-driven mechanisms, with a major                            of catecholamines to promote hepatic glucose production [for
impact for personalized medicine and societal strategies.                           a review see Conde et al. (33)]. Sympathetic nerves innervating
    Caffeine is the most widely behaviorally active substance                       the skeletal muscle can promote glucose uptake independently
consumed in the world and when consumed chronically appears                         of insulin through activation of β-adrenergic receptors, an
to have minor negative consequences on human health (4).                            effect counteracted by the neuronal stimulation of α-adrenergic
Several epidemiological studies showed that chronic caffeine                        receptors in arterioles, which elicits vasoconstriction (33). Acute
intake decreases the risk of type 2 diabetes in men and women                       caffeine has been shown to promote an increase in muscle
(5–7). Additionally, our group described that chronic caffeine                      sympathetic nervous activity (34). However, chronic caffeine
intake prevents the development of insulin resistance in female                     administration has shown to normalize sympathetic activation
and male rats with prediabetes induced by the hypercaloric diets                    and the levels of circulating catecholamines in rats (8), evidencing
(8) and reversed insulin resistance in aged rats (9).                               opposite roles for acute and chronic caffeine consumption.
    Caffeine has several mechanisms of action at a cellular level,                      Due to the contradictory findings regarding the role of
however the only mechanism achieved with regular human                              adenosine receptors and the beneficial role of chronic caffeine on
caffeine consumption is the antagonism of adenosine receptors                       insulin sensitivity and glucose metabolism, herein, we explored
(4). Adenosine is a product of ATP catabolism, which can                            the effect of 15 days administration of DPCPX, SCH58261, and
be recycled to re-synthesize ATP itself and exerts its action                       MRS1754, an A1 , A2A, and A2B adenosine receptor antagonists,
through four different G-protein coupled receptors, A1 , A2A ,                      in a rodent model of insulin resistance. Additionally, we
A2B, and A3 (10). This mediator is involved in key pathways                         investigated sex differences in the effects of these adenosine
that regulate glucose homeostasis and insulin sensitivity, however                  receptor antagonists on insulin sensitivity and signaling in
its role remains controversial. Adenosine has been described to                     insulin-sensitive tissues and on UCP1 expression in the visceral
be associated with insulin sensitivity and glucose tolerance via                    adipose tissue.
action on adenosine A1 receptors (11). In contrast, Figler et al.
(12) showed that adenosine through A2B adenosine receptors
was involved in insulin resistance and inhibited whole body                         MATERIALS AND METHODS
glucose disposal. In skeletal muscle, in vitro studies described an
inhibitory effect of adenosine on glucose utilization and glucose                   Animals and Experimental Procedures
transport induced by insulin (13–15), an effect that was shown to                   Experiments were performed in Wistar rats (200–420 g) of
be mediated by A1 adenosine receptors (16). In contrast, other                      both sexes, aged 3 months obtained from the vivarium of the
in vitro studies in skeletal muscle showed that adenosine has                       NOVA Medical School|Faculdade de Ciências Médicas of the

Frontiers in Endocrinology | www.frontiersin.org                                2                                             April 2020 | Volume 11 | Article 262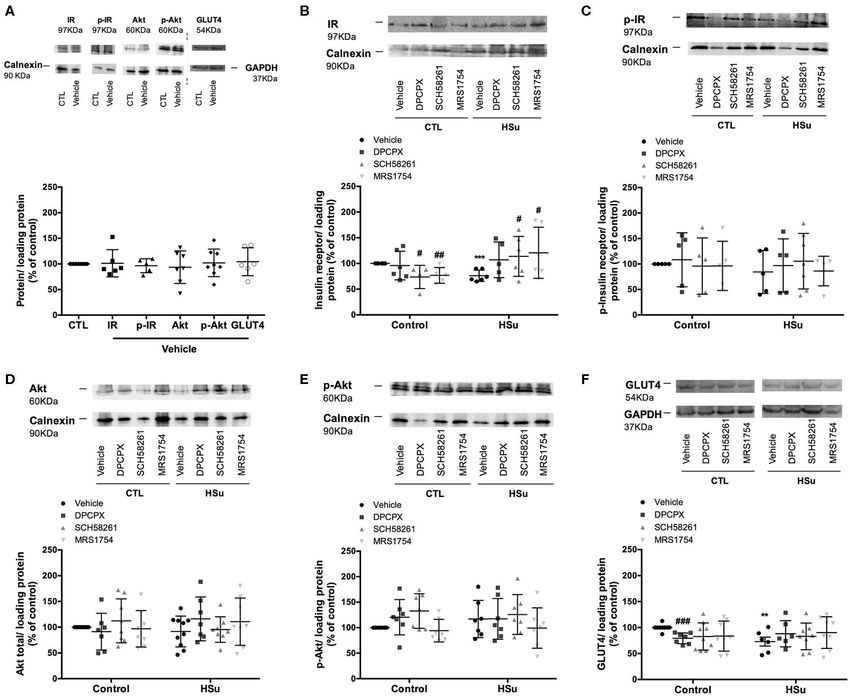
Sacramento et al.                                                                                         Adenosine Receptors and Insulin Sensitivity

Universidade Nova de Lisboa, Lisboa, Portugal. Animals were                OASIS Hlb Wat cartridges (Waters, Milford, MA, USA) and
kept under temperature and humidity control (21 ± 1◦ C; 55                 eluted in 500 µl of mobile phase as previously described
± 10% humidity) and a regular light (08.00–20.00 h) and dark               (38). For quantification of catecholamine content in adrenal
(20.00–08.00 h) cycle, with food and water ad libitum. Animals             medulla, the organs previously frozen were homogenized in 0.6N
were assigned to two groups: the control group that fed a                  perchloric acid, centrifuged at 13,000 g at 4◦ C and collected
standard diet (14.53% protein, 10% fat, 55.06% carbohydrates;              the supernatant. One hundred microliters of the samples were
RM3, SDS - Special Diet Services, UK) and the high-sucrose diet-           directly injected into a high-performance liquid chromatography
fed (HSu) group, that fed the standard diet plus 35% (wt/vol.)             system composed of a Waters 600 controller pump, a Waters
sucrose (PanReac, Madrid, Spain) in drinking water for 28 days,            C18 (particle size 4 µm) column, a Waters 717 plus autosampler,
representing a lean model of combined insulin resistance and               a Bioanalytical Systems LC-4A electrochemical detector (set at
hypertension (35, 36). In the last 15 days of the diet the animals         a holding potential of 0.65 mV and a sensitivity of 1 nA). An
were divided in 3 groups and submitted to the intraperitoneal              isocratic elution was used: the mobile phase consisted of a
administration of DPCPX (A1 antagonist, 0.4 mg/kg; Sigma,                  solution of Na2 HP4 (25 mM) with 6% of methanol (pH 3.55),
Madrid, Spain), SCH58261 (A2A antagonist, 0.5 mg/kg; Tocris                running at a flux of 1 ml/min. The signal coming out of the
Bioscience, UK), or MRS1754 (A2B antagonist, 9.5 µg/kg;                    detector was fed to an analog to digital converter controlled by
Sigma, Madrid, Spain). All adenosine receptors antagonists were            Peak Sample Chromatography System Software (Buck Scientific,
soluble in dimethyl sulfoxide (DMSO), and therefore to take                East Norwalk, CT, USA). Identification and quantification of
into account the effects of DMSO on insulin sensitivity and                catecholamines were done against external standards.
glucose metabolism, a group of control and HSu rats was also
submitted in the last 15 days of the diet to an intraperitoneal
administration of DMSO (Vehicle, dilution 1:3). All test groups            Western Blot Analysis of Adenosine A1 ,
included males and females. Body weight, energy and liquid                 A2A, and A2B Receptors, Insulin Receptor
intake were monitored two times per week. At the end of 28                 (IR), Protein Kinase B (Akt), Glucose
days of diet, animals were tested for insulin sensitivity through an       Transporter Type 4 (GLUT4) or 2 (GLUT2),
insulin tolerance test (ITT) (8, 36). After the ITT, meaning 15 min
post insulin administration, a heart puncture was performed
                                                                           and Uncoupling Protein 1 (UCP1) in
to collect blood, the fat depots were collected and weighted,              Skeletal Muscle, Liver, and Visceral
as well as the insulin sensitive tissues, the liver and skeletal           Adipose Tissue
muscle. The tissues were placed on liquid nitrogen and saved at            Skeletal muscle (50 mg), liver (50 mg), and visceral adipose tissue
−80◦ C, until posterior use. Laboratory care was in accordance             (100 mg) were homogenized in Zurich medium containing a
with the European Union Directive for Protection of Vertebrates            cocktail of protease inhibitors (39). Samples were centrifuged
Used for Experimental and Other Scientific Ends (2010/63/ EU).             (Eppendorf, Madrid, Spain) at 13,000 g for 20 min and the
Experimental protocols were approved by the NOVA Medical                   supernatant was collected and frozen at −80◦ C until further
School|Faculdade de Ciências Médicas Ethics Committee.                     use. The evaluation of adenosine receptors A1 , A2A, and
                                                                           A2B , UCP1, GLUT4, GLUT2, insulin receptor, insulin receptor
Measurement of Insulin Sensitivity                                         phosphorylated at Tyr1361, Akt, and Akt phosphorylated at
The insulin sensitivity was evaluated by the ITT in animals under          Ser473 was performed according to Sacramento et al. (39)
sodium pentobarbital (60 mg/kg, i.p.) anesthesia as previously             and Matafome et al. (40). Briefly, after blocking for 1 h at
described (8, 36). The ITT consists in the administration of               room temperature with 5% non-fat milk in Tris-buffered saline
an intravenous insulin (Humulin, 100 IU/ml, Lilly, Lisboa,                 (TBS), pH 7.4 containing 0.1% Tween 20 (TTBS) (BioRad,
Portugal) bolus of 0.1 U/kg body weight in the tail vein after             Spain), the membranes were incubated overnight at 4◦ C with
an overnight fast, followed by measuring the decline in plasma             the primary antibodies against A1 (1:200), A2A (1:200), A2B
glucose concentration over 15 min. The constant rate for glucose           (1:200), GLUT4 (1:200), GLUT2 (1:200), insulin receptor (1:200)
disappearance (KITT ) was calculated using the formula 0.693/t1/2 .        (Sta Cruz Biotechnology, USA), insulin receptor phosphorylated
Glucose half-time (t1/2 ) was calculated from the slope of the             (phospho-Tyr1361, 1:500; Abcam, UK), Akt (1:1,000, Cell
least square analysis of plasma glucose concentrations during              Signaling, USA), Akt phophorylated (phospho-Ser473, 1:1,000,
the linear decay phase (8, 37). Blood samples were collected               Cell Signaling, USA), and UCP1 (1:1,000, Abcam, USA). The
by tail snip tecnique and glucose levels were measured with                membranes were washed with Tris-buffered saline with 0.1%
a glucometer (Precision Xtra Meter, Abbott Diabetes Care,                  TBST and incubated with donkey anti-goat (1:2,000, Sta Cruz
Portugal) and test strips (Abbott Diabetes Care, Portugal).                Biotechnology, USA) or goat anti-mouse (1:2,000, Sta Cruz
                                                                           Biotechnology, USA) or goat anti-rabbit (1:5,000, Rockland,
                                                                           USA) in TTBS for 2 h at room temperature and developed
Measurement of Plasma Catecholamines                                       with enhanced chemiluminescence reagents according to the
Levels and Adenal Medulla Catecholamine                                    manufacturer’s instructions (ClarityTM Western ECL substrate,
Content                                                                    BioRad, United States). Intensity of the signals was detected
To quantify plasma catecholamines, 500 µl of plasma samples                in a Chemidoc Molecular Imager (Chemidoc; BioRad, Madrid,
were purified and catecholamines were extracted using 30 mg                Spain) and quantified using the Quantity-One software (BioRad,

Frontiers in Endocrinology | www.frontiersin.org                       3                                          April 2020 | Volume 11 | Article 262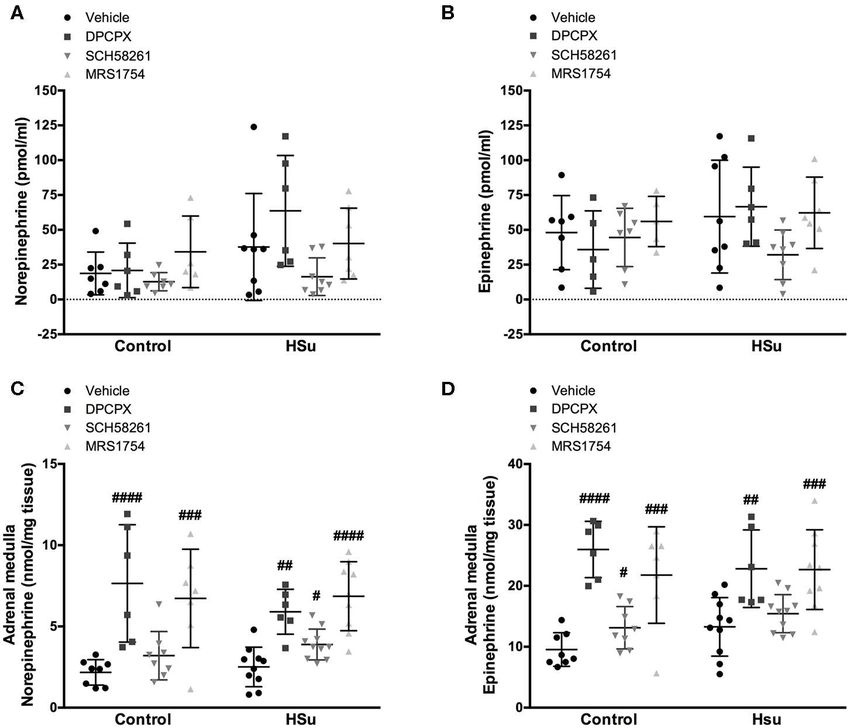
Sacramento et al.                                                                                                                 Adenosine Receptors and Insulin Sensitivity

Madrid). We tested the expression of UCP1 in brown adipose                                 0.47% glucose/min, respectively (Figure 1A). Administration of
tissue (BAT) as positive controls. The membranes were re-probed                            DPCPX, a selective A1 adenosine receptor antagonist, in control
and tested for Calnexin (1:1,000, SicGen, Portugal), α-Tubulin                             animals was unable to change insulin sensitivity (Figure 1A).
(1:1,000, Sta Cruz Biotechnology, USA), or GAPDH (1:250, Sta                               As previously described by Conde et al. (8), ingestion of HSu
Cruz Biotechnology, USA) immunoreactivity (bands in the 90,                                diet during 28 days induced insulin resistance (KITT HSu =
55, and 37 kDa region, respectively) to compare and normalize                              2.41 ± 0.54% glucose/min) (Figure 1A). Chronic administration
the expression of proteins with the amount of protein loaded.                              of DPCPX and SCH58261 improved insulin sensitivity by
Different loading proteins were used in accordance with the                                23.24 and 36.93%, respectively (Figure 1A) in HSu animals.
molecular weight of the protein to be studied or with the tissue                           Moreover, blockade of A2B receptors almost restored insulin
in where protein expression was analyzed.                                                  sensitivity induced by HSu diet (KITT HSu+MRS1754 = 3.84
                                                                                           ± 0.70% glucose/min). These effects of adenosine antagonists
Data Analysis                                                                              on insulin sensitivity in control and HSu groups followed the
Data were analyzed using GraphPad Prism Software, version                                  same pattern if animals were separated by sexes: females and
6 (GraphPad Software Inc., San Diego, CA, EUA) and were                                    males (Figures 1B,C). In control animals, chronic blockade of
presented as mean ± SD. The significance of the differences                                A1 receptors increased significantly by 16.25% fasting glycaemia
between the means was calculated by One and Two-Way                                        (Table 1), whereas the blockade of A2A and A2B receptors did not
Analysis of Variance (ANOVA) with Dunnett’s and Bonferroni                                 produced any alteration. Chronic administration of HSu diet or
multicomparison test, respectively. p-values of 0.05 or less were                          of the different adenosine receptor antagonists did not modify
considered to represent significant differences.                                           significantly fasting glycaemia in HSu animals (Table 1).

RESULTS                                                                                    Effect of Chronic Administration of A1 , A2A,
                                                                                           and A2B Adenosine Receptor Antagonists
Liquid intake (milliliters/day) was similar in all groups of animals
                                                                                           on Weight Gain and Fat Depots
tested and the administration of the vehicle, DPCPX, SCH58261,
                                                                                           HSu diet promoted an increase in weight gain (Figure 2),
and MRS1754 during 15 days did not modify liquid intake or
                                                                                           being the increase higher in males than in females (females
animal behavior within groups (data not shown).
                                                                                           = 2.27 ± 0.55 g/day; males = 3.96 ± 1.21 g/day). None of
Effect of Chronic Administration of A1 , A2A,                                              the adenosine antagonists tested altered weight gain in control
                                                                                           or HSu animals, except the A2B antagonist, that increased by
and A2B Adenosine Receptor Antagonists                                                     211.90 and 244.19% weight gain in control female and male,
on Insulin Sensitivity and Fasting                                                         respectively (Figure 2A).
Glycaemia                                                                                     The effect of chronic administration of adenosine receptor
Figure 1 depicts the effect of chronic adenosine receptor                                  antagonists on total, perienteric/visceral, genital, and perinephric
antagonist administration on insulin sensitivity in control and                            fat in control and HSu males and females is shown in
HSu animals. Chronic blockade of A2A adenosine receptor by                                 Table 2. Male control rats exhibit a higher total fat content
SCH58261 and A2B adenosine receptor by MRS1754 decreased                                   than control females (Table 2). Administration of A1 and
significantly insulin sensitivity in control animals from a control                        A2B blockers did not modify significantly nor the total fat
value of 4.16 ± 0.83 to 3.31 ± 0.91% glucose/min and to 2.52 ±                             amount neither the deposition of fat in the distinct fat depots,

 FIGURE 1 | Effect of chronic administration of A1 , A2A, and A2B adenosine receptor antagonists on insulin sensitivity in control and high-sucrose (HSu) animals. (A)
 Insulin sensitivity in animals of both sexes; (B,C) Gender differences in insulin sensitivity in control and HSu animals, respectively. Insulin sensitivity was determined by
 the insulin tolerance test (ITT) and expressed as constant for glucose disappearance (KITT ). Vehicle (DMSO, dilution 1:3), DPCPX (A1 antagonist, 0.4 mg/kg),
 SCH58261 (A2A antagonist, 0.5 mg/kg), and MRS1754 (A2B antagonist, 9.5 µg/kg) were administered i.p. during 15 days. Values represent mean±SD of 8–11
 animals of both sexes. One- and Two-Way ANOVA with Dunnett’s and Bonferroni multicomparison tests, respectively: ****p < 0.0001 vs. vehicle (control); #p < 0.05,
 ##p < 0.01 and ###p < 0.001 comparing values with vehicle in the same group.

Frontiers in Endocrinology | www.frontiersin.org                                       4                                                   April 2020 | Volume 11 | Article 262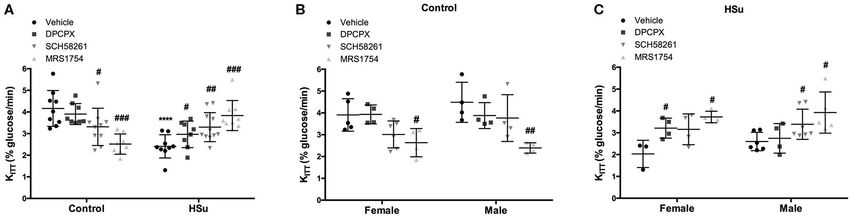
Sacramento et al.                                                                                                            Adenosine Receptors and Insulin Sensitivity

TABLE 1 | Effect of chronic A1 , A2A, and A2B adenosine receptor antagonist administration on fasting glycemia, in male and female rats submitted to a standard diet and
to a high sucrose (HSu) diet.

            Treatment                                  Vehicle                          DPCPX                           SCH58261                          MRS1754

Control                All animals                  86.66 ± 10.90                  100.75 ± 10.05*                    82.29 ± 4.39                       84.13 ± 4.61
                       Females                      87.00 ± 12.35                  102.75 ± 10.90                     82.00 ± 4.56                       83.25 ± 4.19
                       Males                        86.25 ± 10.63                   99.50 ± 10.72                     82.50 ± 4.57                       85.00 ± 5.48

HSu                    All animals                 100.00 ± 20.82                  108.25 ± 7.76                      91.64 ± 9.87                       93.77 ± 10.27
                       Females                     105.00 ± 35.66                  105.50 ± 7.04                      89.75 ± 9.98                       97.25 ± 9.43
                       Males                        97.50 ± 13.81                  111.00 ± 8.40                      92.71 ± 10.44                      91.00 ± 11.09

Values represent mean±SD of 8–11 animals of both sexes. Vehicle (DMSO, dilution 1:3); DPCPX (A1 antagonist, 0.4 mg/kg), SCH58261 (A2A antagonist, 0.5 mg/kg), and MRS1754
(A2B antagonist, 9.5 µg/kg). One- and Two-Way ANOVA with Dunnett’s and Bonferroni multicomparison tests, respectively: * p < 0.05 vs. vehicle.

 FIGURE 2 | Effect of chronic A1 , A2A and A2B adenosine receptor antagonist administration on body-weight increment, calculated as total weight variation during the
 experiment period. (A) Gender differences in weight increment in control and HSu female and male animals. (B) Weight gain in animals of both sexes. Vehicle (DMSO,
 dilution 1:3), DPCPX (A1 antagonist, 0.4 mg/kg), SCH58261 (A2A antagonist, 0.5 mg/kg), and MRS1754 (A2B antagonist, 9.5 µg/kg) were administered i.p. during 15
 days. Values represent mean±SD of 8–12 animals of both sexes. One- and Two-Way ANOVA with Dunnett’s and Bonferroni multicomparison tests, respectively: **p <
 0.01, ***p < 0.001 and ****p < 0.0001 vs. vehicle (control); ###p < 0.001 comparing values with vehicle in the same group.

genital, perienteric, or perinephric in control males or females.                      Effect of Chronic Administration of A1 , A2A,
Chronic administration of A2A blocker increased by 50.39%                              and A2B Adenosine Receptor Antagonists
and decreased by 18.41% total fat amount, in control female
                                                                                       on Plasma and Adrenal Medulla
and male animals, respectively (Table 2). These effects might
be due to the 111.98% increase in the genital fat of female                            Catecholamines
rats and to the 27.80% decrease in the perienephric fat of                             To evaluate the effect of chronic administration of A1 ,
control males (Table 2). Interestingly, female HSu rats exhibit                        A2A, and A2B adenosine receptor antagonists on sympathetic
a higher total fat content than HSu males (Table 2). In HSu                            nervous system activity, we measured both circulating and
                                                                                       adrenal medulla catecholamines content in control and HSu
females, chronic A1 blockade decreased by 29.61, 22.10, 24.38,
                                                                                       animals (Table 3 and Figure 3). Values are presented in Table 3
and 43.55% the total, perienteric, genital, and perinephric fat,
                                                                                       separated by sexes and in Figure 3 plotted together. As
respectively, while A2B blockade increased by 20.75% the total                         expected and previously described (36) HSu diet increased
fat (Table 2). In male HSu animals, chronic administration of                          plasma catecholamines and adrenal medulla Epi content
A2A and A2B antagonists increased by 24.19 and 20.10% the                              (Figures 3A–C). Chronic administration of adenosine receptor
total fat, respectively, and by 25.32 and 22.59% the perinephric                       antagonists did not modify circulating NE and Epi in both control
fat, respectively (Table 2). Concluding, male control rats exhibit                     and HSu animals (Figures 3A,B). Control animals submitted
higher total fat content than females, in contrast to what                             to chronic A1 and A2B adenosine receptor blockade exhibited
happens in HSu diet in which females exhibit more fat                                  significant increases of 252.07 and 209.68% in adrenal medulla
content than males. A1 receptor blockade in insulin resistant                          NE, respectively, and of 172.22 and 128.30% in adrenal medulla
states lead to fat loss in female rats while the blockade of                           Epi content, respectively, compared with the control animals (NE
A2 receptors lead to an increase in total fat both in males                            control vehicle = 2.17 ± 0.78 nmol/mg tissue; Epi control vehicle
and females.                                                                           = 9.54 ± 2.76 nmol/mg tissue) (Figures 3C,D). Chronic A1

Frontiers in Endocrinology | www.frontiersin.org                                   5                                                  April 2020 | Volume 11 | Article 262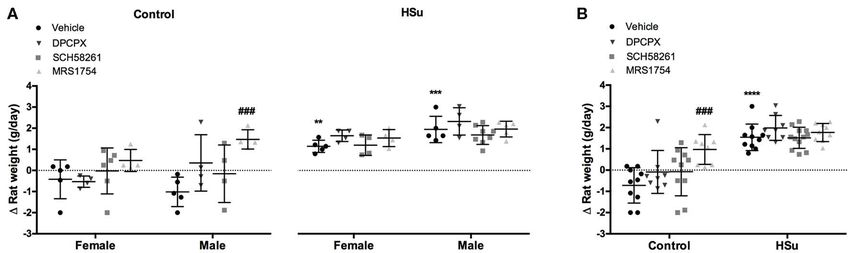
Sacramento et al.                                                                                                                Adenosine Receptors and Insulin Sensitivity

TABLE 2 | Effect of chronic A1 , A2A, and A2B adenosine receptor antagonist administration on total, visceral/perienteric, genital, and perinephric fat in control and
high-sucrose (HSu) female and male animals.

            Treatment                              Vehicle                           DPCPX                            SCH58261                           MRS1754

Female      CTL        Total                   31.83 ± 8.93                       25.78 ± 9.47                      47.87 ± 9.59##                     49.59 ± 33.22
                       Perienteric              7.75 ± 3.15                        4.63 ± 2.33                        8.12 ± 1.78                      26.48 ± 22.27
                       Genital                 12.85 ± 1.72                       13.92 ± 3.09                      27.24 ± 6.92##                     48.13 ± 11.50
                       Perinephric             11.23 ± 6.03                        7.22 ± 5.50                      12.51 ± 1.64                       13.26 ± 4.64
            HSu        Total                   72.71 ± 13.85***,§§                50.34 ± 7.47###                   83.68 ± 8.45                       87.80 ± 5.65#
                       Perienteric              9.57 ± 2.46                        6.74 ± 1.56                      13.46 ± 1.32                       12.44 ± 1.57
                       Genital                 37.15 ± 7.75                       28.94 ± 4.19                      44.82 ± 8.56                       45.98 ± 4.11
                       Perinephric             25.99 ± 5.29                       14.67 ± 2.98##                    25.40 ± 1.44                       29.38 ± 3.72

Male        CTL        Total                   44.27 ± 1.18§                      46.71 ± 4.81                      36.12 ± 1.72##                     47.43 ± 4.03
                       Perienteric              6.59 ± 0.23                        7.22 ± 0.89                        6.06 ± 0.25                        7.17 ± 0.30
                       Genital                 16.96 ± 0.69                       18.37 ± 2.27                      15.08 ± 0.59                       19.00 ± 1.15
                       Perinephric             20.72 ± 1.29                       21.11 ± 2.05                      14.96 ± 1.07#                      21.26 ± 1.15
            HSu        Total                   51.64 ± 5.92                       47.02 ± 1.32                      64.13 ± 5.51####                   62.02 ± 8.25###
                       Perienteric              8.49 ± 1.06                        7.82 ± 0.68                        9.95 ± 1.49                        8.40 ± 1.36
                       Genital                 18.98 ± 2.11                       16.57 ± 2.98                      23.88 ± 1.84                       21.87 ± 3.69
                       Perinephric             24.17 ± 3.21                       22.63 ± 1.96                      30.29 ± 3.66#                      29.63 ± 3.01#

Values represent mean±SD of 4–8 animals. Vehicle (DMSO, dilution 1:3); DPCPX (A1 antagonist, 0.4 mg/kg), SCH58261 (A2A antagonist, 0.5 mg/kg), and MRS1754 (A2B antagonist,
9.5 µg/kg). One- and Two-Way ANOVA with Dunnett’s and Bonferroni multicomparison tests, respectively: *** p < 0.001 vs. control values in the same sex; #p < 0.05, ##p < 0.01,
###p < 0.001, and ####p < 0.0001 comparing values with vehicle in the same group; § p < 0.05; §§ p < 0.01 comparing female with male animals.

TABLE 3 | Effect of chronic A1 , A2A, and A2B adenosine receptor antagonist administration on circulating and adrenal medulla catecholamines, norepinephrine and
epinephrine, in male and female rats submitted to a standard diet and to a high sucrose diet.

                  Treatment                                  Vehicle                         DPCPX                          SCH58261                         MRS1754

Plasma              CTL        NE    Females            20.74 ± 16.99                     43.15 ± 15.77                    10.72 ± 4.80                    49.59 ± 33.22
                                     Males              13.63 ± 13.64                       9.7 ± 7.65                     17.76 ± 9.76                    26.48 ± 22.27
                               Epi   Females            53.69 ± 28.38                     60.61 ± 17.83                    48.63 ± 22.21                   48.13 ± 11.50
                                     Males              40.50 ± 27.70                     26.46 ± 21.15                    34.33 ± 18.95                   55.97 ± 20.82
                    HSu        NE    Females            36.32 ± 0.36                      46.21 ± 34.58                    22.19 ± 21.98                   32.47 ± 29.13
                                     Males              38.49 ± 11.48                     98.41 ± 26.49                    14.42 ± 11.83                   45.90 ± 25.10
                               Epi   Females            84.73 ± 24.87                     63.52 ± 35.71                    42.57 ± 7.15                    52.49 ± 32.29
                                     Males              44.36 ± 42.42                     72.93 ± 9.39                     28.64 ± 19.39                   69.56 ± 21.30

Adrenal medulla     CTL        NE    Females             1.89 ± 0.82                       6.30 ± 4.18                      3.25 ± 1.74                      5.27 ± 2.98
                                     Males               2.45 ± 0.74                       9.00 ± 3.12##                    3.05 ± 0.46                      8.65 ± 2.10#
                               Epi   Females             9.30 ± 3.47                      22.12 ± 2.85##                   14.03 ± 3.48                    18.80 ± 9.43#
                                     Males               9.79 ± 2.35                      29.81 ± 0.88####                 10.38 ± 2.03                    25.75 ± 3.68###
                    HSu        NE    Females             1.70 ± 0.95                       5.53 ± 1.60###                   3.97 ± 1.02#                     5.06 ± 1.49##
                                     Males               2.87 ± 1.34                       6.65 ± 0.44##                    3.54 ± 0.76                      8.30 ± 1.23####
                               Epi   Females            11.92 ± 7.07                      21.95 ± 5.80###                  12.10 ± 0.14#                   18.84 ± 6.07##
                                     Males              12.92 ± 3.92                      24.54 ± 9.63                     16.26 ± 2.93                    25.72 ± 5.63##

Values represent mean±SD of 4–8 animals. Vehicle (DMSO, dilution 1:3); DPCPX (A1 antagonist, 0.4 mg/kg), SCH58261 (A2A antagonist, 0.5 mg/kg), and MRS1754 (A2B antagonist,
9.5 µg/kg). Two-Way ANOVA with Bonferroni multicomparison tests, respectively: #p < 0.05, ##p < 0.01, ###p < 0.001, and ####p < 0.0001 comparing values with vehicle in the
same group.

and A2B adenosine receptor blockade also increased significantly                          increase of 37.52% in adrenal medulla Epi content in control
the adrenal medulla NE and Epi content in HSu animals                                     animals (Figure 3D) and of 47.47% in adrenal medulla NE
(Figures 3C,D). SCH58261 chronic administration induced an                                content in HSu animals (Figure 3C).

Frontiers in Endocrinology | www.frontiersin.org                                      6                                                   April 2020 | Volume 11 | Article 262
Sacramento et al. Adenosine Receptors and Insulin Sensitivity
FIGURE 3 | Effect of chronic A1 , A2A, and A2B adenosine receptor antagonist administration on circulating catecholamines, norepinephrine and epinephrine, and on
adrenal medulla norepinephrine and epinephrine content. (A,B) Shows respectively the impact of 15 days of A1 , A2A, and A2B adenosine receptor antagonist
administration on circulating catecholamines, norepinephrine, and epinephrine. (C,D) Shows respectively the impact of 15 days of A1 , A2A, and A2B adenosine
receptor antagonist administration on adrenal medulla norepinephrine and epinephrine content. Vehicle (DMSO, dilution 1:3), DPCPX (A1 antagonist, 0.4 mg/kg),
SCH58261 (A2A antagonist, 0.5 mg/kg), and MRS1754 (A2B antagonist, 9.5 µg/kg) were administrated i.p. during 15 days. Values represent mean±SD of 6–11
animals. One- and Two-Way ANOVA with Dunnett’s and Bonferroni multicomparison tests, respectively: #p < 0.05, ##p < 0.01, ###p < 0.001, ####p < 0.0001
comparing values with vehicle in the same group.
Effect of Chronic Administration of A1 , A2A, of SCH58261 and MRS1754, respectively (Figure 4A2). The
and A2B Adenosine Receptor Antagonists expression of A1 adenosine receptors was also increased by
36.33% with the HSu diet, but chronic DPCPX administration
on A1 , A2A, and A2B Expression
did not altered A1 receptor expression in skeletal muscle
No significant changes were observed for the effect of chronic
(Figure 4A2).
DPCPX, SCH58261, and MRS1754 administration on the
In the liver, chronic administration of DPCPX, SCH58261,
expression of A1 , A2A, and A2B in insulin sensitive tissues
and MRS1754 in control animals did not modify the expression
expressed by sex (data not shown), thereby the results of female
of A1 , A2A, and A2B adenosine receptors, respectively
and male animals were plotted together (Figure 4). DMSO
can interfere with various cellular processes (41), but herein (Figure 4B2). HSu diet increased by 73.64 and 16.47% (p
DMSO did not modify the expression of A1 , A2A, and A2B in = 0.091) the expression of A1 and A2A adenosine receptors,
skeletal muscle, liver, and adipose tissue (Figures 4A1,B1,C1). respectively (Figure 4B2), but decreased by 23.17% the
Chronic DPCPX and SCH58261 increased significantly by 44.72 expression of adenosine A2B receptors, being this last effect
and 65.82% the expression of A1 , respectively, in the skeletal restored by chronic MRS1754 administration (Figure 4B2).
muscle from control animals (Figure 4A2). Additionally, chronic Following the same profile than the skeletal muscle, in the
SCH58261 administration increased by 34.85% the expression adipose tissue from control animals, chronic administration of
of A2A receptors, but MRS1754 did not alter the expression of DPCPX and SCH58261 increased by 60.44 and 37.54% the
the different adenosine receptors in skeletal muscle (Figure 4A2). expression of A1 and A2A adenosine receptors, respectively.
HSu diet itself caused a significant increase of 78.57 and 18.18% in Although in this tissue the administration of MRS1754
the expression of A2A and A2B adenosine receptors, respectively, decreased by 22.80% the expression of A2B adenosine receptors
an effect that was restored by the chronic administration (Figure 4C2). HSu diet or the administration of DPCPX,
Frontiers in Endocrinology | www.frontiersin.org 7 April 2020 | Volume 11 | Article 262Sacramento et al. Adenosine Receptors and Insulin Sensitivity
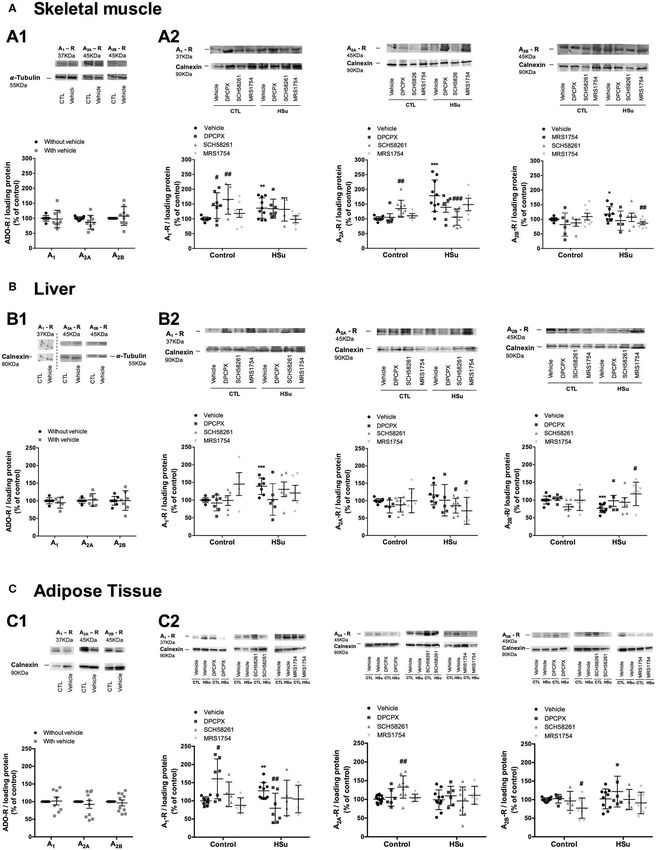
FIGURE 4 | Effect of chronic A1 , A2A, and A2B adenosine receptor antagonist administration on the expression of its receptors on the insulin sensitivity tissues, skeletal
muscle, liver, and visceral fat. (A1,B1,C1) Shows respectively the impact of vehicle administration on the expression of the adenosine tested in the skeletal muscle,
(Continued)
Frontiers in Endocrinology | www.frontiersin.org 8 April 2020 | Volume 11 | Article 262Sacramento et al. Adenosine Receptors and Insulin Sensitivity FIGURE 4 | liver, and visceral fat of control animals. (A2,B2,C2) Shows respectively the impact of 15 days of A1 , A2A, and A2B adenosine receptor antagonist administration on adenosine receptor expression in the skeletal muscle, liver, and visceral fat of control and HSu animals in relation to the expression of the loading protein. Vehicle (DMSO, dilution 1:3), DPCPX (A1 antagonist, 0.4 mg/kg), SCH58261 (A2A antagonist, 0.5 mg/kg), and MRS1754 (A2B antagonist, 9.5 µg/kg) were administrated i.p. during 15 days. Values represent mean±SD of 5–10 animals. One- and Two-Way ANOVA with Dunnett’s and Bonferroni multicomparison tests, respectively: *p < 0.05, **p < 0.01, and ***p < 0.001, vs. vehicle (control); #p < 0.05, ##p < 0.01, and ###p < 0.001 comparing values with vehicle in the same group. FIGURE 5 | Effect of chronic A1 , A2A, and A2B adenosine receptor antagonist administration on insulin signaling pathways in the skeletal muscle. (A) Effect of the vehicle, DMSO, on insulin signaling pathways in control animals. Average relative (B) insulin receptor levels (97 kDa band), (C) insulin receptor phosphorylation (97 kDa band), (D) Akt levels (60 kDa band), (E) Akt phosphorylation (60 kDa band), and (F) GLUT4 (54 kDa band) immunoreactivity in skeletal muscle from control and HSu animals with or without chronic A1 , A2A, and A2B adenosine receptor antagonist administration in relation to the expression of the loading protein. Representative western blots for each protein studied are depicted above the respective graphs. Vehicle (DMSO, dilution 1:3), DPCPX (A1 antagonist, 0.4 mg/kg), SCH58261 (A2A antagonist, 0.5 mg/kg), and MRS1754 (A2B antagonist, 9.5 µg/kg) were administrated i.p. during 15 days. Values represent mean±SD of 5–10 animals. One- and Two-Way ANOVA with Dunnett’s and Bonferroni multicomparison tests, respectively: **p < 0.01 and ***p < 0.001 vs. vehicle (control); #p < 0.05, ##p < 0.01, and ###p < 0.001 comparing values with vehicle in the same group. SCH58261, and MRS1754 in this insulin-resistant animal model HSu diet increased A1 , A2A, and A2B receptor expression did not modify the expression of A1 , A2A, and A2B receptors in the skeletal muscle, increased A1 receptor expression and in adipose tissue (Figure 4C2). Generally and as expected, the decreased A2B in the liver, and increased A1 in the adipose selective blockade of the different adenosine receptors produced tissue, effects that were rescued by the blockade of the respective an upregulation of these receptors in insulin sensitive tissues. adenosine receptors. Frontiers in Endocrinology | www.frontiersin.org 9 April 2020 | Volume 11 | Article 262
Sacramento et al.                                                                                                              Adenosine Receptors and Insulin Sensitivity

 FIGURE 6 | Effect of chronic A1 , A2A, and A2B adenosine receptor antagonist administration on insulin signaling pathways in the liver. (A) Effect of the vehicle, DMSO,
 on insulin signaling pathways in control animals. Average relative (B) insulin receptor levels (97 kDa band), (C) insulin receptor phosphorylation (97 kDa band), (D) Akt
 levels (60 kDa band), (E) Akt phosphorylation (60 kDa band), and (F) GLUT2 (62 kDa band) immunoreactivity in the liver from control and HSu animals with or without
 chronic A1 , A2A, and A2B adenosine receptor antagonist administration in relation to the expression of the loading protein. Representative western blots for each
 protein studied are depicted above the respective graphs. Vehicle (DMSO, dilution 1:3), DPCPX (A1 antagonist, 0.4 mg/kg), SCH58261 (A2A antagonist, 0.5 mg/kg),
 and MRS1754 (A2B antagonist, 9.5 µg/kg) were administrated i.p. during 15 days. Values represent mean±SD of 5–10 animals. One- and Two-Way ANOVA with
 Dunnett’s and Bonferroni multicomparison tests, respectively: **p < 0.01 vs. vehicle (control); #p < 0.05 and ##p < 0.01 comparing values with vehicle in the same
 group.

Effect of Chronic A1 , A2A, and A2B                                                      modify the levels and activity of insulin receptor, Akt and
Adenosine Receptor Antagonist                                                            GLUT4 levels in the skeletal muscle, liver, and adipose tissue
                                                                                         (Figures 5–7A). In the skeletal muscle from control animals,
Administration on Insulin Signaling                                                      chronic administration of SCH58261 and MRS1754 decreased
Pathways                                                                                 significantly by 26.27 and 23.21% insulin receptor levels
No sex differences were seen for effect of chronic DPCPX,                                (Figure 5B). Insulin receptor phosphorylation, Akt levels and
SCH58261, and MRS1754 administration on insulin signaling                                phosphorylation did not change with chronic administration of
pathways, and therefore results were expressed together                                  the different adenosine receptor antagonists in control animals
(Figures 5–7). DMSO, the vehicle used in this study, did not                             (Figures 5C–E). GLUT4 levels in control animals decreased

Frontiers in Endocrinology | www.frontiersin.org                                    10                                                  April 2020 | Volume 11 | Article 262
Sacramento et al. Adenosine Receptors and Insulin Sensitivity
FIGURE 7 | Effect of chronic A1 , A2A, and A2B adenosine receptor antagonist administration on insulin signaling pathway and UCP1 expression in the
visceral/perienteric adipose tissue. (A) Effect of the vehicle, DMSO, on insulin signaling pathways in control animals. Average relative (B) insulin receptor levels (97 kDa
band), (C) insulin receptor phosphorylation (97 kDa band), (D) Akt levels (60 kDa band), (E) Akt phosphorylation (60 kDa band), (F) GLUT4 (54 kDa band), and (G)
UCP1 (33 kDa band) immunoreactivity in white visceral adipose tissue (WAT) from control and HSu animals with or without chronic A1 , A2A, and A2B adenosine
receptor antagonist administration in relation to the expression of the loading protein. Representative western blots for each protein studied are depicted above the
respective graphs. A positive control for UCP1 in brown adipose tissue (BAT) was used (G). Vehicle (DMSO, dilution 1:3), DPCPX (A1 antagonist, 0.4 mg/kg),
SCH58261 (A2A antagonist, 0.5 mg/kg), and MRS1754 (A2B antagonist, 9.5 µg/kg) were administrated i.p. during 15 days. Values represent mean±SD of 5–10
animals. One- and Two-Way ANOVA with Dunnett’s and Bonferroni multicomparison tests, respectively: #p < 0.05, ##p < 0.01, and ###p < 0.001, comparing values
with vehicle in the same group.
by 20.68, 17.29, and 16.40% with chronic DPCPX, SCH58261, In the visceral/perienteric adipose tissue, chronic
and MRS1754 administration, respectively (Figure 5F). As administration of DPCPX in control animals increased
expected and consistent with the development of insulin insulin receptor levels and its phosphorylation, Akt levels and its
resistance, HSu diet decreased insulin receptor expression and phosphorylation by 36.81, 36.00, 28.86, and 36.10%, respectively,
GLUT4 levels by 23.89 and by 27.00%, respectively, without without altering Glut4 levels (Figures 7B–F). In contrast, chronic
any effect on insulin receptor and Akt phosphorylation. In HSu MRS1754 administration decreased by 17.92 and 28.28% insulin
animals, chronic administration of DPCPX, SCH58261, and receptor values and Akt levels, respectively (Figures 7B,D).
MRS1754 increased by 40.81 (p = 0.066), 49.52 and 58.68% Moreover, chronic SCH58261 administration decreased by
insulin receptor levels (Figure 5B). Chronic administration 26.60% Akt levels (Figure 7D). HSu diet per se was unable to
of the different adenosine receptor antagonists did not alter the levels and activity of insulin receptor, Akt and GLUT4
modify insulin receptor and Akt phosphorylation and GLUT4 levels (Figures 7B–F). In HSu animals, insulin receptor levels
levels (Figures 5C,E,F). and its phosphorylation decreased by 36.91 and 26.31% with
In the liver in control animals, chronic administration chronic administration of SCH58261 and DPCPX, respectively
of DPCPX and SCH58261 did not modify insulin receptor, (Figures 7B,C). Chronic DPCPX and SCH58261 administration
Akt levels and their phosphorylation, whereas MRS1754 decreased by 30.71 and 36.55% Akt levels and by 64.83 and
administration decreased by 30.31 and 29.66% Akt and GLUT2 33.48% Akt phosphorylation, respectively, although this last
levels, respectively (Figures 6B–F). HSu diet ingestion during 4 effect of SCH58261 on Akt phosphorylation was non–significant
weeks did not alter levels and phosphorylation of insulin receptor (Figures 7D,E). MRS1754 only decreased Akt values by 38.43%
and Akt, while decreased GLUT2 levels by 52.27% in liver, an (Figures 7D,E). Also, in the adipose tissue from HSu animals,
effect restored with the chronic administration of DPCPX (p = chronic DPCPX administration decreased by 23.56% GLUT4
0.060) (Figures 6B–F). levels (Figure 7F).
Frontiers in Endocrinology | www.frontiersin.org 11 April 2020 | Volume 11 | Article 262Sacramento et al. Adenosine Receptors and Insulin Sensitivity
Effect of Selective Adenosine Receptor in the adipose tissue are majors contributors for the whole-
Blockade on UCP1 Expression in the body insulin sensitivity and that in the context of lean insulin
resistance, as the HSu hypercaloric diet, the effect of adenosine on
Visceral Adipose Tissue
insulin action on skeletal muscle is more relevant than the effect
One of the mechanisms described to be associated with the
of adenosine on adipose tissue.
beneficial caffeine consumption on metabolism is the increase in
thermogenesis (29). The innervation of the brown adipose tissue
by the sympathetic nervous system function as the principal Role of Adenosine Receptors on
stimulator of brown adipose tissue thermogenesis, being the Whole-Body Insulin Sensitivity and Action
activation of the sympathetic nervous system known also as one The present study was focused on adenosine A1 , A2A, and A2B
of the main triggers for the browning/beiging of the white adipose receptors, since the role of A3 adenosine receptors on insulin
tissue (42). The beiging of the visceral white adipose tissue was sensitivity and glucose homeostasis is not completely elucidated
evaluated as the expression of UCP1. From the observation of (43). Paradoxically, while in control animals, chronic blockade of
Figure 7G in the representative western blots and as expected, A2A and A2B receptor induced insulin resistance in HSu animals,
it is clear that the levels of UCP1 expression in the visceral a model of insulin resistance, administration of these antagonists
adipose tissue are quite small in comparison with the levels of almost prevented insulin resistance, an effect similar between
expression in brown adipose tissue. Also, HSu diet did not modify females and males. These results suggest that the beneficial effects
UCP1 expression in the visceral adipose tissue (p = 0.400) as of chronic caffeine consumption, a non-selective adenosine
well as none of the adenosine receptor antagonists changed the receptor antagonist, in lowering the risk of develop type 2
expression of UCP1 (Figure 7G). diabetes (5–7), might be mediated by adenosine A2 receptors,
with a minor contribution from A1 adenosine receptors.
In control animals, chronic blockade of A1 receptor, showed
DISCUSSION a tendency to increase fasting glycaemia, which might suggest
that in control animals, adenosine acting on A1 receptors might
In the present study, we demonstrated that adenosine receptors
contribute to improve glucose metabolism. This is in agreement
exhibit opposite effects on insulin sensitivity, as chronic
with the findings of Faulhaber-Walter et al. (11) evidencing that
adenosine antagonists in control animals promote insulin
A1 receptor deletion impair glucose metabolism and with our
resistance meaning that adenosine is an insulin-sensitizer
results that show that blockade of A1 receptors worse insulin
and that in insulin-resistant conditions, in HSu animals,
signaling dysfunction in the adipose tissue in HSu animals
chronic antagonists rescue the insulin-resistance phenotype.
(Figure 7), but differ from the increase in insulin signaling
Additionally, we showed that the role of adenosine receptors in
pathways in control animals (Figure 7), reflecting once more the
whole-body insulin sensitivity is manly mediated by adenosine
opposite effects in control vs. disease conditions. In contrast,
A2 receptors, with a contribution from adenosine A1 receptors,
blockade of A2A and A2B receptors showed a tendency to decrease
an effect similar between female and male animals. Consistent
the heightened levels of glucose induced by the HSu diet, which
with these findings, A2A and A2B adenosine receptors antagonists
may be an indirect consequence of improved peripheral insulin
rescued impaired insulin signaling pathways in the skeletal
sensitivity (Figure 1). We can conclude that adenosine receptors
muscle. In contrast, the antagonists tested herein did not
exert opposite actions in modulating insulin action in control and
alter significantly insulin signaling in the liver, except the A2B
insulin resistant animals, with A2 chronic adenosine receptors
antagonist that decreased Akt and GLUT2 expression in control
antagonists promoting insulin resistance in control animals and
animals, and contribute for the deregulation of insulin signaling
rescuing this phenotype in insulin-resistance states.
pathways in the adipose tissue in HSu animals. In agreement
with the improvement of insulin signaling pathways in the
skeletal muscle of HSu animals, these animals showed increased Role of Adenosine Receptors in Weight,
expression of A2A and A2B receptor expression that was restored Fat Deposition, and Metabolism
with the chronic blocking of these receptors. The effect of adenosine and its receptors in weight and body
We also show that the effect of chronic adenosine blockade fat deposition are not consensual, with some studies showing
on fat depots was different between females and males, with that the loss of adenosine A1 and A2B receptors promote an
fat depots accumulation being decreased in female HSu animals increase in weight gain and fat deposition (11, 44) and that
submitted to the inhibition of A1 adenosine receptors, while long-term caffeine consumption is associated with weight loss
increased with the inhibition of A2A and A2B adenosine receptors in rodents and humans (45), effects that are not observed in
in male HSu animals. HSu hypercaloric diet promoted the other studies [e.g., Astrup et al. (29)]. Here, we show that in
overexpression of A1 receptors in the adipose tissue, an, effect control animals, chronic blockade of A2B receptors increased
rescued by A1 receptors blockade. Chronic A1 and A2B adenosine weight gain with a higher impact in male animals (Figure 2),
blocking induced an increase in sympatho-adrenal activity that an effect that cannot be attributed to an increase in fat mass
did not correlate with the activation of the thermogenesis in the (Table 2). This effect is in agreement with the study by Csóka et al.
white adipose tissue. (44), in where mice lacking A2B receptors increased weight gain,
All together, the results herein described strongly suggest that however due to an increase in retroperitoneal and epididymal
A2 adenosine receptors in the skeletal muscle and A1 receptors fat mass. Surprisingly, chronic A2A blockade, increased total
Frontiers in Endocrinology | www.frontiersin.org 12 April 2020 | Volume 11 | Article 262Sacramento et al. Adenosine Receptors and Insulin Sensitivity
fat in female, while decreased total fat mass in male, which do not mean increased adrenal medulla secretion, as we did
contrasts with the lack of effects of the deletion of A2A receptors not observe any differences in catecholamines plasma levels
in mice in body weight (46). As previously described, 4 weeks (Figures 3A,B) and that is not key to the maintenance of insulin
of HSu diet were unable to promote significant changes in resistance, as HSu animals with adenosine receptors blocked
weight gain (8, 47), being this effect also observed with the exhibit high Epi/NE adrenal medulla content but normalized
blockade of the adenosine receptors. However, even without levels of insulin sensitivity.
any change in weight gain, chronic blockade of A1 receptors
in HSu female animals decreased total fat mass, which was
associated with a decrease in perienteric, genital, and perinephric
Effect of Hypercaloric Hsu Diet on Insulin
fat mass, suggesting a redistribution of fat depots or an altered Sensitivity and Adenosine Receptor
ratio lean/fat mass. This decrease in fat mass mediated by A1 Expression
adenosine receptors may be due to an increase in lipolysis or Herein we described for the first time that insulin resistance
fat oxidation, effects that were described with chronic caffeine induced by HSu diet is associated with an increased expression
intake (45), but not to thermogenesis, since UCP1 expression in of A1 , A2A, and A2B receptors in the skeletal muscle, increased
the adipose tissue was unaltered in these animals (Figure 7G). expression of A1 in the liver and in the adipose tissue and
In male animals, blockade of A2A and A2B receptors increased decreased expression of A2B adenosine receptors in the liver. The
total fat, which is associated with an increased in perinephric fat increase in A1 expression in the adipose tissue of HSu rats found
mass. These different effects of the adenosine receptor on weight in the present manuscript contrasts with the findings of Dhalla
gain and fat mass in female and male animals may be associated et al. (52) showing unaltered adenosine A1 receptor mRNA
with hormonal and sex differences in body fat distribution and expression in Zucker diabetic fatty rat, but is consistent with
to a female higher lipolysis capacity (48, 49). Therefore, we the described role of A1 receptors in adipose tissue dysfunction
can conclude that A2B receptors are involved in the control of (53). Also, in an obese mice model with insulin resistance
weight, since the blockade of these receptors increases weigh induced by 16 weeks of high-fat diet, the expression of A2B
gain, especially in males, an effect that is not correlated with an adenosine receptor is increased in the liver, visceral fat, and
increase in fat mass. We can also conclude that A1 receptors gastrocnemius muscle (54). Based on this, we can postulate that
are involved in fat metabolism in females and A2 receptors in the differences in the expression of adenosine receptors might
males, as blockade of A1 receptors decreases fat mass deposition be related with differences in the animal models studied, the
in females and A2A and A2B blockade increase fat deposition HSu model studied in the present work is a lean model of
in males. insulin resistance (8, 47), or with the degree of insulin resistance
and disease progression, as herein we used a 4 weeks model
of diet and Johnston-Cox et al. (54) submitted the animals
Role of Adenosine Receptors in the to 16 weeks of high-fat diet. Therefore, different metabolic
Control of Sympathetic Activity in disturbances and different stages of disease progression might
Metabolic Diseases contribute differently to the expression of adenosine receptor
One of the pathophysiological mechanisms described to be in the insulin sensitive tissues. As expected, and consistent
involved in the development of insulin resistance is the with the application of chronic antagonists to a system, the
overactivation of the sympathetic nervous system (31). Herein, chronic administration of DPCPX and SCH58261 increased A1
no sex differences were observed in the sympatho-adrenal and A2A adenosine receptors in skeletal muscle and adipose
activity in controls and HSu animals as well as in the effect tissue. Surprisingly, no alterations were found for the effect
of chronic administration of the different adenosine receptor of adenosine antagonists in the liver and also for MRS1754,
antagonists in these parameters. We did not observe any which decrease adenosine A2B receptor expression in adipose
significant change in circulating NE and Epi after the chronic tissue, without any change in skeletal muscle and liver. In
administration of the different adenosine receptor antagonists, HSu animals, chronic administration of SCH58261 normalized
but the, chronic blockade of adenosine receptors increased the A2A adenosine receptor expression in skeletal muscle and
adrenal medulla NE and Epi content in control and HSu in liver and the chronic MRS1754 administration normalized
animals (Figure 3). Under basal conditions, adenosine inhibited A2B adenosine receptors in skeletal muscle. Interestingly, in
adrenal medulla catecholamine secretion, an effect partially the liver, A2B adenosine receptors decreased with the HSu diet
achieved by the inhibitory effect of adenosine on the renin- consumption, an effect that was normalized by the chronic
angiotensin system and which is increased when sympathetic MRS1754 administration.
system is stimulated (50). Therefore, our results are in agreement We also found that the different insulin-sensitive tissues do
with the data that shows that adenosine inhibits catecholamine not contribute equally or exhibit the same degree of impairment
secretion from adrenal medulla contrasting however with the in insulin resistant states. In fact, it seems to be a notion that
findings that show that these effects are blunted with chronic sometimes, and probably at the early stages of the disease, insulin
caffeine consumption (50, 51), suggesting that the mechanisms resistance can be present in the absence of decreased insulin
of adaptation to caffeine are different or develop more faster signaling [for a review see Fazakerley et al. (55)] with some
than for A1 and A2B adenosine receptor blockers. Additionally, authors showing evidences that the impairment in insulin action
we can suggest that the increased content of catecholamines is independent of proximal elements of the insulin signaling
Frontiers in Endocrinology | www.frontiersin.org 13 April 2020 | Volume 11 | Article 262Sacramento et al. Adenosine Receptors and Insulin Sensitivity
pathway, but rather likely specific to the glucoregulatory branch CONCLUSION
of insulin signaling (55). In here, in the HSu model, obtained
with 4 weeks of high-sucrose diet we found alterations in In conclusion, all together, the results herein described suggest
insulin signaling pathways only in the skeletal muscle, except that A2 adenosine receptors in the skeletal muscle are the
for GLUT2 expression in the liver. One could expect also main responsibles for the whole-body insulin sensitivity, being
alterations in insulin signaling in the adipose tissue, but we therefore more relevant the effect of adenosine on skeletal muscle
can postulate that the mechanisms behind insulin resistance on insulin action than the effect of adenosine on adipose tissue
development might be different depending on the type of diet in a context of lean insulin resistance. We can suggest that the
consumed and the time of exposure to the diets. In fact, it is targeting of A2 adenosine receptors might be useful to rescue
consensual that the time-line for progression of insulin resistance insulin signaling pathways in insulin-resistant conditions.
in mice fed a high-fat diet starts with the development of insulin
resistance in adipose tissue before the muscle (56, 57). However, DATA AVAILABILITY STATEMENT
the same might not be true for high sucrose diets at least
when administrated during short periods of time. The liver is The datasets generated for this study are available on request to
also another main insulin-sensitive tissue that is also involved the corresponding author.
in the development of insulin resistance (1). As previously
described by our group, HSu diet did not modify extensively ETHICS STATEMENT
the expression of insulin signaling in the liver (39), since only
decreased GLUT2. However, we cannot exclude possible major The animal study was reviewed and approved by NOVA Medical
alterations in this tissue, as we know that insulin control of School Ethics Committee.
glycolysis and gluconeogenesis (1). Chronic administration of
A2 adenosine antagonists produced the same effects in insulin AUTHOR CONTRIBUTIONS
signaling pathways, measured as insulin receptor expression and
Glut4 transporters, in skeletal muscle, than in whole-body insulin JS and SC participated in research design and wrote or
sensitivity. Contrary results were found in the adipose tissue contributed to the writing of the manuscript. JS, FM, MR, and
of control and HSu animals for chronic adenosine receptor TR conducted experiments. JS, FM, PM, EO, and SC performed
antagonist, where the blockade of A1 receptors improved insulin collection and data analysis. All the authors have approved the
signaling in control animals, but worsen insulin signaling in HSu final version of the manuscript, and all persons designated as
animals. In contrast, no changes were found for the effect of authors qualify for authorship, and all those who qualify for
adenosine antagonists in the liver in controls and HSu animals, authorship are listed.
suggesting that the role of adenosine in insulin action in the liver
do not involve the pathways herein tested. Therefore, we can FUNDING
conclude that in HSu animals the effect of adenosine on insulin
sensitivity is mainly mediated by A2 adenosine receptors in the The present study was supported by the Portuguese Society of
skeletal muscle with a small contribution of A1 receptors in the Diabetes. JS was supported by a PhD Grant from the Portuguese
adipose tissue. Foundation for Science and Technology, PD/BD/105890/2014.
REFERENCES 7. van Dam RM, Willett WC, Manson JE, Hu FB. Coffee, caffeine,
and risk of type 2 diabetes: a prospective cohort study in younger
1. Bajaj M, Defronzo RA. Metabolic and molecular basis of insulin resistance. J and middle-aged U.S. women. Diabetes Care. (2006) 29:398–403.
Nucl Cardiol. (2003) 10:311–23. doi: 10.1016/s1071-3581(03)00520-8 doi: 10.2337/diacare.29.02.06.dc05-1512
2. Ng M, Fleming T, Robinson M, Thomson B, Graetz N, Margono C, 8. Conde SV, Nunes da Silva T, Gonzalez C, Mota Carmo M, Monteiro EC,
et al. Global, regional, and national prevalence of overweight and obesity Guarino MP. Chronic caffeine intake decreases circulating catecholamines
in children and adults during 1980–2013: a systematic analysis for and prevents diet-induced insulin resistance and hypertension in rats. Br J
the Global Burden of Disease Study 2013. Lancet. (2014) 384:766–81. Nutr. (2012) 107:86–95. doi: 10.1017/S0007114511002406
doi: 10.1016/s0140-6736(14)60460-8 9. Guarino MP, Ribeiro MJ, Sacramento JF, Conde SV. Chronic caffeine
3. Kautzky-Willer A, Harreiter J, Pacini G. Sex and gender differences in risk, intake reverses age-induced insulin resistance in the rat: effect on skeletal
pathophysiology and complications of type 2 diabetes mellitus. Endocr Rev. muscle Glut4 transporters and AMPK activity. Age. (2013) 35:1755–65.
(2016) 37:278–316. doi: 10.1210/er.2015-1137 doi: 10.1007/s11357-012-9475-x
4. Fredholm BB, Bättig K, Holmén J, Nehlig A, Zvartau EE. Actions of caffeine in 10. Conde SV, Monteiro EC, Obeso A, Gonzalez C. Adenosine in
the brain with special reference to factors that contribute to its widespreaduse. peripheral chemoreception: new insights into a historically overlooked
Pharmacol Rev. (1999) 51:83–133. molecule–invited article. Adv Exp Med Biol. (2009) 648:145–59.
5. van Dam RM, Feskens EJ. Coffee consumption and risk of type 2 diabetes doi: 10.1007/978-90-481-2259-2_17
mellitus. Lancet. (2002) 360:1477–8. doi: 10.1016/S0140-6736(02)11436-X 11. Faulhaber-Walter R, Jou W, Mizel D, Li L, Zhang J, Kim SM, et al. Impaired
6. Smith B, Wingard DL, Smith TC, Kritz-Silverstein D, Barrett-Connor E. glucose tolerance in the absence of adenosine A1 receptor signaling. Diabetes.
Does coffee consumption reduce the risk of type 2 diabetes in individuals (2011) 60:2578–87. doi: 10.2337/db11-0058
with impaired glucose? Diabetes Care. (2006) 29:2385–90. doi: 10.2337/dc06- 12. Figler RA, Wang G, Srinivasan S, Jung DY, Zhang Z, Pankow JS,
1084 et al. Links between insulin resistance, adenosine A2B receptors, and
Frontiers in Endocrinology | www.frontiersin.org 14 April 2020 | Volume 11 | Article 262You can also read