Abundance and spatial distribution of marine debris on the beach of Takalar Regency, South Sulawesi
←
→
Page content transcription
If your browser does not render page correctly, please read the page content below

IOP Conference Series: Earth and Environmental Science

PAPER • OPEN ACCESS

Abundance and spatial distribution of marine debris on the beach of
Takalar Regency, South Sulawesi
To cite this article: A. Faizal et al 2021 IOP Conf. Ser.: Earth Environ. Sci. 763 012060

View the article online for updates and enhancements.

 This content was downloaded from IP address 46.4.80.155 on 06/09/2021 at 15:33
MARSAVE 2020 IOP Publishing
IOP Conf. Series: Earth and Environmental Science 763 (2021) 012060 doi:10.1088/1755-1315/763/1/012060

Abundance and spatial distribution of marine debris on the
beach of Takalar Regency, South Sulawesi

 A. Faizal1, S Werorilangi1, W Samad1, M Lanuru1, W S Dalimunte, and A
 Yahya1,2
 1
 Marine Science Department, Faculty of Marine Science and Fisheries, Universitas
 Hasanuddin, Makassar, Indonesia
 2
 Graduate Student, Fisheries Science, Hasanuddin University, Indonesia

 Email: ahmad.faizal@unhas.ac.id

 Abstract. This study aimed to map the spatial distribution of marine debris abundance in the
 beach area of Takalar Regency, South Sulawesi Province, Indonesia. This research was
 conducted during the east monsoon in August-September 2019 and July-August 2020. The data
 were collected from the beach of Takalar at 2 stations; station 1 in Punaga River Estuary and
 station 2 in Laikang Bay, with 3 replications per station. Sampling was carried out using the
 transect method, the length of the transect line is 100 meters parallel to the coastline. Samples
 were collected within the criteria of macro size (> 2.5 cm - 1 m) and meso size (> 5 mm - 2.5
 cm). The results showed that the average total abundance of marine debris in the macro size
 category was 0.036 items/m2 and in the meso size was 0.0012 items/m2; while the average weight
 abundance of macro and meso marine debris respectively were 0.36 g/m2 and 0.0013 g/m2. The
 spatial distribution showed that the greatest abundance of macro and meso waste was found at
 station 2 or around Laikang Bay. The semi-enclosed water in Laikang Bay is linked to the high
 accumulation of debris in the location.

1. Introduction
Debris refers to something that is not used, is disliked, or is discarded, having originated from human
activities rather than developing by itself [1]. Marine debris comprises solid anthropogenic materials
that are produced, disposed of, or left in the environment, including materials that are created or enter
into the sea through hydrodynamic activities [2-5]. Debris that originates on the land, may be carried by
the flow of seawater and end up on the land again [6]. Furthermore, the Law on Waste Management
Number 18 of 2008 states that waste is the solid residue of human daily activities and/or natural
processes.
 Humans, directly or indirectly, have long made the sea a place for debris disposal [7,8]. Most of the
world's beaches have accumulated marine debris caused by currents, waves and winds [7,9]. Marine
debris accumulation in coastal areas has implications for silting, narrowing of river basins and
decreasing water quality, which results in decreased quality of public health [10]. In recent years there
has been an increase in marine debris in all parts of the world and it is predicted that there will be an
increase in marine debris globally by 2025 [11], potentially by as much as 15 to 40% if there is no
substantial remediation [3].
 Various types of marine debris are often found in coastal and marine areas. These include plastics
(nets, ropes, buoys, pipettes, lighters, plastic bags, plastic bottles); styrofoam (sponge, cooler cork, foam

 Content from this work may be used under the terms of the Creative Commons Attribution 3.0 licence. Any further distribution
 of this work must maintain attribution to the author(s) and the title of the work, journal citation and DOI.
Published under licence by IOP Publishing Ltd 1
MARSAVE 2020 IOP Publishing
IOP Conf. Series: Earth and Environmental Science 763 (2021) 012060 doi:10.1088/1755-1315/763/1/012060

floats); cloth (clothes, shoes, hats, towels, backpacks, canvas); glass and ceramics (light bulbs, glass
bottles); rubber, paper and cardboard (paper, newspapers, magazines and books); metal (drink cans,
bottle caps); and wood [12]. Plastic debris occupies the largest proportion of total waste in coastal and
marine areas [13]. Plastic debris is a significant global environmental threat today [14]. Based on the
size and distribution area, the characteristics of marine debris are categorised as in Table 1 [15].

 Table 1. Classification of debris based on the size and location of distribution.
 No Classification Size (Length) Location
 Distribution
 1 Mega > 1m Ocean
 2 Macro > 2,5 cm - < 1m Benthic
 3 Meso > 5mm - < 2,5 cm Coastline
 4 Micro 0,33 mm - < 5mm Waters/seas
 5 Nano
MARSAVE 2020 IOP Publishing
IOP Conf. Series: Earth and Environmental Science 763 (2021) 012060 doi:10.1088/1755-1315/763/1/012060

 Figure 1. Sampling location at Takalar District.

 The samples were categorised as macro debris (> 2.5 cm - 1 m) or meso debris (> 5 mm - 2.5 cm)
(Lippiatt et al., 2013). Plot installation for sampling at the beach on P2KP-KLHK [9] was modified from
[12] and [15], with the following procedure: marine debris sampling was carried out in coastal areas by
laying transect lines of 100 m parallel to the coastline. The transect was then divided into 5 sections with
a length of 20 m each. Quadrat transects measuring 5 x 5 m were then laid out in each section. Debris
collection was carried out at low tide. Debris samples were taken randomly on 5 sub-transects (1x1m)
from a 5x5 m quadrat transect using a 2.5-cm sieve for macro debris and a 0.5-cm sieve for meso debris
(Figure 2). The types of debris taken was then identified within 8 categories of plastic debris, based on
the Guidelines for Monitoring Coastal Debris by the Ministry of Environment and Forestry [9] and
UNEP [12]. Furthermore, the weight of dry debris was recorded using a digital scale. Current
measurement was taken using an Electric Current Meter (ECM) at the highest tide conditions until it
began to recede.

 5m
 20 m

 Land 100 m

 Sea

 Figure 2. Illustration of marine debris sampling method conducted at each station.

 3
MARSAVE 2020 IOP Publishing IOP Conf. Series: Earth and Environmental Science 763 (2021) 012060 doi:10.1088/1755-1315/763/1/012060 The abundance of marine debris based on amount and weight was calculated using equation-1 [9]. To distinguish the abundance of marine debris at each station, a one-way ANOVA test was used. The spatial distribution of marine debris was mapped based on the abundance at each sub-station. = ( ) (1) × Where x = amount / weight of debris per type; p = transect length (m) and l = transect width (m). Analysis of the distribution of data flows, direction and velocity for the season period, was conducted using the RMA-2 module (equations-2, 3, and 4) [20]. The mass equation as below: h u v h h h u v 0 (2) t x y x y Momentum equation: In the x-direction: u u u h 2 u 2u h gun2 h hu hv E xx 2 E xy 2 gh t x y p x y x x 1.486 h1 6 2 (3) u2 v2 12 Va2 cos 2hv sin 0 In the y-direction: v v v h 2v 2v h gun2 h hu hv E yx 2 E yy 2 gh t x y p x y y y 1.486 h1 6 2 (4) u2 v 2 12 Va2 sin 2hv sin 0 where: h= water depth [m], t = time [sec], u,v = velocity component in X and Y axis [vector], = fluid density [kg/m3], g= gravity acceleration [m2/sec.], E = viscosity coefficient of turbulence (xx, of in the normal towards X axis, yy, in the normal towards Y axis. xy and yx, of coincides in X and Y direction, respectively), a= bottom water elevation, n= Manning coefficient, = wind shear coefficient, Va= wind speed [m/sec], = wind direction [deg.], = angular velocity [rad/sec] and = latitude [deg.] 3. Results 3.1. General Conditions Takalar Regency is located in the south of Sulawesi Island, administratively included in South Sulawesi Province. Geographically, it is directly opposite the Makassar Strait on the west side and the Flores Sea on the south side. Takalar Regency is flanked by two different ocean regions and has a direct impact on the movement of ocean currents in the region: the west monsoon currents and the east monsoon currents [22]. The research stations are located in the southern part of Takalar Regency. The two research stations are strongly influenced by the hydrodynamic action of the Makassar Strait and the Flores Sea. Station 1 4
MARSAVE 2020 IOP Publishing
 IOP Conf. Series: Earth and Environmental Science 763 (2021) 012060 doi:10.1088/1755-1315/763/1/012060

 at the Punaga River Estuary is directly opposite the Makassar Strait and Station 2 at Telak Laikang is
 directly opposite the Flores Sea. Another characteristic that distinguishes the two stations is the openness
 of the waters: station 1 is adjacent to open water and station 2 to semi-enclosed water.

 3.2. Macro Debris
 The total amount of macro debris found at the two observation stations was 585 items, with a weight of
 11163.14 g. The macro debris category was dominated by plastic debris (83%) with a total of 490 items
 and a weight of 8272.12 g (74%), the next-most dominant type of debris being wood (3.25%) with a
 total of 19 items and a weight of 385.69 g (3.46%).

 Table 2. Total Amount and Composition of Macro Debris at Both Stations.
 Station 1 Station 2 Total Composition
Type of Debris Amount Mass Amount Mass Amount Amount Mass
 (items) (g) (items) (g) (items) Mass (g) (%) (%)
 105.9 8166.
Plastic 133 2 357 2 490 8272.12 83.76 74.10
Styrofoam 4 2.12 3 13.0 7 15.12 1.20 0.14
Cloth 6 3.91 11 426.0 17 429.91 2.91 3.85
Glass and Ceramic 1 3.20 17 386.9 18 390.15 3.08 3.49
Metal 1 2.80 5 324.0 6 326.80 1.03 2.93
Paper 1 1.00 1 30.0 2 31.00 0.34 0.28
Rubber 3 13.53 12 695.2 15 708.76 2.56 6.35
Wood 7 43.60 12 342.1 19 385.69 3.25 3.46
Other 0 30.60 11 573.0 11 603.60 1.88 5.41
Total 585 11163.145 100 100

 The spatial distribution of the abundance of debris in the macro debris category in each sub-station,
 in terms of both amount and weight, is shown in Figure 3. The results of the analysis show that the
 greatest abundance based on the number of items/m 2 was found at Station 2, especially in substation S2-
 2 (0.009 items/m2) and substation S2-3 (0.005 Items/m2). Based on the debris mass, the greatest
 abundance was found at Station 2, especially at substation S2-2 (1.23g/m2) and substation S2-3 (0.55
 g/m2).

 a b
 Figure 3. Abundance distribution of macro debris (a) by amount (items/m2) and (b) mass (g/m2).

 5
MARSAVE 2020 IOP Publishing
IOP Conf. Series: Earth and Environmental Science 763 (2021) 012060 doi:10.1088/1755-1315/763/1/012060

 The statistical test results for the abundance of macro debris (Figure 4) were based on the Kruskal-
Wallis test because the data variance was not homogeneous. The value was significant p
MARSAVE 2020 IOP Publishing
IOP Conf. Series: Earth and Environmental Science 763 (2021) 012060 doi:10.1088/1755-1315/763/1/012060

 The spatial distribution of the abundance of the amount and composition of marine debris in the
meso debris category in each station and substation can be seen in Figure 5 (a, b). Based on the category
of the number of items/m2, the largest abundance was found at Station 2, especially at substation S2-2
(0.002 items/m2). and substation S23 (0.0019 Based on the mass/m 2 category, the greatest abundance
was found at Station 1, especially at Station S1-2 (0.007 g/m2).

 a b

 Figure 5. Abundance distribution of meso debris by (a) amount (items/m 2) and (b) mass (g/m2).

 The results of statistical tests for the abundance of meso debris (Figure 6) using the Kruskal-Wallis
Anova test with a significant value of p
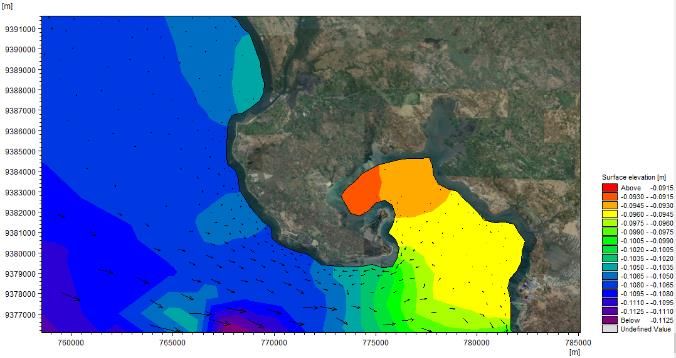
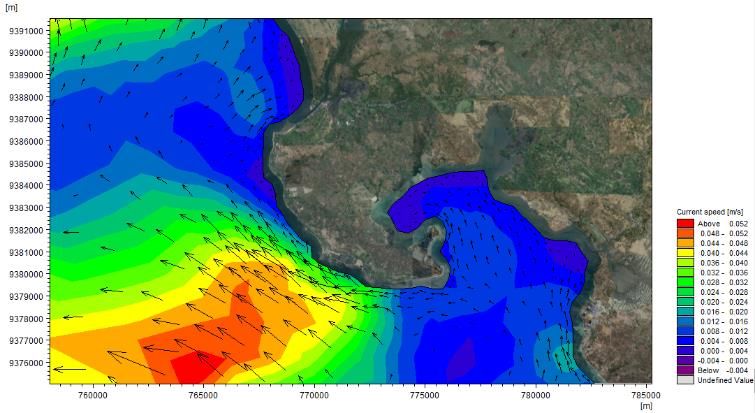
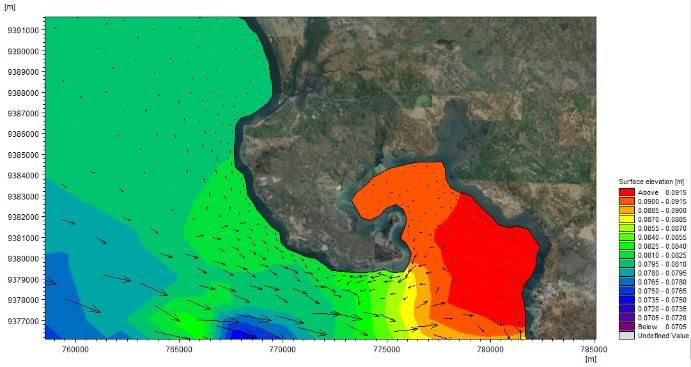
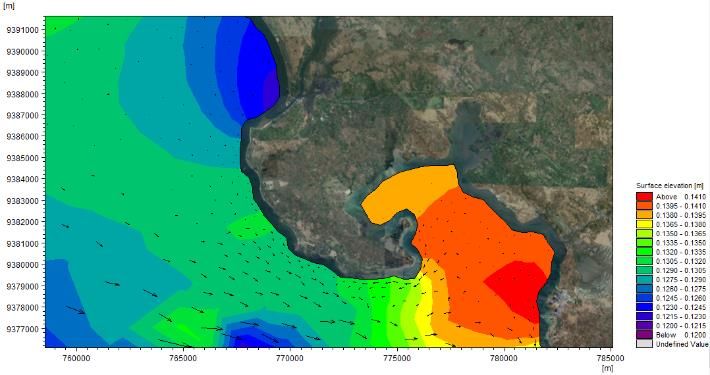
MARSAVE 2020 IOP Publishing
IOP Conf. Series: Earth and Environmental Science 763 (2021) 012060 doi:10.1088/1755-1315/763/1/012060

4. Discussion
The amount and total weight of macro debris found at the research location are shown in Table 2,
indicating that macro debris is dominated by plastic types, both in the quantity and mass categories. The
phenomenon of the dominance of plastic debris in the macro debris category was also found by other
researchers on the island of Sulawesi, such as at Tasik Ria Minahasa Beach [22], Boddia Takalar Beach
[23], Estuary River Birringkassi Maros [24], Tanjung Bunga Makassar [17] and the Labuange Barru
beach [25]. Research from outside the Sulawesi region also produced the same results,, including in
Sungsang North Sumatra [26], the Korean coast [27], and globally throughout the world [3,5].
 Likewise, meso-sized marine debris collected at the two observation stations (Table 3) showed that
based on category, the amount of waste is dominated by the plastic. The high dominance of plastic-type
debris is due to the fact that over long periods of time plastic debris degrades into smaller pieces which
are very difficult to decompose. Plastic debris is a synthetic organic polymer [28] and undergoes
fragmentation from macro debris to meso debris [29,30] and is very easily transported [23,31]. In terms
of debris mass, the category was dominated by wood debris, similar to the results of research at
Tongkaina Beach and Talawaan Bajo Minahasa Utara [32].
 The abundance of both macro- and meso- marine debris, , was found to be higher at Station 2
(Figures 3 and 5) and based on the statistical tests in Figures 4 and 6, there was a difference between the
abundance of macro debris and meso debris at the two stations. Several things make this phenomenon
possible: (1) The difference in activities at the two stations. At Station 1, the land is mainly used for
cultivation, while at Station 2 the main activity is tourism. Anthropogenic activities such as settlement
activities [33,34] and tourism activities [35] greatly influence the high accumulation of marine debris in
a place ; (2) The geographical location of Station 2. This station is highly influenced by the interaction
between the Flores Sea and the Makassar Strait and the conditions in the bay mean that this location
tends to accumulate marine debris; and (3) Ocean currents as a movement of water masses that allows
the transport of material including marine debris.
 In particular, the distribution of garbage along the coast is strongly influenced by currents and tides,
which according to [36] are the main factors in the distribution of debris in coastal waters. The effect of
these currents and tides is magnified at low tide, when a large amount of debris is transported and
accumulates on the coastline. Marine debris found along the coast of Laikang Bay, Takalar Regency, is
assumed to have originated from the high seas (Makassar Strait and the Flores Sea) via transportation
on oceanic currents. The concave topography of the Laikang Bay coastline encourages the
accumulation of marine debris in the bay, with this assumption being backed up by the research of [37],
which found that more debris gathers in water bodies with a concave topography compared to in open
water.
 The distribution pattern of marine debris is strengthened from the results of the analysis of ocean
flow data in the east and west monsoon conditions as shown in Figure 7 and Figure 8. The trend of ocean
currents shows that in the west monsoon, the ocean currents originate from the Flores Sea towards
Laikang Bay and rotate towards the Makassar Strait. When entering Laikang Bay, the ocean currents
reduce speed and head towards the headland (station 2.2) so that at this substation the highest abundance
of marine debris is found. This is reinforced by the research of [24] that the current moves from the
south to the north with a speed of between 0.13 and 0.25 m / s in the coastal area of Takalar Regency.

 8
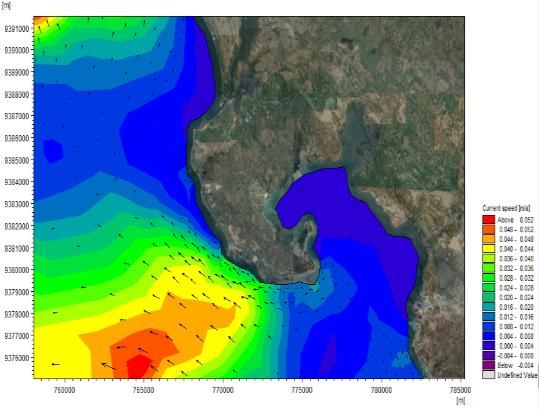
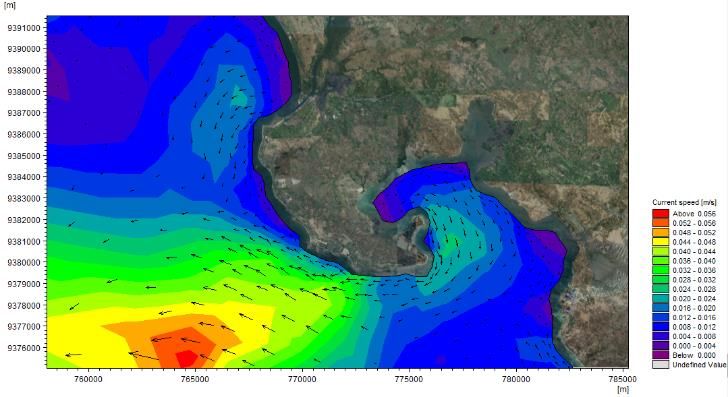
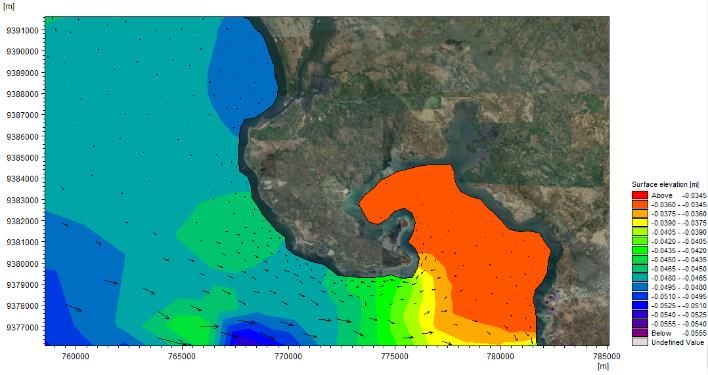
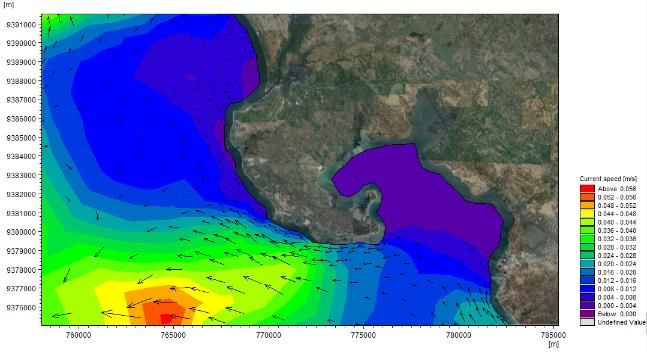
MARSAVE 2020 IOP Publishing
IOP Conf. Series: Earth and Environmental Science 763 (2021) 012060 doi:10.1088/1755-1315/763/1/012060

 a b

 c d
 Figure 7. The west monsoon flow Pattern (a) towards high tide in the west monsoon (b) during the
 tide peak in the west monsoon, (c) towards low tide in the west monsoon and (d) lowest low tide in
 the west monsoon.

 On the other hand, during the east monsoon, ocean currents tend to originate from the north (the
Makassar Strait) in the form of shoreline currents, entering Laikang Bay towards the Flores Sea. These
conditions facilitate the transport of marine debris from the Makassar Strait to Laikang Bay (Station 2).
According to [38], the source of the arrival of garbage can be determined by tracing the movement of
debris particles in the sea. The pattern of this movement will follow the path of major ocean currents,
which can be determined through the oceanographic characteristics in the area, such as the speed and
direction of currents.

 a b

 9
MARSAVE 2020 IOP Publishing
IOP Conf. Series: Earth and Environmental Science 763 (2021) 012060 doi:10.1088/1755-1315/763/1/012060

 c d

Figure 8. The east monsoon flow pattern (a) towards high tide in the east monsoon (b) during the tide
peak in the east monsoon, (c) towards low tide in the east monsoon and (d) lowest low tide in the east
 monsoon.

 The high abundance of both macro and meso marine debris at the beach at Station 2 is strongly
supported by three factors: land use, geographic position and the direction and velocity of ocean
currents. This is in line with the research of [33], which found that the buoyancy of plastic debris causes
it to be easily carried away by winds, ocean currents and tides, and can also accumulate along coastlines
- even on the most remote islands - as well as in the open sea and deep sea.

5. Conclusion
Marine debris, in the form of both macro debris and meso debris, was found at all research stations.
Plastic debris dominated the amount and weight of marine debris found in Takalar Regency. The average
total abundance of macro marine debris was 0.036 items/m 2 and of meso marine debris was 0.0012
items/m2, while the average weight abundance of macro and meso marine debris were 0.36g/m 2 and
0.0013 g/m2 respectively. The spatial distribution shows that the greatest abundance of macro and meso
debris was found at Station 2, or around Laikang Bay. The semi-enclosed water, current direction and
land use in Laikang Bay are linked to the high accumulation of debris in the location.

Acknowledgment
This article is a part of research funded by the National Research Agency (BRIN) through the
Hasanuddin University Research and Service Institute. Multi-year Basic Research Scheme based on
Research Contract No. 1740 / UN4.21 / PL.00.00 / 2019 the Year 2019 and Research Contract No. 1516
/ UN4.22 / PT.01.03 / 2020 the Year 2020.

References
[1] Manik R T HK, Makainas I dan Sembel A 2016 Sistem Pengelolaan Sampah Laut di Pulau
 Bunaken. Jurnal Spasial; Perencanaan Wilayah dan Kota 3(1) 15-24
[2] Richards Z T and Beger M 2011 A quantification of the standing stock of macro-debris in Majuro
 lagoon and its effect on hard coral communities. Marine Pollution Bulletin, 62(8), 1693-1701
[3] Jambeck R J, Roland G, Chris W, Theodore R S, Miriam P, Anthony A, Ramani N and Kara L
 2015 Plastic Was Inputs From Land Into The Ocean. Journal. Science. 347 (6223) 768-771
[4] Global Environment Facility (GEF) 2012 Impacts of marine debris on biodiversity: current
 status and potential solutions. UNEP-GEF. pp. 61
[5] National Oceanic and Atmospheric Administration (NOAA) 2016 NOAA Marine Debris
 Program. Pp 26
[6] Opfer S, Arthur C, and Lippiat S 2012 Marine Debris Shoreline Survey Field Guide. NOAA
 Marine Debris Program. Pp 14
[7] GESAMP 2019 Guidelines for the monitoring and assessment of plastic litter and microplastics

 10
MARSAVE 2020 IOP Publishing
IOP Conf. Series: Earth and Environmental Science 763 (2021) 012060 doi:10.1088/1755-1315/763/1/012060

 in the ocean (Kershaw P J, Turra A amd Galgani F editors). (IMO/FAO/UNESCO-
 IOC/UNIDO/WMO/IAEA/UN/UNEP/UNDP/ISA Joint Group of Experts on the Scientific
 Aspects of Marine Environmental Protection) Rep. Stud. GESAMP, No. 99.Henry, B., Laitala,
 K., and Grimstad, I. 2019. Science of the Total Environment Micro fi bres from apparel and
 home textiles : Prospects for including microplastics in environmental sustainability
 assessment. Science of the Total Environment. 652 483–494
[8] UNEP 2018 Valuing Plastics: The Business Case for Measuring, Managing and Disclosing Plastic
 Use in the Consumer Goods Industry. UNEP, pp. 116
[9] Kementrian Lingkungan Hidup dan Kehutanan (KLHK) 2017 Pedoman Pemantauan Sampah
 Laut : Sampah Pantai, Sampah Terapung, dan Sampah Dasar Laut. Direktorat Pengendalian
 Pencemaran dan Kerusakan Pesisir dan Laut Jakarta Pp 92
[10] Kubota M 1994 A Mechanism for the Accumulation of Floating Marine Debris North of
 Hawaii J. Phys. Oceanogr. 24 1059–1064
[11] Barboza L G A, Cózar A, Gimenez B C G, Barros T L, Kershaw P J, Guilhermino L 2019
 Macroplastics Pollution in the Marine Environment, in: World Seas: An Environmental
 Evaluation. Elsevier, pp. 305–328
[12] Cheshire A, Adler E 2009 UNEP/IOC guidelines on survey and monitoring of marine litter.
 Regional Seas-GPA. Pp 117
[13] Md Saad J and Williams P T 2016 Catalytic dry reforming of waste plastics from different waste
 treatment plants for production of synthesis gases Waste Management, 58 pp 214-220
[14] Thompson R C, Moore C J, vom Saal F S, Swan S H 2009 Plastic, the environment and human
 health: current consensus and futire trends, Philos. Trans. Roy, Soc. B 364 2153-2166
[15] Lippiatt S, Opfer S and Arthur C 2013 Marine Debris and Monitoring Assesment. NOAA Marine
 Debris Program pp 82
[16] Citasari N, Nur I O dan Nuril A 2012 Analisis Laju Timbunan dan Komposisi Sampah di
 Permukiman Pesisir Kenjeran Surabaya. Jawa Timur, Indonesia. Berkas Penelitian Hayati: 18
 (83–85)
[17] Tahir A, Werorilangi S, Isman F M, Zulkarnaen A, Massinai A, Faizal A 2018 Short-Term
 Observation On Marine Debris at Coastal Areas of Takalar District And Makassar City, South
 Sulawesi-Indonesia. Jurnal Ilmu Kelautan SPERMONDE 4(2): 48-53
[18] Wicaksono E A, Tahir A, Werorilangi S 2020 Preliminary study on microplastic pollution in
 surface-water at Tallo and Jeneberang Estuary, Makassar, Indonesia. AACL Bioflux 13(2):902-
 909
[19] Faizal A, Werorilangi S, Samad W 2020 Spectral Characteristics of Plastic Debris in the Beach:
 Case Study of Makassar Coastal Area. Indonesia Journal of Geography 52 ( 1) 8-14
[20] U.S. Army Corps of Engineers 2003 Users Guide To RMA2 WES Version 4.5. US Army,
 Engineer Research and Development Center Waterways Experiment Station Coastal and
 Hydraulics Laboratory pp 296
[21] Aprilleria V, Meidiana M, Karina S I 2015 The influence of monsoon in Indonesia as arenewable
 energy source and sustainable development. Proceedings of 23rd TheIIER International
 Conference, Singapore
[22] Bangun S A, Sangari J R, Tilaar F, Pratasik S B, Salaki M, Pelle W 2019 Marine Debris
 Composition on Tasik Ria Beach, Tombariri, Minahasa Regency. Jurnal Ilimiah Platax 7(1)
 320-328
[23] Zulkarnaen A 2017 Identifikasi Sampah Laut (Marine Debris) Di Pantai Bodia Kecematan
 Galesong, Pantai Karama Kecamatan Galesong Utara, Dan Pantai Mandi Kecamatan Galesong
 Selatan Kabupaten Takalar. Skripsi. Ilmu Kelautan Fakultas Ilmu Kelautan dan Perikanan
 Universitas Hasanuddin Kota Makassar
[24] Tangadesu T R C 2018 Identifikasi Sampah Laut di Muara Sungai Biringkassi dan Wilayah
 Pesisir Sekitarnya Di Kabupaten Takalar. Skripsi. Departemen Ilmu Kelautan. Universitas
 Hasanuddin

 11
MARSAVE 2020 IOP Publishing
IOP Conf. Series: Earth and Environmental Science 763 (2021) 012060 doi:10.1088/1755-1315/763/1/012060

[25] Isyrini R, Tambaru R, Nafie Y A La, Ukkas M, & Cordova M R 2018 Beach Debris On Labuange
 Beach, Barru District, South Sulawesi 4 74–80
[26] Maherlsa R, Purwiyanto A I, Agustriani F, Putri W A, Fauziyah & Ferdiansyah 2019
 Identification of surface macro debrisin river flow and estuary of Musi River, South Sumatera
 Province
[27] Hong S, Lee J, Kang D et al 2014 Quantities, composition, andsources of beach debris in
 Korea from the results of nationwidemonitoring. Mar Pollut Bull 84:27–34
[28] Derraik J G B 2002 The Pollution Of The Marine Environment By Plastic Debris: A Review.
 Marine Pollution Bulletin 44: 842-852
[29] van Sebille E, Aliani S, Law K L, Maximenko N, Alsina J M, Bagaev A, Bergmann M, Chapron
 B, Chubarenko I, Cózar A, Delandmeter P, Egger M, Fox-Kemper B, Garaba S P, Goddijn-
 Murphy L, Hardesty B D, Hoffman M J, Isobe A, Jongedijk C E, Kaandorp M L A.,
 Khatmullina L, Koelmans A A, Kukulka T, Laufkötter C, Lebreton L, Lobelle D, Maes C,
 Martinez-Vicente V, Morales Maqueda M A, Poulain-Zarcos M, Rodríguez E, Ryan P G,
 Shanks A L, Shim W J, Suaria G, Thiel M, van den Bremer T S, & Wichmann D 2020 The
 physical oceanography of the transport of floating marine debris. Environmental Research
 Letters, 15(2)
[30] Fendall L S, & Sewell M A 2009 Contributing to marine pollution by washing your face:
 Microplastics in facial cleansers. Marine Pollution Bulletin. 58 8: 1225–1228
[31] Ryan P G, Moore C J, Van Franekar J A, Moloney C L 2009 Monitoringthe abundance of plastic
 debris in the marine environment. Phil Transroyal Soc B. 364: 1999-2012
[32] Djaguna A, Wilmy E P, Joshian N W S, Hermanto W K M, Natalie D C R, Edwin L A N 2019
 Identifikasi Sampah Laut Di Pantai Tongkaina Dan Talawaan Bajo. Jurnal Pesisir dan Laut
 Tropis, 7 (3) 174-182
[33] Jang Y C, Lee J, Hong S, Lee J, Shim W, & Song Y K 2014 Sources of plastic marine debris on
 beaches of Korea: More from the ocean than the land Ocean Science Journal. 49 151-162
[34] Pawar P R, Shirgaonkar S S & Patil R B 2016 Plastic marine debris: Sources, distribution and
 impacts on coastal and ocean biodiversity. PENCIL Publication of Biological Sciences. 3(1)
 40–54
[35] Syakti A D, Bouhroum R, Hidayati N V, Koenawan C J, Boulkamh A, Sulistyo I, Lebarillier S,
 Akhlus S, Doumenq P & Wong-Wah-Chung P 2017 Beach macro-litter monitoring and
 floating microplastic in a coastal area of Indonesia. Marine Pollution Bulletin, 122(1) 217-225
[36] Constantino E, Martins I, Salazar Sierra J M & Bessa F 2019 Abundance and composition of
 floating marine macro litter on the eastern sector of the Mediterranean Sea, Marine Pollution
 Bulletin, 138 (August 2018): 260–265
[37] Mansui J, Molcard A & Ourmières Y 2015 Modelling the transport and accumulation of floating
 marine debris in the Mediterranean basin Marine Pollution Bulletin, 91 No 1: 249–257
[38] Adibhusana M N, Hendrawan I G, Karang W G 2016 Model Hidrodinamika Pasang Surut di
 Perairan Pesisir Barat Kabupaten Bali. Journal of Marine and Aquatic Sciences. 2(2) 54-59

 12
You can also read