Abundance of plastic debris across European and Asian rivers
←
→
Page content transcription
If your browser does not render page correctly, please read the page content below
Environmental Research Letters

LETTER • OPEN ACCESS

Abundance of plastic debris across European and Asian rivers
To cite this article: C J van Calcar and T H M van Emmerik 2019 Environ. Res. Lett. 14 124051

View the article online for updates and enhancements.

                             This content was downloaded from IP address 31.149.52.250 on 09/01/2020 at 08:51
Environ. Res. Lett. 14 (2019) 124051 https://doi.org/10.1088/1748-9326/ab5468
LETTER
Abundance of plastic debris across European and Asian rivers
OPEN ACCESS
C J van Calcar1,2 and T H M van Emmerik1,3
RECEIVED 1
6 August 2019
The Ocean Cleanup, Batavierenstraat 15, 3014 JH, Rotterdam, The Netherlands
2
Geoscience and Remote Sensing, Delft University of Technology, Stevinweg 1, 2628 CN, Delft, The Netherlands
REVISED 3
Hydrology and Quantitative Water Management Group, Wageningen University, Droevendaalsesteeg 3, 6708 PB, Wageningen, The
4 November 2019
Netherlands
ACCEPTED FOR PUBLICATION
5 November 2019 E-mail: carolinevancalcar@live.nl
PUBLISHED Keywords: plastic, pollution, rivers, marine litter, plastic composition
11 December 2019
Supplementary material for this article is available online
Original content from this
work may be used under
the terms of the Creative
Commons Attribution 3.0
Abstract
licence. Plastic pollution in the marine environment is an urgent global environmental challenge. Land-based
Any further distribution of
this work must maintain
plastics, emitted into the ocean through rivers, are believed to be the main source of marine plastic
attribution to the litter. According to the latest model-based estimates, most riverine plastics are emitted in Asia.
author(s) and the title of
the work, journal citation However, the exact amount of global riverine plastic emission remains uncertain due to a severe lack
and DOI.
of observation. Field-based studies are rare in numbers, focused on rivers in Europe and North
America and used strongly varying data collection methods. We present a harmonized assessment of
floating macroplastic transport from observations at 24 locations in rivers in seven countries in
Europe and Asia. Visual counting and debris sampling were used to assess (1) magnitude of plastic
transport, (2) the spatial distribution across the river width, and (3) the plastic polymer composition.
Several waterways in Indonesia and Vietnam contain up to four orders of magnitude more plastic than
waterways in Italy, France, and The Netherlands in terms of plastic items per hour. We present a first
transcontinental overview of plastic transport, providing observational evidence that, for the sampled
rivers, Asian rivers transport considerably more plastics towards the ocean. New insights are presented
in the magnitude, composition, and spatiotemporal variation of riverine plastic debris. We emphasize
the urgent need for more long-term monitoring efforts. Accurate data on riverine plastic debris are
extremely important to improve global and local modeling approaches and to optimize prevention
and collection strategies.
1. Introduction recovery routes cannot develop at a rate necessary to
dispose all the plastic [6]. Of the 6.3 billion tonnes of
Plastic pollution in the aquatic environment is con- plastic waste generated until 2015, 79% accumulated
sidered one of the most challenging environmental in landfills or the natural environment [7]. Waste
risks globally. Direct effects of unsoundly disposed management, plastic use regulation, and waste and
plastics include the entanglement of aquatic life and plastic consumption differs considerably between
increased flood risks through blockage of urban countries in the world [1]. In turn, these factors impact
drainage systems [1, 2]. Over time, plastic debris the amount of plastic entering river systems [8]. The
degrades into microplastics due to photodegradation terrestrial and marine transport of plastic items is
and abrasion [3], that are later ingested by aquatic influenced by local characteristics of the river catch-
fauna and small organisms, such as zooplankton. ment area, such as land-use, wind, rainfall, river dis-
Plastic enters the food chain of humans and animals, charge, and hydraulic infrastructure [9–11]. A part of
threatening global human and ecosystem health [4, 5]. the plastic items will sink or strand in the river and a
The generation of plastic waste is accelerated by an part will eventually reach the river mouth [12–14]. Yet,
increasing population, growing economy, and rapid plastic transport by rivers is assumed to be the main
urbanization. Often, waste treatment, recycling, and source of plastic litter in the ocean [8]. However, a
© 2019 The Author(s). Published by IOP Publishing LtdEnviron. Res. Lett. 14 (2019) 124051
recent study shows that at least half of the collected depending on the plastic load of the river. Each river
plastics of the Great Pacific Garbage Patch in the was divided in 3 to 12 sections, so that the complete
North Pacific Ocean were objects from marine based river width was covered in one hour at most. Each
sources [15]. Although this study hypothesizes that floating and superficially submerged plastic piece
this is caused by coastal settlement of the plastic, the visible was counted, independent of its size. The
exact cause of this discrepancy remains unknown. average minimum debris size was estimated to be
More comprehensive data on the quantity of riverine 1 cm. If the debris type was uncertain, it was not
plastic, the distribution of plastic over the river width, counted as plastic. For subsequent analysis, the plastic
and the riverine plastic composition can contribute to debris counts were normalized over time and
a better understanding of the origin and fate of plastics expressed in monthly averaged number of plastic
in aquatic environments, crucial to mitigate the nega- items per hour. The number of items per hour per
tive impact of plastic pollution. section provide the spatial variation over the river
The amount of plastic litter that is emitted from width and the sum of the segments provide the total
land to the ocean is estimated globally by several mod- number of floating pieces of plastic per hour over the
els [11, 16, 17]. These models are generally uncertain whole river width. For each river, it was also deter-
due to a lack of data and complexities in the fate and mined what percentage of the river width carries 50%
transport of plastics. Model results show that most riv- and 90% of the plastic debris transport, respectively.
erine plastics are emitted in Southeast Asia, but most Data and the code to analyze the data can be found in
data driven riverine plastic studies are biased towards the supplementary material available atstacks.iop.
European and North American rivers [6] (e.g. the org/ERL/14/124051/mmedia.
Danube [18], the Thames [19], the Tiber [20], and the
Los Angeles basin [21]). Another complicating factor 2.2. Plastic composition
is that plastic transport and composition are often not Plastic composition was determined using net sampling,
measured consistently over time and space. While riv- local available data or visual counting, and the preferred
erine macroplastic debris (>5 mm) remains under- method depended on the local regulations and data
studied, this makes up most of the observed mass on availability. For net sampling, trawls were used to
the ocean and poses direct hazards on marine life sample the upper 40 cm of the water column. All trawls
[6, 8]. Available studies on riverine plastic debris focus consisted of frames (67×50 cm, height × width), with
mainly on plastic in rivers with large basins, but these 2 m long nets attached. The chosen mesh size of 2.5 cm
basins are not necessarily the largest contributor to the was an optimization between the desired size fraction of
ocean plastic pollution [22]. These biases impede a the plastic catch and the adaptability of the trawl due to
global assessment of riverine plastic debris transport, the drag force. To increase buoyancy and stability,
as has been done on marine plastic litter density [23]. horizontal buoys were attached on each side of the
Here, we provide a first transcontinental assessment frame. Depending on the water flow velocity and
of riverine floating macroplastic debris across 24 sam- the plastic load, trawling deployments lasted between
pling sites in seven countries in Asia and Europe. Plastic 10 min and a few hours. The trawling locations were
debris data was collected using a harmonized method at determined based on the prevailing flow direction,
all sites. In addition to several main European rivers (in observed largest debris amount, and the avoidance of
The Netherlands, France, Italy), we focus on river basins navigation routes. The collected plastic was weighted or
with high amounts of mismanaged plastic waste (in counted, depending on the location, and separated into
Thailand, Indonesia, Malaysia, and Vietnam [8]), rather 6 categories: polyethylene terephthalate (PET), polystyr-
than solely large river basins by surface area. We ene (PS), expanded polystyrene (EPS), hard polyolefin
demonstrate that the average magnitude, composition, (POhard), Soft polyolefin (POsoft), and Rest. Note that
and distribution over the river width of plastic debris polyolefins include polyethylene (PE) and polypropy-
transport varies considerably per river. Our results show lene (PP). Each item was assigned to a polymer category
that local in situ data is a prerequisite to understand the based on their common use:
origin and fate of river plastic debris, and to optimize
prevention and collection strategies. • PET: transparent plastic bottles;
• PS: products that contain consumables such as
2. Methods plates, cutlery, and cups;
• EPS: foam objects, such as lunch boxes and meat
2.1. Plastic transport observations
trays;
Visual counting of plastic debris is an uncomplicated
method to determine the plastic transport [24, 25] at • POhard: bottle caps, containers, and rigid plastics;
various sections across the river width. During each
• POsoft: bags, foils, and wrappings;
measurement, an observer standing on a bridge
counted all visible plastic items passing through a • Rest: all other objects that do not belong to one of
predefined section for a period between 1 and 20 min, the other categories.
2Environ. Res. Lett. 14 (2019) 124051
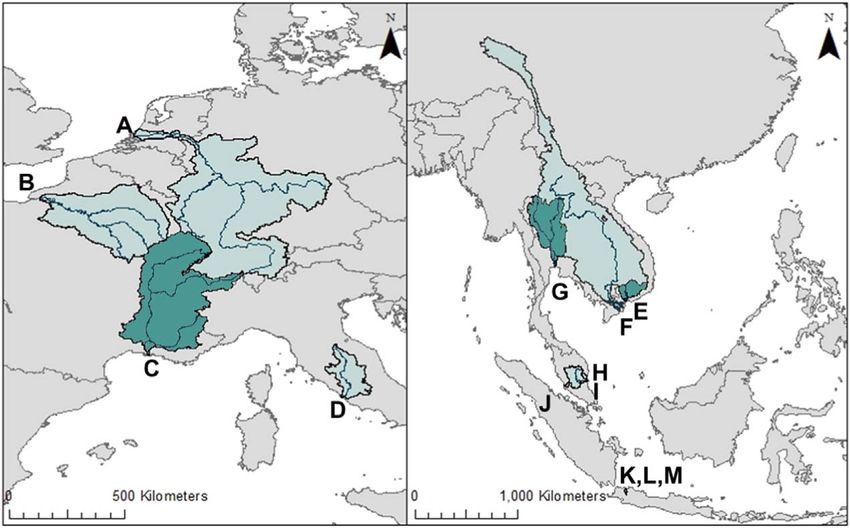
Figure 1. River catchments (indicated in green) and rivers (indicated in dark blue) included in this study. In some cases, the catchment
areas cover more then one country. In this case, the country mentioned here is the country where the river mouth is located. A Rhine
(The Netherlands), B Seine (France), C Rhône (France), D Tiber (Italy), E Saigon (Vietnam), F Mekong (Vietnam), G Chao Phraya
(Thailand), H Pahang (Malaysia), I Klang (Malaysia), J Kuantan (Malaysia), K Ciliwung (Indonesia), L Pesanggrahan (Indonesia), and
M Banjir Kanal Timur (Indonesia).
This peer-review method was developed with the aim has been chosen to conduct measurements, in the city
to provide a practical approach for a first-order of Rotterdam. To determine the composition of plas-
characterization. We acknowledge that there is uncer- tic in the Rhine, debris captured by a litter trap was
tainty introduced. Visual counting was also used to analyzed [26]. The litter trap was emptied about every
determine the plastic composition of each observed month in 2017 and 2018 for in total 22 times and each
item. The same categories were used as for net time, the composition was determined. This results in
sampling. For the Rhine [26] and the Chao Phraya a mean composition that is used in this study. Paris is
[27], data collected by using litter traps was used to one of the largest metropolitan areas in Europe.
determine the plastic composition by weighing the Therefore plastic transport in the Seine was measured
collected plastic. The results of the analysis of the at four locations, one upstream of Paris, two down-
composition data is divided by mass (net sampling and stream of Paris, and one close to the river mouth. The
litter traps) and item count (net sampling and visual composition was measured using net sampling. The
counting). Rhône river in France flows into the Mediterranean
sea. Results from the study Castro-Jiménez et al [28]
2.3. Measured waterways are used in this study. The plastic flux is measured in
In total, measurements at 24 waterways in seven the middle of the river, with an observation width of
countries in Asia and Europe are included in this study 65 m. In Asia, measurements were done in Vietnam,
(see figure 1). A numeration of these waterways and Indonesia, Thailand, and Malaysia. These are all in the
the characteristics of each location are given in table 1. top ten of most plastic emitting countries according to
The period and frequency of counting and sampling Lebreton et al [11]. The measured locations were selec-
vary for each river from 3 d in total to a weekly ted for various reasons. Several tributaries to the
assessment for a period of 12 months. All measure- Mekong were chosen as the main river was estimated
ments conducted by this study were done in 2018, to be one of the 20 most emitting rivers. The Saigon
except the measurements in 2017 in the Tiber and the river traverses a developing South East Asian mega city
Rhône, conducted by Crosti et al [20] and Castro- in Vietnam (Ho Chi Minh City) and drains most of the
Jiménez et al [28] respectively. untreated wastewater from dense urban districts and
In Europe, measurements were done in Italy, The industrial areas [33]. Four locations in Ho Chi Minh
Netherlands, and France. Rome (Italy) lies close to the City were chosen as measurement locations, and net
sea and the Tiber is flowing right through the city. This sampling was used to determine the composition. The
makes this river an interesting location to study plastic chosen waterways in Indonesia are located in Jakarta,
pollution close to a river mouth. Results from the the largest city of Indonesia located right at the Java
study Crosti et al [20] are used in this study. The Rhine sea. The waterways here are narrow channels so plastic
was estimated to be the most polluted river of Europe has a high probability to flow through since it cannot
[11]. At the location where the river enters The Neth- accumulate at the riverbank. Bangkok is Thailand’s
erlands, it splits in several rivers forming a complex largest city, and is drained by the Chao Phraya river.
river delta. The bridge most close by the river mouth Two bridges were chosen to conduct visual counting,
3Environ. Res. Lett. 14 (2019) 124051
Table 1. Overview of the waterways where measurements were done. All measurements were performed for this study, except the
measurement in the Tiber [20] and the Rhône [28]. The river width refers to the width at the location where the measurements were done.
BKT refers to Banjir Kanal Timur and BKB refers to Kanal Banjir Barat.
River Distance to
Measurement Watercourse width river Composition
location River type Main river (m) mouth (km) method
Italy
1. Fiumicino [20] Tiber Distributary Tiber 31 1 No data
The Netherlands
2. Erasmusbrug Nieuwe Maas Distributary Rhine 504 30 Mass
France
3. Villeneuve-le- Seine Main river Seine 118 367 Item count
Roi [29]
4. Triel-sur- Seine Main river Seine 145 268 Item count
Seine [29]
5. Meulan-en-Yve- Seine Main river Seine 132 260 Item count
lines [29]
6. Rouen [29] Seine Main river Seine 133 113 Item count
7. Arles [28] Rhône Main river Rhône 150 50 No data
Vietnam
8. Cau Thu Saigon Main river Saigon/Dong Nai 300 60 Mass
Thiem [30]
9. Cau Nguyen Thi Nghe Urban canal Saigon/Dong Nai 65 63 Item count
Huu Canh
10. Cau Tan Tuan Tan Thuan Urban canal Saigon/Dong Nai 97 56 No data
11. Saigon Saigon Main river Saigon/Dong Nai 300 62 Mass
12. Quang Trung Can Tho Tributary Mekong 200 80 Item count
13. Cau Di Bo Ben Rach Cai Khe Urban canal Mekong 178 78 Item count
Ninh Kieu
Indonesia
14. BKB-Grogol [31] Ciliwung Main river Ciliwung 24 6 Mass
15. BKB-Angke [31] Ciliwung Main river Ciliwung 18 2 Mass
16. Haryono [31] Ciliwung Main river Ciliwung 70 17 Mass
17. Cengkareng Pesanggrahan Distributary Pesanggrahan 64 2 Mass
Kapuk [31]
18. BKT mouth [31] BKT Flood channel BKT 48 2 No data
Thailand
19. Ratchawithi Chao Phraya Main river Chao Phraya 309 30 Mass
20. Mahaisawan Chao Phraya Main river Chao Phraya 373 22 No data
Malaysia
21. Klang [32] Klang Main river Klang 115 10 Item count
22. Pahang Pekan Main river Pahang 545 9 Item count
23. Kuantan Kuantan Main river Kuantan 370 1 Item count
24. Galing Kuantan Tributary Kuantan 30 1 Item count
upstream of the city center and downstream of the city European countries, expressed in monthly mean
center. Data from an existing litter trap was used to amount of plastic items per hour over the full river
determine the plastic composition [27]. In Malaysia, width is shown in figure 2. Plastic transport varies
three rivers has been studied. One river, Klang, that between rivers with up to five orders of magnitude,
flows through Kuala Lumpur, and two rivers, Kuantan ranging from 100 to 104 plastic items per hour. Six of
and Pahang, in the east of Malaysia. Net sampling was the eight studied rivers in Asian countries contain
used in the Klang to determine the plastic composi- more floating plastic than rivers in Europe. The mean
tion. The plastic composition in the Kuantan and amount of plastic items per hour for Southeast Asia
Pahang was determined visually. (7.1 × 10³ items h−1) is one order higher than the
mean amount of plastic items per hour in Europe
(2.5 × 10² items h−1). The Ciliwung river in Indonesia
3. Results ranked the highest in total floating macroplastics
observed at 2 × 10⁴ items per hour.
3.1. Magnitude of riverine plastic debris transport Rivers in Indonesia, Vietnam, Malaysia, France,
An overview of total floating plastic debris transport of The Netherlands, and Italy were measured multiple
24 waterways in rivers in four Asian and three times in a year. For these rivers, the difference between
4Environ. Res. Lett. 14 (2019) 124051
Figure 2. Overview of the mean floating plastic transport for all measured rivers. The top three bars show means taken over all rivers
(world), the Asian rivers and the European rivers. Eleven rivers were measured multiple times in a year. For these rivers, the circle
corresponds to the yearly mean and the bar corresponds to the minimum and maximum monthly mean. On the vertical axis, the
rivers are shown by name and the locations are indicated as up for upstream and down for downstream locations. The indicated
numbers correspond to the numeration in table 1.
Figure 3. Percentage of the river width through which 50% and 90% of the total amount of floating plastic items was transported.
the minimum and maximum monthly mean is shown per h) than more downstream (less than 1 × 10² items
with a bar in figure 2. Several rivers show variation in per h).
monthly mean plastic transport, demonstrating plastic
debris transport may exhibit strong seasonality. For 3.2. Distribution of plastic debris over the river
example, the variability of plastic transport at Ciliwung width
—Haryono ranged up to one order of magnitude. The Figure 3 shows for each river the percentage of the
highest transport was measured in November, which is river width that contains 50% and 90% of the plastic
the monsoon season, and the lowest transport in May debris. This demonstrates that most of the plastic
when the dry season starts. items (90%) are distributed over more than half of the
For Vietnam and Malaysia, the amount of floating river width (69%–92% of the width). The difference in
plastic varied with several orders of magnitude spatial variation over the river width between rivers is
between rivers in the same country. Even within the bigger (36%) when considering 50% of the plastic
same river, plastic transport varied between measure- items. For some locations, such as Ciliwung (BKB-
ment locations. For example, the mean plastic trans- Grogol), most plastic can be found in the middle of the
port in the Seine river in France was an order of river. For other locations, such as the Rhine and Chao
magnitude higher downstream (about 7 × 10² items Phraya, most plastic can be found at the outer sides of
5Environ. Res. Lett. 14 (2019) 124051
the rivers. This is shown in detail per river in figures 5 may be assumed that flood events also play an impor-
and6 in the supplementary material. tant role in the transport of plastic to rivers. Since the
variability of the riverine plastic transport over a year
3.3. The composition of floating macroplastic can be significant, this should be considered when
For most rivers, the dominant category of plastic is interpreting the plastic transport in the rivers where
POsoft with a mean of 47% in Europe and 37% in the measurements are done in only one time period of
Southeast Asia. However, the spread between rivers is the year.
20%–90% of the total. Especially in rivers in Indonesia The variation of plastic debris across the river
and France the percentage of POsoft is high. For two width varies per location. Several rivers have a pro-
rivers in Vietnam (locations 12 and 13), EPS has also a nounced preferential side for plastic transport, (for
considerable share in the composition (about 30%– example Chao Praya, location 19, and Saigon, location
55%). In Malaysia, The Netherlands, and in one river 8), while other rivers show a more symmetrical or
in Vietnam and Indonesia, also POhard and EPS take a evenly distributed pattern (for example Pessang-
significant share in the composition (with a mean of grahan, location 17). Since 69%–92% of the river
12% for Europe and 10% for Southeast Asia). Overall, width contains 90% of the floating plastic debris, the
PS and PET were found in rivers but are not a major plastic is often not concentrated in specific segments
part of the composition. of the river.
There are factors that influence the distribution of
floating plastic over the river width. First, the differ-
4. Discussion ence may be caused by litter traps that lie close by the
measurement location and only cover one side of the
The results of this study provide a first assessment of river. Second, the curvature and shape of a river affects
the quantification, composition, and spatial temporal the cross-sectional distribution. The flow velocity is
variation of floating macroplastic debris in rivers across higher in the outer bend of the river, what leads to an
Asia and Europe. Several waterways in Indonesia and increase of the plastic transport. The curvature of a
Vietnam contain up to four orders of magnitude more natural river is complex due to the meandering, so it is
plastic than waterways in Italy, France, and The Nether- plausible that the preferred side changes continuously
lands in terms of plastic items per hour. According to along the river. The observed rivers in Indonesia are
recent model estimates, the top 10–20 polluting rivers mostly straight engineered waterways and it can be
are mostly located in Asia and account for 67%–95% expected that plastic in these waterways peak in the
of the global total [11, 17]. Our paper presents middle of the river. Also the amount of plastic debris
observational evidence that, for the sampled rivers, varies between locations in the same river. These local
Asian rivers transport considerably more plastics differences could be caused by the presence of cities,
towards the ocean. Concerning the results of individual dams, and litter traps close by the measurement loca-
Asian countries, the same ranking of Asian countries tion [35]. Concluding, the spatial variation of plastic
can be found in the top 10 of countries worldwide, debris is influenced by environmental characteristics,
when considering the share of plastic waste that is such as wind and river curvature, and by anthro-
inadequately disposed [16]. pogenic factors, such as navigation and hydraulic
The seasonal variation of the floating plastic trans- infrastructure. Site specific insights can be used to
port at a location varies with an order of magnitude in locally optimize plastic recovery strategies. The variety
the Ciliwung river in Indonesia, and the Saigon river in of the plastic transport and distribution demonstrates
Vietnam. Similar dynamics were previously reported the complexity of the transport in urban areas.
by a study focused on the Los Angeles river basin, The composition of the plastic varies considerably
where an increase in plastic transport was measured between and within rivers (figure 4), and may depend
during the wet season [21]. The variability of the plas- on local plastic waste management infrastructure [8].
tic flux in the Rhône ranged up to two orders of mag- For example, in several countries PET collection sys-
nitude. The highest flux is measured in May, which is tems are set up to encourage people to recycle plastic
spring season in France although one would expect a bottles. This can lead to shares of PET in riverine plas-
higher flux in wintertime due to an increase of pre- tic debris [36]. Our results show that less PET is found
cipitation. Apart from a modeled estimation of the in the Rhine in the Netherlands than in, for example,
influence of monsoons on floating macroplastic trans- Kuantan and Pahang river in Malaysia. At the
port in a river, no detailed studies are done on this moment, there is no data available of municipality-
topic [11]. Also the influence of extreme flood events is level waste generation for different countries but it
unknown for macroplas tics, whereas for example the might explain the different composition between dif-
amount of microplastics in Mersin bay in the Medi- ferent rivers in the same country [8]. For example, the
terranean sea show a 14-fold increase after heavy rains share of EPS is about 55% in Can Tho river and 10% in
[34]. It was recently estimated that 10%–20% of the Thi Nghe canal while both waterways are located in
oceanic plastic pollution in the North Pacific Ocean is Vietnam. This demonstrates that the composition of
caused by the Tohoku tsunami in Japan in 2011 [15]. It floating plastic debris varies within countries and may
6Environ. Res. Lett. 14 (2019) 124051
Figure 4. The composition of the plastic samples for locations in Malaysia (Kuantan, Pahang, and Klang), Thailand (Chao Phraya),
France (Seine), and The Netherlands (Rhine) in terms of plastic items (figure (A)) or in terms of mass (figure (B)). Figure (C) shows the
mean composition for the world, for European rivers (in France and The Netherlands) and for Asian rivers (in Malaysia and Thailand).
Plastic items were classified into 6 categories: polyethylene terephthalate (PET), polystyrene (PS), expanded polystyrene (EPS), hard
polyolefin (POhard), Soft polyolefin (POsoft), and Rest. Note that polyolefins include polyethylene (PE) and polypropylene (PP). POsoft
also contains multilayer plastics.
depend on local consumption, management practices, waste in oceans and river originates largely from mul-
and environmental conditions. tiple sources.
It is often stated that riverine plastic is the major Insights in the spatial variation of plastic transport
source of marine plastic [8]. On the other hand it is and composition, both over width and length of the
shown that land-sourced plastic is delivered to the river, can be used to optimize riverine plastic collec-
open-ocean from nearshore accumulation zones, pre- tion strategies. The categorization of plastic items
dominantly as small buoyant fragments [37]. The based on common use introduces uncertainty. Other
result of an analysis of 3357 tonnes of debris at 6000 categorization methods, for instance OSPAR categor-
sites at the beach in terms of item count shows that ization, may be considered in order to reduce this
plastic bags are the most common found item (apart uncertainty. A comprehensive understanding of the
from cigarette buds that may not come from the ocean quantity and composition of oceanic plastic is still
but from direct litter on the beach) [38]. This corre- lacking, therefore it remains inconclusive to what
sponds to the category POsoft, which is also most abun- extent riverine plastic is contributing to the total
dant in riverine plastic based on this study. Most items amount of oceanic plastic. For future assessments it is
in the top 10 ranking of most common found items, recommended to collect mass statistics of riverine
such as plastic cutlery, plates, and straws belong to the plastic debris, in order to express plastic transport in
category PS. In 2018, the plastic composition in an terms of mass per unit of time. That allows to further
area of about 300 km2 in the North Pacific Ocean was explore the relations between plastic production, con-
analyzed using air- and seaborne vessels [15], Over sumption, leakage into the natural environment, and
90% of the macroplastics was hard plastic, plastic transport through rivers into the ocean. The overview
sheet, and film and only about 0.1% was plastic made presented in this study emphasizes the need for long-
of foam (both in terms of item count and mass). Yet, it term measurement efforts. In rivers with the longest
differs to what extent PS and POhard are found in river- data series (Saigon, Ciliwung, Klang, Seine, and
ine plastic in this study (0%–20%). This analysis has Rhône), we demonstrate that plastic transport can
been done on floating oceanic plastic, but riverine and have an intraannual variation of at least one order of
oceanic plastic can also sink to the ocean floor and be magnitude.
stored in the sediment layers. By comparing the com- Our paper presents a first transcontinental over-
position of plastic in different environments, such as view of plastic transport, providing new insights in the
in sediment layers and surface layers, it follows that magnitude, composition, and spatiotemporal varia-
only thick-walled, larger plastic debris from low den- tion of riverine plastic debris. However, this paper also
sity polymers could be horizontally transported from emphasizes the urgent need for more long-term mon-
rivers to ocean through currents [37]. Consequently, itoring efforts. Accurate data on riverine plastic debris
this study endorses the hypothesis that buoyant plastic are extremely important to improve global [11, 17]
7Environ. Res. Lett. 14 (2019) 124051
and local [39] modeling approaches and to optimize Indonesia, Thailand Department of Marine and
prevention and collection strategies. Coastal Resources, University of Malaysia Pahang,
Universiti Teknologi Petronas and Universiti Putra
Malaysia (Klang, Malaysia). We thank Boyan Slat,
5. Concluding remarks
Caitlyn Hall, Renato Borras-Chavez and Anna
Schwarz for the valuable feedback that helped improve
The amount of floating riverine plastic transport was
this paper, and Paul Vriend for his contribution on the
observed to vary between 100 and 104 items per hour.
river basins map.
The variation of the total floating plastic transport can
differ up to one order of magnitude for different
locations within one river. On average, the studied Author information
rivers in Asia transport almost 30 times more macro-
plastic items than the studied European rivers (7.1 × Contributions. CvC and TvE designed the study, CvC
103 and 2.5 × 10² items h−1, respectively). Influencing conducted the principal analysis and prepared the
factors on the amount of floating plastic transport are initial manuscript, CvC and TvE prepared the final
the type of waste management, location of cities, dams, manuscript, CvC prepared the figures.
and litter traps, seasonality of rainfall and river dis-
charge, and flood events. This demonstrates the com-
plexity of the origin and fate of riverine plastics. Competing interests
The horizontal distribution of floating macro-
plastic over the river width varies across rivers. Half of The authors declare no competing financial interests.
the plastic items are transported through 22%–58% of
the river width and 90% of the plastic items are trans- Data availability
ported through 68%–92% of the river width. This
means that the plastic is not completely concentrated The data that support the findings of this study are
in a single section of the river. included within this article.
The composition of the plastic debris can vary up
to 45% points for one polymer type between different
rivers in the same country. The composition varies ORCID iDs
also between locations in one river. This may be
caused by differences in plastic consumption and C J van Calcar https://orcid.org/0000-0003-
management practices, as well as transport mechan- 4659-0678
isms, and other factors. The plastic polymer composi- T H M van Emmerik https://orcid.org/0000-0002-
tion can provide information on the type of product 4773-9107
that was littered. Therefore, determining the type of
plastic can lead to the source of the plastic and hence to References
improvement of waste management and regulation.
Future assessment should further investigate the [1] UNEP 2018 Single-use Plastics: A Roadmap for
Sustainability UNEP
role of factors determining plastic transport. In our
[2] Conchubhair D O, Fitzhenry D, Lusher A, Andrew L,
paper, we demonstrate variation in plastic transport van Emmerik T, Lebreton L, Cicaurte-Villota C,
and composition across several European and Asian Espinosa L and Rourke E O 2019 Joint effort among research
rivers. Future work should also investigate other hypo- infrastructures to quantify the impact of plastic debris in the
ocean Environ. Res. Lett. 14 065001
thesized hot spots of riverine plastic pollution, such as
[3] Thompson R C, Barnes D K A, Galgani F and Barlaz M 2009
West Africa, Central America, China, India, and the Accumulation and fragmentation of plastic debris in global
Philippines. The results emphasize that riverine plastic environments Phil. Trans. R. Soc. B 364 1985–98
pollution is a global issue and urgent action is needed. [4] Schwabl P, Köppel S, Königshofer P, Bucsics T, Trauner M,
Reiberger T and Liebmann B 2019 Detection of various
microplastics in human stool: a prospective case series Ann.
Acknowledgments Intern. Med. 171 453–7
[5] Barboza L G A, Vethaak A D, Lavorante B R B O,
Lundebye A K and Guilhermino L 2018 Marine microplastic
We would like to thank the donors of The Ocean debris: an emerging issue for food security, food safety and
Cleanup who helped funding this study. We are also human health Mar. Pollut. Bull. 133 336–48
very grateful to all colleagues at The Ocean Cleanup [6] Blettler M C M, Abrial E, Khan F R, Sivri N and Espinola L A
2018 freshwater plastic pollution: recognizing research biases
and research partners who facilitated, and participated and identifying knowledge gaps Water Res. 143 416–24
in the data collection: Michelle Loozen, Kees van [7] Geyer R, Jambeck J R and Law K L 2017 Production, use, and
Oeveren, Lourens Meijer, Paul Vriend, Marlein fate of all plastics ever made Sci. Adv. 3 e1700782
Geraeds, Jelle Kaptein, Colin van Lieshout, Mathijs [8] Lebreton L and Andrady A 2019 Future scenarios of global
plastic waste generation and disposal Palgrave Commun. 5 6
Bruins, Henning Lagemann and Anna Schwarz [9] Baldwin A K, Corsi S R and Mason S A 2016 plastic debris in 29
(The Ocean Cleanup), Université Paris-Est, Ho Chi great lakes tributaries: relations to watershed attributes and
Minh University of Technology, Waste 4 Change hydrology Environ. Sci. Technol. 50 10377–85
8Environ. Res. Lett. 14 (2019) 124051
[10] Horton A A, Walton A, Spurgeon D J, Lahive E and Svendsen C [26] Pikaar R 2018 Shoreliner Rotterdam; Overzicht vangsten van
2017 Microplastics in freshwater and terrestrial environments: de Shoreliner Tauw
evaluating the current understanding to identify the knowledge [27] Department of Marine and Coastal Resources and Ministry of
gaps and future research priorities Sci. Total Environ. 586 127–41 Natural Resources and Environment 2018 The Study of Type
[11] Lebreton L C M, Van der Zwet J, Damsteeg J W, Slat B, and Quantity of Floating Marine Debris from Tha Chin and
Andrady A and Reisser J 2017 River plastic emissions to the Chao Praya River Mouths by Garbage Boom Thailand
worldas oceans Nat. Commun. 8 15611 [28] Castro-Jiménez J, González-Fernández D, Fornier M,
[12] Cózar A et al 2014 Plastic debris in the open ocean Proc. Natl Schmidt N and Sempéré R 2019 Macro-litter in surface waters
Acad. Sci. 111 10239–44 from the Rhone river: plastic pollution and loading to the NW
[13] Ryan P G 2015 Does size and buoyancy affect the long-distance mediterranean sea Mar. Pollut. Bull. 60 66–146
transport of floating debris? Environ. Res. Lett. 10 084019 [29] van Emmerik T, Tramoy R, van Calcar C J, Alligant S,
[14] Kukulka T, Proskurowski G, Morét-Ferguson S, Treilles R, Tassin B and Gasperi J 2019 Seine plastic debris
Meyer D W and Law K L 2012 The effect of wind mixing on the transport tenfolded during increased river discharge Frontiers
vertical distribution of buoyant plastic debris Geophys. Res. Mar. Sci. 6 642
Lett. 39 L07601 [30] van Emmerik T, Strady E and Kieu-Le T 2019 Seasonality of
[15] Lebreton L et al 2018 Evidence that the great pacific garbage riverine macroplastic transport Sci. Rep. 9 11–9
patch is rapidly accumulating plastic Sci. Rep. 8 4666 [31] van Emmerik T, Loozen M, van Oeveren K, Buschman F and
[16] Jambeck J R, Geyer R, Wilcox C, Siegler T R, Perryman M, Prinsen G 2019 Riverine plastic emission from Jakarta into the
Andrady A, Narayan R and Law K L 2015 Plastic waste inputs ocean Environ. Res. Lett. 14 084033
from land into the ocean Science 347 768–71 [32] Geraeds M, van Emmerik T, de Vries R and bin Ab Razak M S
[17] Schmidt C, Krauth T and Wagner S 2017 Export of plastic 2019 Riverine plastic litter monitoring using unmanned aerial
debris by rivers into the sea Environ. Sci. Technol. 51 12246–53 vehicles (UAVs) Remote Sens. 11 2045
[18] Lechner A, Keckeis H, Lumesberger-Loisl F, Zens B, Krusch R, [33] Lahens L, Strady E, Kieu-Le T, Dris R, Boukerma K, Rinnert E,
Tritthart M, Glas M and Schludermann E 2014 The Danube so Gasperi J and Tassin B 2018 Macroplastic and microplastic
colourful: a potpourri of plastic litter outnumbers fish larvae in contamination assessment of a tropical river (Saigon river,
Europe’s second largest river Environ. Pollut. 188 177–81 Vietnam) transversed by a developing megacity Environ. Pollut.
[19] Morritt D, Stefanoudis P V, Pearce D, Crimmen O A and 236 661–71
Clark P F 2014 Plastic in the Thames: a river runs through it [34] Gündoğdu S, Çevik C, Ayat B, Aydoğan B and Karaca S 2018
Mar. Pollut. Bull. 78 196–200 How microplastics quantities increase with flood events? An
[20] Crosti R, Arcangeli A, Campana I, Paraboschi M and example from Mersin Bay NE Levantine coast of Turkey
González-Fernández D 2018 Down to the river: amount, Environ. Pollut. 239 342–50
composition, and economic sector of litter entering the marine [35] Gasperi J, Dris R, Bonin T, Rocher V and Tassin B 2014
compartment, through the Tiber river in the western Assessment of floating plastic debris in surface water along the
mediterranean sea Rend. Lincei Sci. Fis. Nat. 29 859–66 Seine river Environ. Pollut. 195 163–6
[21] Moore C J, Lattin G L and Zellers A F 2011 Quantity and type of [36] Hoppe T, Bressers H, de Bruijn T and Garcia L F 2013 Street
plastic debris flowing from two urban rivers to coastal waters litter reduction programs in The Netherlands: reflections on
and beaches of southern California Rev. Gestão Costeira the implementation of the Dutch litter reduction program for
Integrada-J. Integr. Coast. Zone Manage. 11 65–73 2007-2009 Environ. Eng. Manage. J. 12 1657–68
[22] Best J 2018 Anthropogenic stresses on the worldʼs big rivers [37] Schwarz A E, Ligthart T N, Boukris E and van Harmelen T 2019
Nat. Geosci. 12 7–21 Sources, transport, and accumulation of different types of
[23] Li W C, Tse H F and Fok L 2016 Plastic waste in the marine plastic litter in aquatic environments: a review study Mar.
environment: a review of sources, occurrence and effects Sci. Pollut. Bull. 92 100–43
Total Environ. 566 333–49 [38] Kershaw P, Katsuhiko S, Lee S and Woodring D 2011 Plastic
[24] González-Fernández D and Hanke G 2017 Toward a debris in the ocean UNEP Yearbook 2011 (Nairobi: United
harmonized approach for monitoring of riverine floating macro Nations Environment Programme) pp 20–33
litter inputs to the marine environment Frontiers Mar. Sci. 4 86 [39] Tramoy R, Gasperi J, Dris R, Colasse L, Fisson C, Sananes S,
[25] van Emmerik T et al 2018 A methodology to characterize Rocher V and Tassin B 2019 Assessment of the plastic inputs
riverine macroplastic emission into the ocean Frontiers Mar. from the seine basin to the sea using statistical and field
Sci. 5 372 approaches Frontiers Mar. Sci. 6 151–6
9You can also read