Acceleration of protons and heavy ions to suprathermal energies during dipolarizations in the near-Earth magnetotail - ann-geophys.net
←
→
Page content transcription
If your browser does not render page correctly, please read the page content below
Ann. Geophys., 37, 549–559, 2019
https://doi.org/10.5194/angeo-37-549-2019
© Author(s) 2019. This work is distributed under
the Creative Commons Attribution 4.0 License.

Acceleration of protons and heavy ions to suprathermal energies
during dipolarizations in the near-Earth magnetotail
Andrei Y. Malykhin1,2 , Elena E. Grigorenko1,2,3 , Elena A. Kronberg4,5 , Patrick W. Daly4 , and Ludmila V. Kozak6,7
1 Space Research Institute of Russian Academy of Sciences, Moscow, Russia
2 St.Petersburg State University, Saint Petersburg, Russia
3 Department of Space Physics, Moscow Institute of Physics and Technology, Moscow, Russia
4 Max Planck Institute for Solar System Research, Göttingen, Germany
5 Ludwig Maximilian University of Munich, Munich, Germany
6 Kyiv Taras Shevchenko University, Kyiv, Ukraine
7 Space Research Institute National Academy of Sciences of Ukraine and State Space Agency of Ukraine, Kyiv, Ukraine

Correspondence: Andrei Y. Malykhin (anmaurdreg@gmail.com)

Received: 2 April 2019 – Discussion started: 9 April 2019
Revised: 3 June 2019 – Accepted: 9 June 2019 – Published: 9 July 2019

Abstract. In this work we present an analysis of the dynam-         1   Introduction
ics of suprathermal ions of different masses (H+ , He+ , O+ )
during prolonged dipolarizations in the near-Earth magneto-         One of the important processes in the dynamics of the Earth’s
tail (X > −17RE ) according to Cluster/RAPID observations           magnetotail is magnetic dipolarization. This manifests it-
in 2001–2005. All dipolarizations from our database were            self in enhancement of the northward magnetic field com-
associated with fast flow braking and consisted of multiple         ponent (BZ ), which results in transformation of the initially
dipolarization fronts (DFs). We found statistically that fluxes     stretched magnetic configuration into the more dipole-like
of suprathermal ions started to increase ∼ 1 min before the         one. This process is often associated with an increase in
dipolarization onset and continued to grow for ∼ 1 min after        geomagnetic activity (Sergeev et al., 2012, and references
the onset. The start of flux growth coincided with the begin-       therein).
ning of a decrease in the spectral index γ . The decrease in γ         Spacecraft observations have shown that dipolarization
was observed for protons for ∼ 1 min after the dipolarization       phenomena can be divided into two main groups. The first
onset, and for He+ and O+ ions for ∼ 3 and ∼ 5 min after the        group includes isolated dipolarization fronts (DFs) propa-
onset respectively. The negative variations of γ for O+ ions        gating along with the bursty bulk flows (BBFs) towards the
were ∼ 2.5 times larger than for light ions. This demonstrates      Earth (e.g., Angelopoulos et al., 1992; Nakamura et al., 2002;
more efficient acceleration for heavy ions. The strong nega-        Runov et al., 2009). The DFs are usually observed for a few
tive variations of γ were observed in finite energy ranges for      minutes or less (e.g., Schmid et al., 2011), and it is believed
all ion components. This indicates the possibility of nonadia-      that they are formed downtail in the course of reconnection
batic resonant acceleration of ions in the course of their inter-   (e.g., Sitnov et al., 2009). The second group includes the so-
action with multiple DFs during dipolarizations. Our analysis       called “secondary” dipolarizations related to the braking of
showed that some fraction of light ions can be accelerated up       fast flows and magnetic flux pileup in the near-Earth tail (e.g.,
to energies ≥ 600 keV and some fraction of oxygen ions can          Nakamura et al., 2009). The origin of “secondary” dipolar-
be accelerated up to ∼ 1.2 MeV. Such strong energy gains            izations is still debated. They can be the consequence of a
cannot be explained by acceleration at a single propagating         magnetic flux pileup due to the arrival of multiple BBFs (e.g.,
DF and suggest the possibility of multistage ion acceleration       Liu et al., 2013, 2014) or they can be caused by the devel-
in the course of their interaction with multiple DFs during         opment of cross-tail current instability in the near-Earth CS
the prolonged dipolarizations.                                      (e.g., Lui, 2011). Usually the secondary dipolarizations are
                                                                    associated with the formation of the substorm current wedge

Published by Copernicus Publications on behalf of the European Geosciences Union.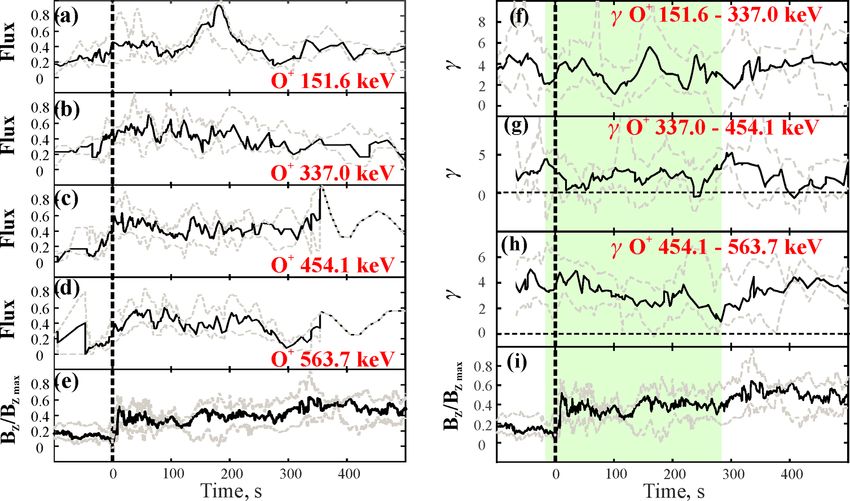
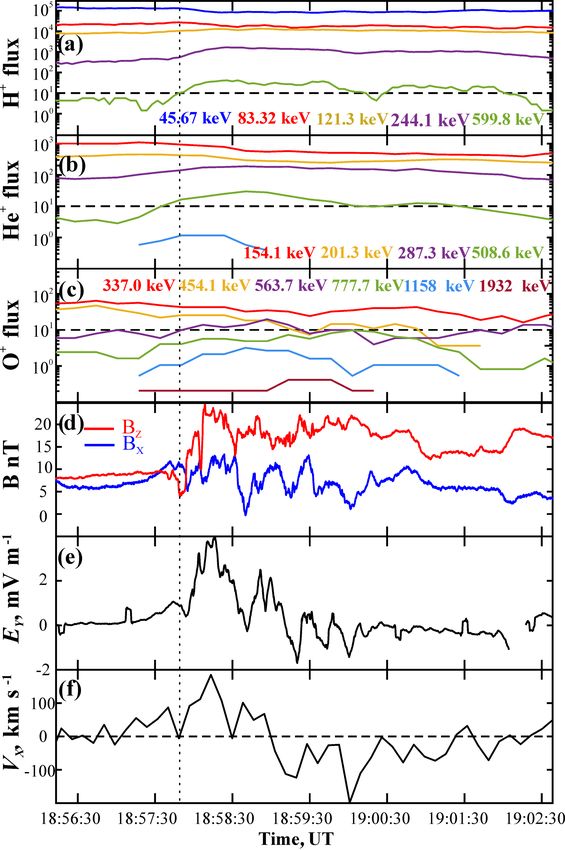
550                                A. Y. Malykhin et al.: Acceleration of protons and heavy ions to suprathermal energies

(SCW) and are observed for up to several hours (McPherron          servations (Wilken et al., 2001). The structure of the article
et al., 1973; Sergeev et al., 2012).                               is as follows. In Sect. 2, we describe the observational data
   The prolonged “secondary” dipolarizations have a com-           used and show a typical example of the dynamics and spectra
plicated temporal and spatial structure (e.g., Nakamura et al.,    of suprathermal H+ , He+ and O+ ions during dipolarization.
2009; Grigorenko et al., 2016, 2018; Malykhin et al., 2018a).      In Sect. 3, we present the statistical analysis of the fluxes
They consist of the prolonged growth of the BZ field (for          and spectra of these ion components observed in 17 dipolar-
∼ tens of minutes) along with multiple short (∼ 1–2 min) BZ        ization events. The results of our study are formulated and
pulses. It was shown that strong enhancements of the dawn–         discussed in Sect. 4.
dusk electric field (EY ) are often observed along with the BZ
pulses (e.g., Runov et al., 2011; Grigorenko et al., 2018).
   Thus, it is natural to assume that such magnetic struc-         2   Observations
tures affect the dynamics and acceleration of charged par-
ticles. The processes of acceleration of charged particles at      To study the dynamics and acceleration of suprathermal ions
single DFs have been studied in detail by using both space-        we used observations provided by the Research with Adap-
craft observations and kinetic simulations. Fu et al. (2011)       tive Particle Imaging Detectors (RAPID) spectrometers on
using Cluster observations have shown that electrons expe-         board four Clusters spacecraft in the energy range of 40–
rience adiabatic acceleration at DFs by betatron and Fermi         1500 keV for protons and up to 4000 keV for heavier ions
mechanisms. On the contrary, spacecraft observations and ki-       (Wilken et al., 2001). The magnetic field observations were
netic simulations demonstrated that ions experience nonadi-        taken from the fluxgate magnetometers (FGMs) (spin- and
abatic interaction with the DF and can be resonantly accel-        full-resolution (22.4 Hz) modes were used) (Balogh et al.,
erated by its electric field (e.g., Delcourt and Sauvaud, 1994;    2001). Ion moments of thermal population were taken from
Delcourt, 2002; Zhou et al., 2010; Greco et al., 2014, 2015;       the COmposition DIstribution Function (CODIF) instrument
Artemyev et al., 2012, 2015; Ukhorskiy et al., 2013). It was       (Rème et al., 2001). CODIF measures proton fluxes in the
shown that proton acceleration strongly depends on the ve-         energy range of 0–40 keV e−1 . The electric field data were
locity of the DF, and the proton energy gain increases with        provided by the Electric Field and Wave (EFW) instrument
the front amplitude (BZmax ) (Greco et al., 2014). Ukhorskiy       (Gustafsson et al., 2001). If not specifically mentioned, we
et al. (2013) reported that under realistic conditions, the max-   use the geocentric solar magnetospheric (GSM) coordinate
imum energy gain depends on the dawn–dusk extent of the            system everywhere in the paper.
front. Their simulations demonstrated that the trapped pro-           Figure 1 shows a dipolarization event observed by Cluster-
tons can be accelerated up to 100 keV at the DF unbounded in       1 (C1) spacecraft on 3 October 2004 between 18:56 and
the dawn–dusk direction. The energy gain is limited because        19:03 UT. The observations from the other Cluster satellites
of the nonadiabatic scattering off the equatorial plane due to     are similar and are not shown. At this time Cluster was lo-
high magnetic field curvature. Greco et al. (2015) demon-          cated at (−15; 6; 2.5) RE and it was inside the plasma sheet
strated that the energy gained by the most energetic fraction      (PS) (|BX | < 10 nT; see Fig. 1d). The dipolarization started
of ions scales approximately as the square root of the mass        around 18:57:49 UT. This moment is indicated in Fig. 1 by
ratio and that ion energization at DFs strongly depends on         the vertical dotted line. An increase in the earthward ion bulk
the initial particle energy.                                       velocity (VX ) was observed simultaneously with the sharp
   During the prolonged “secondary” dipolarizations the in-        increase in the BZ field (Fig. 1d, f). This indicates the arrival
creases in fluxes of suprathermal electrons, protons and           of BBF along with the DF. We will call this DF the onset-
heavy ions are often observed (Nosé et al., 2000; Apatenkov        related DF, since after this front the dipolarization lasted un-
et al., 2007; Asano et al., 2010; Grigorenko et al., 2017; Ma-     til ∼ 19:45 UT and had the complicated magnetic structure
lykhin et al., 2018a, b). Malykhin et al. (2018b) studied the      (not shown). Simultaneously with the increase in VX , a sharp
dynamics of fluxes and energy spectra of suprathermal elec-        increase in the dawn–dusk electric field (EY ) was observed.
trons during the prolonged dipolarizations and showed that         The EY field shown in Fig. 1e represents the smoothed full-
electrons can be accelerated by a betatron mechanism up to         resolution EY data by the 4 s sliding average. After the onset
∼ 90 keV. On the contrary, the behavior of ion energy spectra      of dipolarization the oscillations of the VX value and its sign
indicates the nonadiabatic character of ion acceleration in the    reversal were observed. This indicates the braking and re-
course of dipolarizations (e.g., Nosé et al., 2000; Grigorenko     flection of the fast flow (e.g., Panov et al., 2010). Multiple
et al., 2017; Malykhin et al., 2018a). However, ion dynam-         short BZ pulses were observed during the BZ growth (be-
ics and acceleration mechanisms operating in the course of         tween 18:57:49 and 18:58:30 UT) as well as at the later time
prolonged dipolarizations are still poorly understood.             when the BZ field had already reached the large magnitude.
   In this work, we study the dynamics and acceleration of            Figure 1a–c show the time profiles of suprathermal fluxes
ions of different masses (H+ , He+ , O+ ) to suprathermal en-      of H+ , He+ and O+ ions observed in several energy channels
ergies in the multiscale magnetic structure of dipolarizations     of the RAPID instrument. The corresponding average ener-
in the near-Earth magnetotail by using Cluster/RAPID ob-           gies are presented in the bottom part of each panel. The in-

Ann. Geophys., 37, 549–559, 2019                                                           www.ann-geophys.net/37/549/2019/
A. Y. Malykhin et al.: Acceleration of protons and heavy ions to suprathermal energies                                              551

                                                                       a power law at least within the energy range corresponding to
                                                                       neighboring channels of the RAPID instrument: Ji ∼ W −γ ,
                                                                       where W is ion kinetic energy (e.g., Øieroset et al., 2002;
                                                                       Imada et al., 2007). We calculated the spectral index γ as it
                                                                       was described by Kronberg and Daly (2013):

                                                                       γ = − ln(Ji2 /Ji1 )/ ln(Eeff2 /Eeff1 ).                       (1)

                                                                       Here, the Ji2 and Ji1 are the differential fluxes of ions in
                                                                       the neighboring energy channels. The effective energies Eeff2
                                                                       and Eeff1 were calculated as the geometric mean between the
                                                                       lowest energies of the neighboring channels.
                                                                          Figure 2 displays the time profiles of γ calculated for three
                                                                       types of ions (H+ , He+ , O+ ) for given energy ranges during
                                                                       the interval of interest shown in Fig. 1 (panels b–d). We also
                                                                       calculated the energy spectra of these ion components at the
                                                                       moments shown by the colored vertical lines in Fig. 2a–d
                                                                       and presented them in the right part of the figure. The gray-
                                                                       shaded areas in panels (e)–(g) indicate the energy ranges at
                                                                       which the spectra have nonmonotonic features (flattening and
                                                                       bulges). Figure 2a shows the time profiles of the BZ and BX
                                                                       components for the reference.
                                                                          Before the dipolarization onset the values of the proton’s
                                                                       γ in energy ranges ∼ 45–83 keV (shown by blue line in
                                                                       Fig. 2b, γH45 ) and ∼ 83–∼ 121 keV (shown by red line, γH83 )
                                                                       were similar (∼ 3.0). After the onset, the γH45 almost did not
                                                                       change, but the γH83 decreased down to ∼ 1.5. The decrease
                                                                       in γH83 started a few seconds before the onset and lasted until
                                                                       ∼ 18:59:20 UT. The corresponding evolution of proton spec-
                                                                       tra is displayed in Fig. 2e. One can see that the initial spec-
                                                                       trum measured at 18:57:30 UT, i.e., before the onset (shown
Figure 1. An overview of the dipolarization event observed on          by blue line), has a rather monotonic power-law shape. After
3 October 2004 by Cluster-1. Panels (a)–(c) show the time profiles     the onset the spectrum flattening in the energy range shaded
of fluxes of suprathermal H+ , He+ and O+ ions respectively mea-       by gray (∼ 83–121 keV) in Fig. 2e is observed. This feature
sured by the RAPID instrument in the energy ranges indicated in        reflects the observed significant decrease in |γH83 |. Thus, the
the corresponding panel. Panel (d) shows time profiles of the BX       proton spectrum becomes more energetic after the dipolar-
and BZ components of the magnetic field. Panels (e) and (f) display    ization onset. In the higher energy range (∼ 121–600 keV)
the dawn–dusk electric field (EY ) and X component of ion bulk ve-     the spectral index γ decreased even earlier (∼ 1 min before
locity (VX ). The onset of dipolarization is indicated by a vertical   the dipolarization onset) and it proceeded to decrease after
dotted line.                                                           the onset. This dynamic was observed simultaneously with
                                                                       the increases in proton fluxes in the corresponding energy
                                                                       channels (see Fig. 1a). The observed negative variations of
crease in fluxes of high-energy ions (∼ 120–600 keV for H+ ,           γ indicate proton acceleration near the onset-related DF as
∼ 287–1100 keV for He+ , ∼ 560–1160 keV for O+ ) started               well as within the BZ pulses observed after the onset.
∼ 1 min before the dipolarization onset, and the values of                The dynamics of He+ spectra are more or less similar to
these fluxes remained large for several minutes after the on-          those of the proton (see Fig. 2c, f). The spectral index γ in
set. At the same time the ion fluxes in a lower energy range           the lower energy range ∼ 154–201 keV (shown by the blue
(∼ 45–80 keV for H+ , ∼ 150–200 keV for He+ and ∼ 340–                 line in Fig. 2c, γHe154 ) decreased slightly for the entire inter-
450 keV for O+ ) decreased during the dipolarization. The              val of interest. On the contrary, in the higher energy range
contrasting dynamics of ion fluxes in different energy ranges          ∼ 201–508 keV the γHe started to decrease ∼ 1 min before
caused the variations in energy spectra and the formation of           the onset of dipolarization and proceeded to decrease after
nonmonotonic features like flattening and bulges.                      the onset. The strongest and most prolonged negative vari-
   To quantify the energy spectra of suprathermal ions we              ation of γHe was observed in the 201.3–287.3 keV energy
used the value of the spectral index γ . To calculate the γ we         range (Fig. 2c). Similarly to protons in the energy spectrum
assume that the ion differential flux (Ji ) can be described by        of He+ ions the flattening in a finite energy range (∼ 201–

www.ann-geophys.net/37/549/2019/                                                                  Ann. Geophys., 37, 549–559, 2019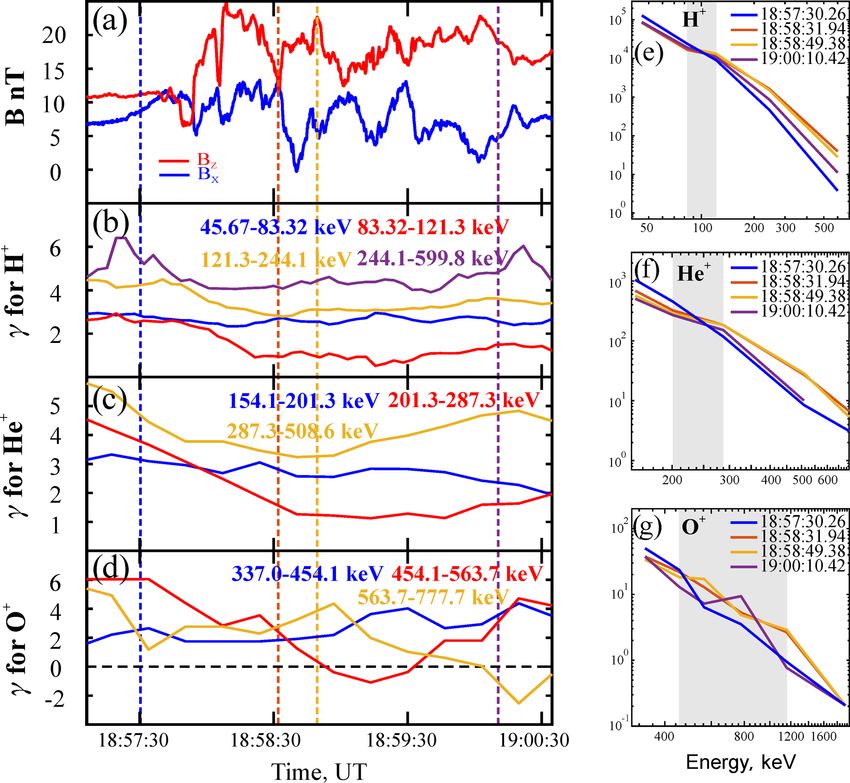
552                                  A. Y. Malykhin et al.: Acceleration of protons and heavy ions to suprathermal energies

Figure 2. Variations of spectral index γ calculated for H+ (b), He+ (c) and O+ (d) ion components in the energy ranges indicated in the
corresponding panels. Panel (a) shows the time profiles of BX and BZ field for reference. Vertical dashed colored lines indicate the time
moments at which energy spectra of H+ , He+ and O+ ions are plotted in panels (e)–(d) respectively. The gray-shaded areas in panels (e)–(d)
display the energy ranges at which the peculiarities (flattening or bulges) are observed in the energy spectra.

287 keV) was observed after the dipolarization onset (see the              The dynamics of fluxes and energy spectra of different ion
gray-shaded area in Fig. 2f).                                           components observed before and after the dipolarization on-
   The dynamics of energy spectra of oxygen ions are dif-               set indicates the ion acceleration in the limited energy ranges,
ferent from the dynamics of light ions spectra. In the lower            which occurred at different stages of dipolarization for ions
energy range (∼ 337–454 keV, shown by blue line in Fig. 2d)             of different masses. In the next section we present the statis-
the γO337 experienced a slight increase over the entire interval        tical analysis of these phenomena.
of interest. In the higher energy range the fluxes of O+ started
to grow ∼ 30 s before the onset (see Fig. 1c). This manifests
in a sharp decrease in γO563 (shown by the yellow line in               3   Statistical studies
Fig. 2d). Then, after the onset the γO563 experienced bipolar
                                                                        In the previous section it was shown that fluxes of H+ , He+
variations and its strongest negative variation was observed
                                                                        and O+ ions with energies ≥ 121, 201 and 454 keV respec-
only by the end of interval of interest, at around 19:00:20 UT.
                                                                        tively increased during the dipolarization, while ion fluxes
In the middle energy range (∼ 454–654 keV, shown by red
                                                                        in the lower energy range either decreased or remained un-
line in Fig. 2d) the decrease in γO454 also started before the
                                                                        changed. This behavior caused the negative variations of
dipolarization onset, but later than the start of γO563 decrease.
                                                                        spectral index γ . To study statistically the dynamics of ion
The decrease in γO454 lasted after the dipolarization onset
                                                                        fluxes and the γ we applied the superposed epoch analysis
until ∼ 18:59:20 UT. Thus, there were time delays between
                                                                        to 17 dipolarization events from the list published by Grig-
variations of γO454 and γO563 . These features in the dynam-
                                                                        orenko et al. (2016), whereas the O+ fluxes were statistically
ics of γ at different energy ranges result in observations of
                                                                        reliable only in 11 events. The list of events used in our sta-
bulges in the energy spectra of O+ ions after the dipolariza-
                                                                        tistical studies is presented in Table 1.
tion onset (see Fig. 2g).

Ann. Geophys., 37, 549–559, 2019                                                                  www.ann-geophys.net/37/549/2019/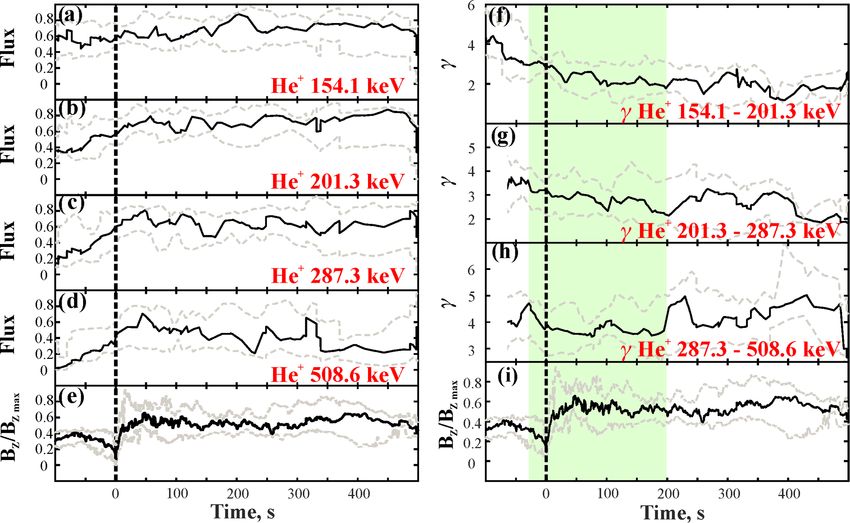
A. Y. Malykhin et al.: Acceleration of protons and heavy ions to suprathermal energies 553
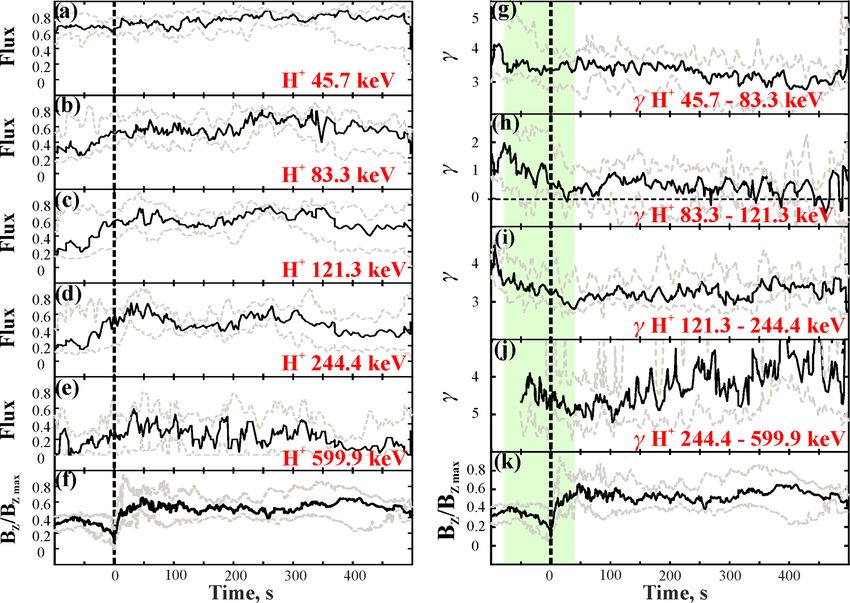
Table 1. The list of time moments of the dipolarization onset ob- ics of He+ fluxes are similar to the dynamics of H+ fluxes.
served in the events from our database. “+” marks those events, in The monotonic increase in helium fluxes (∼ 201–508 keV)
which the reliable fluxes of H+ , He+ and O+ ions were detected started ∼ 1.5 min before the dipolarization onset and lasted
by RAPID instrument. for ∼ 1 min after the onset (see Fig. 4b–d). Conversely the
decrease in spectral index γ in ∼ 154–508 keV, although it
Date H+ /He+ O+ started ∼ 1 min before the dipolarization onset, was observed
12 August 2001 18:17 + for a longer period: for ∼ 3 min after the onset (see green-
15 September 2001 00:43 + + shaded interval in Fig. 4f–i). Thus, after the dipolarization
15 September 2001 01:02 + onset the acceleration of He+ lasted longer than the proton’s
26 October 2002 07:27 + acceleration.
25 July 2003 07:05 + + Figure 5 shows the epoch profiles of fluxes (panels a–e)
25 July 2003 07:21 + + and the γ (panels f–i) of O+ ions observed in 11 dipolariza-
27 July 2003 13:45 + + tion events from Table 1. The increase in fluxes of O+ ions
29 July 2003 18:36 + +
(∼ 337–563 keV) was observed at the similar timescale as the
1 August 2003 06:32 +
24 September 2003 15:10 +
increase in energetic H+ and He+ fluxes (see green-shaded
24 September 2003 16:07 + + interval in Fig. 5a–e). However, the monotonic decrease in
3 October 2004 18:57 + γ was observed only in the ∼ 454–564 keV energy range.
11 October 2004 01:35 + + It started just before the dipolarization onset and lasted for
13 October 2004 05:49 + + ∼ 5 min after the onset (see green-shaded interval in Fig. 5h).
13 October 2004 06:55 + + In the lower energy range the γ experienced bipolar vari-
9 August 2005 18:29 + + ations which started ∼ 50 s before the onset and were ob-
28 September 2005 17:13 + + served for ∼ 7 min after the onset. The signatures of flatten-
ing of energy spectrum (γ ∼ 0) were observed in the energy
range of ∼ 337–454 keV after the onset (Fig. 5g). It is worth
noting that in the energy spectra of oxygen ions the negative
Figure 3 shows the epoch profiles of fluxes (panels a–f) variations of γ were much stronger (1γO+ ∼ −5 to −3) than
and γ (panels g–k) of H+ ions for 17 events listed in Ta- the ones detected in the spectra of light ions (1γH+ ∼ −2,
ble 1. Figure 3f and k display the epoch profiles of the BZ 1γHe+ ∼ −2.5).
field. For each event the BZ field was normalized to the max- Indeed, in Fig. 6 we present the distribution of probability
imum value of the BZ observed in a given event: BZ∗ (t) = to observe the given values of 1γ for each ion component
BZ (t)/BZmax . The proton fluxes observed in a given energy and for each energy range calculated for the dipolarization
range were also normalized in a similar way. As the epoch events from our database. The 1γ values were calculated
time (t = 0) we use the dipolarization onset detected in each in the following way. For each dipolarization event we de-
event. The black lines display the median profiles of fluxes termine the maximum value of the spectral index observed
and BZ∗ (t) and gray dashed lines show lower and upper quar- around the dipolarization onset (γ0 ), the minimum value γ1
tiles of the corresponding epoch profiles. observed after the onset and the maximum value γ2 observed
The increase in the suprathermal H+ fluxes (∼ 83– during the relaxation of γ by the end of the dipolarization.
600 keV) started ∼ 1.5 min before the dipolarization onset Then, for each event we calculate the negative variation 1γ−
and it lasted for ∼ 1 min after the onset. During this time as γ1 − γ0 , and the positive variation 1γ+ as γ2 − γ1 , and
the γ calculated for this energy range decreased (the green- select the strongest one from them. Thus, in Fig. 6 we show
shaded interval in Fig. 3g–k). However, in the lower en- the probability to observe a given value of either positive or
ergy range (∼ 45 keV) the proton flux hardly changed (see negative γ variations observed in each dipolarization event.
Fig. 3a), and the corresponding spectral index γH45 was al- One can see that the 1γH+ and 1γHe+ values are mainly
most constant (∼ 3.5; see Fig. 3g) for all dipolarization in- ranged between −5.0 and 0.0, while the majority of 1γO+
tervals. Thus, the decrease in γ was observed only in the is ranged between −10.0 and −3.0. Since the negative varia-
limited energy range simultaneously with the flux increase in tions of γ indicate the ion acceleration one may assume that
this range. This indicates that the proton energization reaches heavy ions (O+ ) experience stronger acceleration than light
energies of ≥ 83 keV in the course of dipolarizations. It is ions (H+ and He+ ) during dipolarizations.
also worth noting that after the dipolarization onset the γH83
decreased down to zero. This indicates the flattening of pro-
ton spectra in the finite energy range (∼ 83–121 keV; see 4 Discussion
Fig. 3h).
Figure 4 presents the epoch profiles of fluxes (panels a–e) In this paper, we analyze the dynamics and spectra of fluxes
and γ (panels f–i) of He+ ions for 17 events from Table 1. of different ion components (H+ , He+ , O+ ) in suprather-
The format of the figure is the same as in Fig. 3. The dynam- mal energy range (45–700 keV) during dipolarizations in
www.ann-geophys.net/37/549/2019/ Ann. Geophys., 37, 549–559, 2019554 A. Y. Malykhin et al.: Acceleration of protons and heavy ions to suprathermal energies Figure 3. Panels (a)–(e) show the epoch profiles of H+ ion fluxes with energies indicated in the corresponding panel. Panels (g)–(j) display the epoch profiles of γ calculated in the given energy ranges indicated in the corresponding panel. Panels (f) and (k) show the epoch profile of the normalized BZ magnetic field (see explanation in the text). The vertical dotted line marks the epoch time t = 0, which corresponds to dipolarization onset in each event from our database. The green-shaded area in panels (g)–(k) displays the time interval of the γ decrease. The black lines display the median profiles of fluxes and BZ∗ (t) and gray dashed lines show lower and upper quartiles of the corresponding epoch profiles. the near-Earth magnetotail (X > −17RE ) according to Clus- tral index should be almost constant (e.g., Pan et al., 2012). ter/RAPID observations made in 2001–2005. By using su- However, in all dipolarization events from our database we perposed epoch analysis we show that the increase in the observed strong negative variations of γ in the limited en- suprathermal ion fluxes (H+ , He+ , O+ ) started ∼ 1 min be- ergy range for all ion components. For O+ ions these vari- fore the onset of dipolarizations, and the fluxes continued to ations were in ∼ 2.5 times larger than for light ions. The grow for ∼ 1 min after the onset. The fact that the fluxes of amplitude of the negative variations of γ and the duration different ion components started to increase simultaneously of the γ decrease demonstrate that oxygen ions experience and the duration of the flux growth is similar for ions of dif- stronger nonadiabatic acceleration than light ions (H+ and ferent masses can be related to the contraction of magnetic He+ ). Other important spectral features in favor of a nonadi- flux tubes during dipolarization. The contraction of magnetic abatic acceleration mechanism are the flattening of ion spec- flux tubes can lead to the increase in ion density, which, in tra and the formation of bulges in a finite energy range. turn, leads to the flux increase. However, our observations Theoretical studies and modeling of ion acceleration in demonstrate that the spectral index γ started to decrease al- a single DF were performed in many papers before (e.g., most simultaneously with the flux increase. But, unlike the Ukhorski et al., 2013; Perri et al., 2009; Greco et al., 2010). behavior of ion fluxes, the decrease in γ was observed during It was shown that the efficiency of charged-particle acceler- different time intervals for different types of ions. Namely, ation depends not only on the amplitude of the electric field for protons, the decrease in γ was observed for ∼ 1 min after associated with the DF, but also on the spatial structure of this the onset, while for He+ and O+ ions the γ decreased for field and the particular location of particle arrival into the ac- ∼ 3 and ∼ 5 min after the onset respectively. celeration region (Artemyev et al., 2015). Greco et al. (2014) The decrease in γ indicates the presence of nonadiabatic showed that the DF propagating earthward has a complex acceleration of different ion components during dipolariza- 2-D electric field structure, which is defined by the front tion. Indeed if the ion acceleration were adiabatic the spec- propagation velocity (Vf ) and the following spatial scales: Ann. Geophys., 37, 549–559, 2019 www.ann-geophys.net/37/549/2019/
A. Y. Malykhin et al.: Acceleration of protons and heavy ions to suprathermal energies                                               555

Figure 4. The epoch profiles for He+ ions. The format of the figure is similar to the format of Fig. 3.

Figure 5. The epoch profiles for O+ ions. The format of the figure is similar to the format of Fig. 3.

magnetic ramp thickness (lf ) and DF width (Lf ). It was also             He+ ∼ 20–140 keV and for O+ ∼ 40–240 keV, depending on
shown that the acceleration of charged particles also depends             the DF velocity range, which varies from 200 to 800 km s−1 .
on the initial energy and mass of ions (Greco et al., 2015).                Assuming the same acceleration mechanism, we suggest
Thus, heavy ions (O+ ) should experience more efficient ac-               that ions obtain energy by passing the potential drop in the
celeration than light ions. According to their estimations the            Y direction, in the course of their interaction with the DF.
characteristic energy gain for H+ ions is ∼ 20–80 keV, for                To check this, we estimated the front parameters necessary

www.ann-geophys.net/37/549/2019/                                                                         Ann. Geophys., 37, 549–559, 2019
556                                  A. Y. Malykhin et al.: Acceleration of protons and heavy ions to suprathermal energies

Figure 6. Distribution of probability to observe the given values of
γ variations (see explanation in the text) for H+ , He+ and O+ ion
components. For each ion component the energy ranges used for γ
calculation are indicated by colors according to a legend shown in
the corresponding panel.

for such acceleration. By using minimum variance analysis
and timing analysis (Sonnerup and Scheible, 1998) we deter-
mined the direction and value of the propagation velocity of
the DFs in the (XY ) plane (Vf ) for each dipolarization event
from our database (see Table 2). Then, by using the Vf value
and the amplitude of the BZ variation (1BZ ) at the DFs we             Figure 7. Histograms of probability to observe the given values of
                                                                       H+ , He+ and O+ ion energy gain in the course of nonadiabatic
estimated roughly the electric field associated with the front:
                                                                       acceleration at the onset-related DF (see explanation in the text).
E = 1BZ ·Vf . Since in the course of nonadiabatic interaction
with the DF ions obtain energy at spatial scale of ∼ 2rL (rL is
the ion gyroradius), one can estimate roughly the minimum              to transfer some fraction of ion population from the lower
ion energy gain as 1W = 2E · rL .                                      part of suprathermal energy distribution to the higher energy
   It is worth noting that in each dipolarization event from           range. These results are within the energy ranges obtained by
our database we observed the decrease in ion fluxes in the             Greco et al. (2015) for the energy gain provided by the nona-
lowest RAPID channels along with the increase in fluxes                diabatic acceleration in the course of ion interaction with a
in higher energy channels. This effect was observed for all            single propagating DF.
types of ions (see Fig. 1). It can be due to the nonadiabatic             However, our analysis of the γ dynamics showed that
acceleration of ion populations with initial energies corre-           some fraction of light ions can be accelerated to energies of
sponding to the lowest RAPID channels. This results in the             more than 600 keV and some fraction of oxygen ions can be
replenishment of more energetic ion population and the cor-            accelerated up to ∼ 1.2 MeV. Thus, in some cases the amount
responding flux increase in higher energy channels. Based on           of energy gain may exceed both the theoretical and our own
these observations, for rL calculation we used the ion energy          estimations of 1W . It is worth noting that these estimations
corresponding to the lowest RAPID channels for each type               were obtained for a single propagating DF. However, dipo-
of ions. Since in the course of ion nonadiabatic interaction           larizations analyzed in our study represent long-lasting com-
with the DF the rL changes both due to the increase in |B|             plicated events, which consist of multiple DFs with different
at the front and due to the increase in ion energy, then for           spatial scales. In the course of interactions with such multi-
the rough estimate of rL we use the average value of the |B|:          scale magnetic structures ions can experience multistage en-
< B >= (Bmin +Bmax )/2, where Bmin is the minimum value                ergy gain. We may suggest that ions are accelerated due to
of the magnetic field observed at the dip region before the DF         their subsequent nonadiabatic interactions with the system
(e.g., Shiokawa et al., 2005) and Bmax is the maximum value            of multiple DFs and, thus, their resulting energy gain can ex-
of the magnetic field corresponding to the DF.                         ceed the energy gain estimated for the interaction with a sin-
   Figure 7 shows the probability distribution of the 1W               gle DF. Verification of this assumption requires simulation of
of each ion component estimated for all events from our                ion dynamics in complicated multiscale dipolarizations.
database. The normal mean values for the distributions are
∼ 24 keV for H+ , ∼ 89 keV for He+ and ∼ 223 keV for
O+ ions. The estimated values of energy gain are enough

Ann. Geophys., 37, 549–559, 2019                                                                www.ann-geophys.net/37/549/2019/
A. Y. Malykhin et al.: Acceleration of protons and heavy ions to suprathermal energies 557
Table 2. Parameters of the DFs observed in dipolarization events from our database, namely, the values of the propagation velocity of the
DFs (Vf ) in the (XY ) plane, maximum values of the BZ field (BZmax ), the amplitude of the BZ field variation (1BZ ) associated with the DFs,
magnetic field value in the dip region observed before the DFs (|B|dip ) and the maximum values of the magnetic field at the DFs (|B|max ).
Date and time UT Vf (km s−1 ) BZmax 1BZ |B|dip |B|max
12 August 2001 18:17 174 14.5 15.6 8.8 20.0
15 September 2001 00:43 294 17.2 16.3 7.4 23.3
15 September 2001 01:02 320 19.9 16.1 16.1 21.0
25 July 2003 07:05 180 12.1 10.6 22.3 24.4
25 July 2003 07:06 347 13.8 11.3 24.7 25.8
25 July 2003 07:21 270 19.3 19.5 14.8 23.2
25 July 2003 07:29 227 20.1 10.9 16.2 24.5
27 July 2003 13:45 274 14.1 10.3 11.7 19.3
29 July 2003 18:36 232 21.4 13.9 13.3 24.3
29 July 2003 18:46 328 22.1 11.1 15.4 26.7
1 August 2003 06:32 300 16.1 16.6 4.8 19.2
1 August 2003 06:35 378 14.5 15.4 5.7 17.3
24 September 2003 15:10 646 15.8 11.8 4.6 17.4
24 September 2003 15:11 714 17.2 10.1 8.4 19.3
24 September 2003 16:07 279 25.5 29.6 18.5 26.7
24 September 2003 16:10 341 27.1 27.2 20.1 28.2
3 October 2004 18:57 352 26.5 21.5 7.6 29.9
5 Conclusion 4. The strong negative variations of γ were observed in
finite energy ranges for all ion components. This indi-
In this paper we studied the dynamics of fluxes and spectra of cates the possibility of nonadiabatic resonant accelera-
suprathermal ions of different masses during dipolarizations tion of ions in the course of their interaction with multi-
in the near-Earth geomagnetic tail (X > −17RE ) according ple DFs during dipolarizations.
to Cluster/RAPID observations made in 2001–2005. Below
we summarize our main results:
Data availability. In this paper we only used open-access data. The
1. During dipolarizations in the near-Earth magnetotail the Cluster data were downloaded from the Cluster Science Archive
increase in fluxes of different ion components was ob- version 1.2.1 at http://www.cosmos.esa.int/web/csa (last access: 5
served in the following energy ranges: ∼ 120–600 keV March 2018). To obtain the data, one should start the CSA graph-
for H+ , ∼ 287–1100 keV for He+ and ∼ 560–1160 keV ical user interface, and then to download the data, the particular
for O+ ions. These increases started ∼ 1 min before the instrument and time interval should be selected.
onset of dipolarizations and lasted for ∼ 1 min after the
onset. Simultaneously with the flux increase in higher
energy channels, the decrease in fluxes in lower ener- Author contributions. EEG and AYM wrote the paper and made
data analysis. EAK and PWD produced the data and controlled the
gies channels was detected. This indicates the presence
data quality. LVK calculated theoretical energy gain.
of nonadiabatic effects in the dynamics of the suprather-
mal ion fluxes.
Competing interests. The authors declare that they have no conflict
2. Simultaneously with the start of flux increase, the de- of interest.
crease in the value of the spectral index γ was observed.
The duration and amplitude of negative variations of γ
depend on the ion mass. In each dipolarization event Acknowledgements. The work of Andrei Y. Malykhin and
from our database the acceleration of heavy ions was Elena E. Grigorenko was supported by the Russian Science Founda-
observed after the onset during the longer time interval tion (grant no. 18-47-05001). The work of Elena A. Kronberg and
than the acceleration of light ions. Ludmila V. Kozak was supported by the Volkswagen Foundation
(grant Az 90 312). Elena A. Kronberg and Patrick W. Daly acknowl-
3. The largest amplitude of negative variations in γ was edge the “Deutsches Zentrum für Luft und Raumfahrt (DLR)” for
detected for heavy ions (O+ ). This demonstrates that the support of the RAPID instrument under grant 50 OC 1602.
more efficient acceleration is observed for heavy ions
than for light ions (H+ , He+ ).
www.ann-geophys.net/37/549/2019/ Ann. Geophys., 37, 549–559, 2019558 A. Y. Malykhin et al.: Acceleration of protons and heavy ions to suprathermal energies
Financial support. This research has been supported by the Rus- Greco, A., Artemyev, A., and Zimbardo, G.: Proton accel-
sian Science Foundation (grant no. 18-47-05001), the Volkswagen eration at two-dimensional dipolarization fronts in the
Foundation (grant no. Az 90 312), and the Deutsches Zentrum für magnetotail, J. Geophys. Res.-Space, 119, 8929–8941,
Luft und Raumfahrt (DLR) (grant no. 50 OC 1602). https://doi.org/10.1002/2014JA020421, 2014.
Greco, A., Artemyev, A., and Zimbardo, G.: Heavy ion acceleration
at dipolarization fronts in planetary magnetotails, Geophys. Res.
Review statement. This paper was edited by Nick Sergis and re- Lett., 42, 8280–8287, https://doi.org/10.1002/2015GL066167,
viewed by two anonymous referees. 2015.
Grigorenko, E. E., Kronberg, E. A., Daly, P. W., Ganushk-
ina, N. Yu., Lavraud, B., Sauvaud, J.-A., and Zelenyi, L.
M.: Origin of low proton-to-electron temperature ratio in the
References Earth’s plasma sheet, J. Geophys. Res.-Space, 121, 9985–10004,
https://doi.org/10.1002/2016JA022874, 2016.
Angelopoulos, V., Baumjohann, W., Kennel, C. F., Coroniti, Grigorenko, E. E., Kronberg, E. A., and Daly, P. W.: Heating and
F. V., Kivelson, M. G., Pellat, R., Walker, R. J., Lühr, Acceleration of Charged Particles during Magnetic Dipolariza-
H., and Paschmann, G.: Bursty bulk flows in the inner tions, Cosmic Res.+, 55, 57–66, 2017.
central plasma sheet, J. Geophys. Res., 97, 4027–4039, Grigorenko, E. E., Dubyagin, S., Malykhin, A. Yu., Khotyaintsev,
https://doi.org/10.1029/91JA02701, 1992. Yu. V., Kronberg, E. A., Lavraud, B., and Ganushkina, N. Yu.:
Apatenkov, S. V., Sergeev, V. A., Kubyshkina, M. V., Nakamura, Intense current structures observed at electron kinetic scales in
R., Baumjohann, W., Runov, A., Alexeev, I., Fazakerley, A., the near-Earth magnetotail during dipolarization and substorm
Frey, H., Muhlbachler, S., Daly, P. W., Sauvaud, J.-A., Ganushk- current wedge formation, Geophys. Res. Lett., 45, 602–611,
ina, N., Pulkkinen, T., Reeves, G. D., and Khotyaintsev, Y.: https://doi.org/10.1002/2017GL076303, 2018.
Multi-spacecraft observation of plasma dipolarization/injection Gustafsson, G., André, M., Carozzi, T., Eriksson, A. I., Fältham-
in the inner magnetosphere, Ann. Geophys., 25, 801–814, mar, C.-G., Grard, R., Holmgren, G., Holtet, J. A., Ivchenko, N.,
https://doi.org/10.5194/angeo-25-801-2007, 2007. Karlsson, T., Khotyaintsev, Y., Klimov, S., Laakso, H., Lindqvist,
Artemyev, A. V., Lutsenko, V. N., and Petrukovich, A. A.: Ion P.-A., Lybekk, B., Marklund, G., Mozer, F., Mursula, K., Ped-
resonance acceleration by dipolarization fronts: analytic the- ersen, A., Popielawska, B., Savin, S., Stasiewicz, K., Tanska-
ory and spacecraft observation, Ann. Geophys., 30, 317–324, nen, P., Vaivads, A., and Wahlund, J.-E.: First results of elec-
https://doi.org/10.5194/angeo-30-317-2012, 2012. tric field and density observations by Cluster EFW based on
Artemyev, A. V., Liu, J., Angelopoulos, V., and Runov, A.: initial months of operation, Ann. Geophys., 19, 1219–1240,
Acceleration of ions by electric field pulses in the in- https://doi.org/10.5194/angeo-19-1219-2001, 2001.
ner magnetosphere, J. Geophys. Res.-Space, 120, 4628–4640, Imada, S., Nakamura, R., Daly, P.W., Hoshino, M., Baumjo-
https://doi.org/10.1002/2015JA021160, 2015. hann, W., Muhlbachler, S., Balogh, A., and Reme, H.:
Asano, Y., Shinohara, I., Retinò, A., Daly, P. W., Kron- Energetic electron acceleration in the downstream recon-
berg, E. A., Takada, T., Nakamura, R., Khotyaintsev, Y. nection outflow region, J. Geophys. Res., 112, A03202,
V., Vaivads, A., Nagai, T., Baumjohann, W., Fazakerley, A. https://doi.org/10.1029/2006JA011847, 2007.
N., Owen, C. J., Miyashita, Y., Lucek, E. A., and Rème, Kronberg, E. A. and Daly, P. W.: Spectral analysis for wide en-
H.: Electron acceleration signatures in the magnetotail as- ergy channels, Geosci. Instrum. Method. Data Syst., 2, 257–261,
sociated with substorms, J. Geophys. Res., 115, A05215, https://doi.org/10.5194/gi-2-257-2013, 2013.
https://doi.org/10.1029/2009JA014587, 2010. Liu, J., Angelopoulos, V., Runov, A., and Zhou, X.-Z.: On the cur-
Balogh, A., Carr, C. M., Acuña, M. H., Dunlop, M. W., Beek, T. rent sheets surrounding dipolarizing flux bundles in the magne-
J., Brown, P., Fornacon, K.-H., Georgescu, E., Glassmeier, K.- totail. The case of wedgelets, J. Geophys. Res., 118, 2000–2020,
H., Harris, J., Musmann, G., Oddy, T., and Schwingenschuh, K.: https://doi.org/10.1002/jgra.50092, 2013.
The Cluster Magnetic Field Investigation: overview of in-flight Liu, J., Angelopoulos, V., Runov, A., and Zhou, X.-Z.: Magnetic
performance and initial results, Ann. Geophys., 19, 1207–1217, flux transport by dipolarizing flux bundles, J. Geophys. Res., 119,
https://doi.org/10.5194/angeo-19-1207-2001, 2001. 909–926, https://doi.org/10.1002/2013JA019395, 2014.
Delcourt, D. C.: Particle acceleration by inductive electric fields in Lui, A. T. Y.: Reduction of the cross-tail current during near-Earth
the inner magnetosphere, J. Atmos. Sol.-Terr. Phy., 64, 551–559, dipolarization with multisatellite observations, J. Geophys. Res.,
2002. 116, A12239, https://doi.org/10.1029/2011JA017107, 2011.
Delcourt, D. C. and Sauvaud, J. A.: Plasma sheet ion energiza- Malykhin, A. Y., Grigorenko, E. E., Kronberg, E. A., Koleva,
tion during dipolarization events, J. Geophys. Res., 99, 97–108, R., Ganushkina, N. Y., Kozak, L., and Daly, P. W.: Con-
https://doi.org/10.1029/93JA01895, 1994. trasting dynamics of electrons and protons in the near-Earth
Fu, H. S., Khotyaintsev, Y. V., André, M., and Vaivads, A.: plasma sheet during dipolarization, Ann. Geophys., 36, 741–760,
Fermi and betatron acceleration of suprathermal electrons be- https://doi.org/10.5194/angeo-36-741-2018, 2018a.
hind dipolarization fronts, Geophys. Res. Lett., 38, L16104, Malykhin, A. Yu., Grigorenko, E. E., Kronberg, E. A., and
https://doi.org/10.1029/2011GL048528, 2011. Daly, P. W.: The Effect of the Betatron Mechanism on the
Greco, A., Perri, S., and Zimbardo, G.: Stochastic Dynamics of Superthermal Electron Fluxes within Dipoliza-
Fermi acceleration in the magnetotail current sheet: tions in the Magnetotail, Geomagn. Aeronomy+, 58, 744–752,
A numerical study, J. Geophys. Res., 115, A02203, https://doi.org/10.1134/S0016793218060099, 2018b.
https://doi.org/10.1029/2009JA014690, 2010.
Ann. Geophys., 37, 549–559, 2019 www.ann-geophys.net/37/549/2019/A. Y. Malykhin et al.: Acceleration of protons and heavy ions to suprathermal energies 559 McPherron, R. L., Russell, C. T., and Aubry, M. A.: Satellite studies spectrometry (CIS) experiment, Ann. Geophys., 19, 1303–1354, of magnetospheric substorms on august 15, 1968, 9, phenomeno- https://doi.org/10.5194/angeo-19-1303-2001, 2001. logical model for substorms, J. Geophys. Res., 78, 3131–3149, Runov, A., Angelopoulos, V., Sitnov, M. I., Sergeev, V. A., https://doi.org/10.1029/JA078i016p03131, 1973. Bonnell, J., McFadden, J. P., Larson, D., Glassmeier, K.- Nakamura, R., Baumjohann, W., Klecker, B., Bogdanova, Y., H., and Auster, U.: THEMIS observations of an earthward- Balogh, A., Reme, H., Bosqued, J. M., Dandouras, I., Sauvaud, propagating dipolarization front, Geophys. Res. Lett., 36, J. A., Glassmeier, K. H., Kistler, L., Mouikis, C., Zhang, T. L., L14106, https://doi.org/10.1029/2009GL038980, 2009. Eichelberger, H., and Runov, A.: Motion of the dipolarization Runov, A., Angelopoulos, V., Zhou, X.-Z., Zhang, X.-J., Li, S., front during a flow burst event observed by Cluster, Geophys. Plaschke, F., and Bonnell, J.: A THEMIS multicase study of Res. Lett., 29, 1942, https://doi.org/10.1029/2002GL015763, dipolarization fronts in the magnetotail plasma sheet, J. Geophys. 2002. Res., 116, A052216, https://doi.org/10.1029/2010JA016316, Nakamura, R., Retinò, A., Baumjohann, W., Volwerk, M., Erkaev, 2011. N., Klecker, B., Lucek, E. A., Dandouras, I., André, M., Schmid, D., Volwerk, M., Nakamura, R., Baumjohann, W., and Khotyaintsev, Y.: Evolution of dipolarization in the near- and Heyn, M.: A statistical and event study of magne- Earth current sheet induced by Earthward rapid flux transport, totail dipolarization fronts, Ann. Geophys., 29, 1537–1547, Ann. Geophys., 27, 1743–1754, https://doi.org/10.5194/angeo- https://doi.org/10.5194/angeo-29-1537-2011, 2011. 27-1743-2009, 2009. Sergeev, V. A., Angelopoulos, V., and Nakamura, R.: Recent ad- Nosé, M., Lui, A. T. Y., Ohtani, S., Mauk, B. H., McEntire, vances in understanding substorm dynamics, Geophys. Res. R. W., Williams, D. J., Mukai, T., and Yumoto, K.: Acceler- Lett., 39, L05101, https://doi.org/10.1029/2012GL050859, 2012. ation of oxygen ions of ionospheric origin in the near-Earth Shiokawa, K., Miyashita, Y., Sinohara, I., and Matsuoka, magnetotail during substorms, J. Geophys. Res., 105, 7669, A.: Decrease in BZ prior to the dipolarization in the https://doi.org/10.1029/1999JA000318, 2000. near-Earth plasma sheet, J. Geophys. Res., 110, A09219, Øieroset, M., Lin, R. P., Phan, T. D., Larson, D. E., and https://doi.org/10.1029/2005JA011144, 2005. Bale, S. D.: Evidence for Electron Acceleration up to Sitnov, M. I, Swisdak, M., and Divin, A. V.: Dipolar- ∼ 300 keV in the Magnetic Reconnection Diffusion Re- ization fronts as a signature of transient reconnection gion of Earth’s Magnetotail, Phys. Rev. Lett., 89, 195001, in the magnetotail, J. Geophys. Res., 114, A04202, https://doi.org/10.1029/2012JA018156, 2002. https://doi.org/10.1029/2008JA013980, 2009. Pan, Q., Ashour-Abdalla, M., El-Alaoui, M., Walker, R. J., and Sonnerup, B. U. Ö. and Scheible M.: Analysis Methods for Multi- Goldstein, M. L.: Adiabatic acceleration of suprathermal elec- Spacecraft Data, edited by: Pashmann, G. and Daly, P. W., trons associated with dipolarization fronts, J. Geophys. Res., 117, ISSI Scientific Report SR-001, Bern, Chap. 8, p. 185, avail- A12224, https://doi.org/10.1029/2012JA018156, 2012. able at: http://www.issibern.ch/PDF-Files/analysis_methods_1_ Panov, E. V., Nakamura, R., Baumjohann, W., Angelopoulos, V., 1a.pdf (last access: 6 July 2019), 1998. Petrukovich, A. A., Retinò, A., Volwerk, M., Takada, T., Glass- Ukhorskiy, A. Y., Sitnov, M. I., Merkin, V. G., and Artemyev, A. V.: meier, K. H., McFadden, J. P., and Larson, D.: Multiple over- Rapid acceleration of protons upstream of earthward propagating shoot and rebound of a bursty bulk flow, Geophys. Res. Lett., 37, dipolarization fronts, J. Geophys. Res.-Space, 118, 4952–4962, L08103, https://doi.org/10.1029/2009GL041971, 2010. https://doi.org/10.1002/jgra.50452, 2013. Perri, S., Greco, A., and Zimbardo, G.: Stochastic and direct ac- Wilken, B., Daly, P. W., Mall, U., Aarsnes, K., Baker, D. N., Belian, celeration mechanisms in the Earth’s magnetotail, Geophys. Res. R. D., Blake, J. B., Borg, H., Büchner, J., Carter, M., Fennell, J. Lett., 36, L04103, https://doi.org/10.1029/2008GL036619, 2009. F., Friedel, R., Fritz, T. A., Gliem, F., Grande, M., Kecskemety, Rème, H., Aoustin, C., Bosqued, J. M., Dandouras, I., Lavraud, B., K., Kettmann, G., Korth, A., Livi, S., McKenna-Lawlor, S., Mur- Sauvaud, J. A., Barthe, A., Bouyssou, J., Camus, Th., Coeur-Joly, sula, K., Nikutowski, B., Perry, C. H., Pu, Z. Y., Roeder, J., O., Cros, A., Cuvilo, J., Ducay, F., Garbarowitz, Y., Medale, J. Reeves, G. D., Sarris, E. T., Sandahl, I., Søraas, F., Woch, J., L., Penou, E., Perrier, H., Romefort, D., Rouzaud, J., Vallat, C., and Zong, Q.-G.: First results from the RAPID imaging ener- Alcaydé, D., Jacquey, C., Mazelle, C., d’Uston, C., Möbius, E., getic particle spectrometer on board Cluster, Ann. Geophys., 19, Kistler, L. M., Crocker, K., Granoff, M., Mouikis, C., Popecki, 1355–1366, https://doi.org/10.5194/angeo-19-1355-2001, 2001. M., Vosbury, M., Klecker, B., Hovestadt, D., Kucharek, H., Zhou, X., Angelopoulos, V., Sergeev, V. A., and Runov, Kuenneth, E., Paschmann, G., Scholer, M., Sckopke, N., Sei- A.: Accelerated ions ahead of earthward propagating denschwang, E., Carlson, C. W., Curtis, D. W., Ingraham, C., dipolarization fronts, J. Geophys. Res., 115, A00I03, Lin, R. P., McFadden, J. P., Parks, G. K., Phan, T., Formisano, https://doi.org/10.1029/2010JA015481, 2010. V., Amata, E., Bavassano-Cattaneo, M. B., Baldetti, P., Bruno, R., Chionchio, G., Di Lellis, A., Marcucci, M. F., Pallocchia, G., Korth, A., Daly, P. W., Graeve, B., Rosenbauer, H., Va- syliunas, V., McCarthy, M., Wilber, M., Eliasson, L., Lundin, R., Olsen, S., Shelley, E. G., Fuselier, S., Ghielmetti, A. G., Lennartsson, W., Escoubet, C. P., Balsiger, H., Friedel, R., Cao, J.-B., Kovrazhkin, R. A., Papamastorakis, I., Pellat, R., Scudder, J., and Sonnerup, B.: First multispacecraft ion measurements in and near the Earth’s magnetosphere with the identical Cluster ion www.ann-geophys.net/37/549/2019/ Ann. Geophys., 37, 549–559, 2019
You can also read