Accessing India's Equity Markets - Reform, Perform and Transform February 2018 - ASIFMA
←
→
Page content transcription
If your browser does not render page correctly, please read the page content below

Accessing India’s Equity Markets
         Reform, Perform and Transform
         February 2018

Contributors: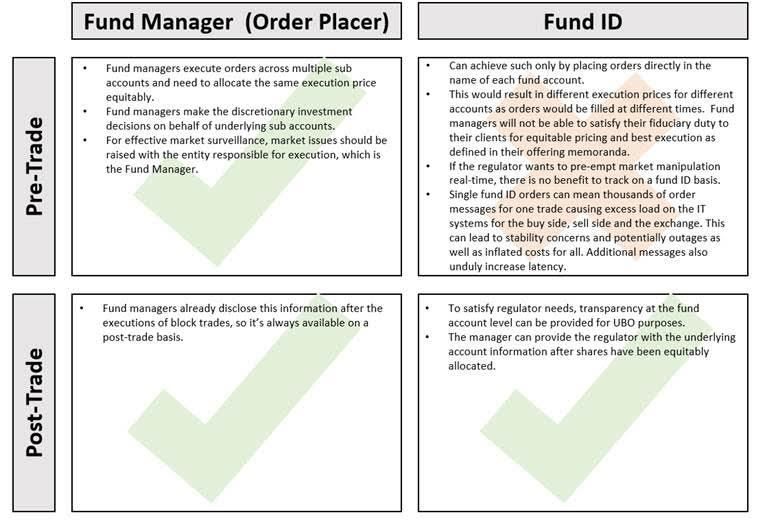
Disclaimer
The information and opinion commentary in this ASIFMA – Accessing India’s Equity Markets Paper (Paper)
was prepared by the Asia Securities Industry and Financial Markets Association (ASIFMA) to reflect the
views of our members. ASIFMA believes that the information in the Paper, which has been obtained from
multiple sources believed to be reliable, is reliable as of the date of publication. The data provided in the
paper is the data available as of the date of publication, unless otherwise specified. As estimates by
individual sources may differ from one another, estimates for similar types of data could vary within the
Paper. In no event, however, does ASIFMA make any representation as to the accuracy or completeness
of such information. ASIFMA has no obligation to update, modify or amend the information in this Paper
or to otherwise notify readers if any information in the Paper becomes outdated or inaccurate. ASIFMA
will make every effort to include updated information as it becomes available and in subsequent Papers.

                                                                                                           2
ASIFMA is an independent, regional trade association with over 100
member firms comprising a diverse range of leading financial institutions from
both the buy and sell side including banks, asset managers, law firms and
market infrastructure service providers. Together, we harness the shared
interests of the financial industry to promote the development of liquid, deep
and broad capital markets in Asia. ASIFMA advocates stable, innovative and
competitive Asian capital markets that are necessary to support the region’s
economic growth. We drive consensus, advocate solutions and effect change
around key issues through the collective strength and clarity of one industry
voice. Our many initiatives include consultations with regulators and
exchanges, development of uniform industry standards, advocacy for
enhanced markets through policy papers, and lowering the cost of doing
business in the region. Through the GFMA alliance with SIFMA in the US and
AFME in Europe, ASIFMA also provides insights on global best practices and
standards to benefit the region.

                                                                                 3
TABLE OF CONTENTS
  A. Executive Summary                                                                       7
  B. Importance of the Capital Markets                                                       9
     1. Importance of capital markets supported by institutional investors                   9
     2. Country growth                                                                       10
     3. Industry/corporate growth                                                            11
     4. Primary market                                                                       12
     5. Funds                                                                                14
     6. Secondary market                                                                     15
  C. Capital Markets in Asia-Pacific                                                         17
     1. Capital market in India, 2012-2016                                                   17
     2. Comparison of capital markets in the APAC region                                     17
  D. Accessing India’s Capita Markets                                                        23
     1. Growth potential of India’s capital markets                                          23
     2. Overall tax and regulatory environment needs improvement                             23
     3. Directly accessing the Indian capital markets onshore – Types of foreign investors   23
     4. Accessing the Indian capital markets from offshore: Access products (swaps,          24
        P-notes, cash, stock futures)
     5. Comparison with access programs in other Asian jurisdictions                         28
  E. Taxation                                                                                31
     1. Background and overview                                                              31
     2. Overview of taxability in India                                                      31
     3. Tax administration and compliance                                                    32
     4. Types of tax                                                                         32
     5. Short-term and long-term capital gains and tax rates                                 33
     6. Tax treaty re-negotiations: India’s DTAA with Mauritius, Singapore and Cyprus        35
     7. Measures to curb tax avoidance                                                       35
     8. International Financial Services Centre and other tax incentives                     36
  F. Recommendations for Development of the Indian Equity Markets                            38
        PRIMARY MARKET
     1. Issue of third party warrants                                                        38
        SECONDARY MARKET
     1. Facilitate securities lending and borrowing                                          38
     2. Algorithmic trading                                                                  39
     3. Block trading                                                                        43
     4. Extension of the trading hours                                                       44
     5. Reported Indian derivatives trading volumes are inflated                             46
        FOREIGN ACCESS
     1. FPI registration                                                                     47
     2. Foreign accounts or foreign currency denominated Indian bank accounts                50
     3. Lack of clarity on depository receipts                                               51
        OPERATIONAL

                                                                                                  4
1. Account structure transparency versus operational efficiency 52
2. KYC/AML challenges 54
3. List of restricted stocks for FPIs 54
REGULATORY
1. Regulatory processes and the need for market consultations 55
2. Consolidation of all disclosures under different regulations 55
TAXATION
1. Differentiated Securities Transaction Tax on FPIs in lieu of capital gains tax on 56
listed securities
2. Multi-lateral instrument and GAAR 57
3. Providing exemption from indirect transfer provisions to Category III FPIs 58
4. International Financial Services Centre units 59
5. Fund management activity in India 59
6. Long-term capital gains tax exemption to be extended to Category III FPIs 60
7. Taxation of GDRs issued against securities 60
ANNEX A: Types of Access Products
ANNEX B: Taxability of capital gains arising to non-resident investors under various DTAA’s signed by India
ANNEX C: Algo trading
5ASIFMA would like to extend its gratitude to Cyril Amarchand Mangaldas, EY, JurisCorp, and PwC, and all
of the individuals and member firms who contributed to the development of this paper. Chapters drafted
entirely by a specific firm are denoted with the firm logo.
6A. Executive Summary
Ever since India started its economic reforms in the early nineties, there has been a metamorphosis in the
Indian capital markets. Whilst India has historically been a challenging destination for foreign investors,
the administration of current Prime Minister Modi has launched a raft of reforms to encourage investment
driven by its commitment to improve India’s ranking in the World Bank’s ‘ease of doing business’ index.
These structural reforms included tax and regulatory changes and the recent efforts to ease direct access
for Foreign Portfolio Investors (FPIs) following restrictions on the Offshore Derivatives Instruments (ODI)
markets.
India’s economic performance continues to attract international investors. Despite a temporary
slowdown to a 3-year low of 5.7% following the introduction of the Goods and Services Tax (GST) and
demonetization in 2016, the International Monetary Fund (IMF) forecasts 7.4% growth for India in 2018.
In fact, India looks set to leapfrog Britain and France next year to become the world’s fifth-largest
economy in dollar terms, according to the Centre for Economics and Business Research consultancy’s 2018
World Economic League Table. It is one of the major G-20 economies with an average growth rate of
around 7% over the last two decades and continues to be an important contributor to the pace of global
growth.
India first lifted restrictions on foreign investors and allowed them to invest directly in listed companies
in late 2011. This was followed by the introduction of FPI regulations that considerably eased the entry
norms for FPIs to access India’s capital markets. Nevertheless, due to the remaining frictions and certain
tax and legal advantages, many foreign investors preferred to gain exposure to India through ODIs. With
the Securities & Exchange Board (SEBI)’s increasingly stringent restrictions on ODIs, it is key for India to
further smoothen the FPI registration and ongoing compliance process, as well as focus on reducing
investment frictions in order to attract foreign investors into its capital markets, both debt and equity.
Equity markets are a vital part of the capital markets, delivering the share capital that every company
needs at the core of its balance sheet. India needs healthy equity markets to provide Indian companies
with long-term capital for growth, leading to higher levels of economic activity, greater wealth and more
jobs. Equity capital is particularly important for funding companies in high-growth sectors such as
technology, communications and energy. Despite some moves in the right direction, more can be done to
ease access for foreign institutional investors in India’s (equity) markets.
In this paper, we will outline the importance of capital markets (both debt and equity) and specifically
capital markets supported by institutional investors due to their size and the stability they add to the
market. We then look into capital markets in the Asia-Pacific region and India’s position compared to
other markets. In the next chapters, we describe how India’s markets are accessed currently and provide
an overview of the tax framework that applies to foreign investors in the Indian equity markets. In the last
chapter, we outline the areas in which Indian equity markets could benefit from structural changes and
make recommendations for the future evolution of the Indian equity markets that are based on our
members’ collective input.
7The first sections of this paper cover both the debt and equities markets for illustration purposes and to
outline the importance of capital markets in general. Our recommendations however only cover the
equities markets. This paper should therefore be read in conjunction with ASIFMA’s July 2017 paper
“India’s Debt Markets: The Way Forward, which is a comprehensive analysis on the current state of and
the outlook for India’s debt markets and provides detailed recommendations on how to enable India’s
continued strong growth.
India needs to further reform its financial market regulations and policies, reduce investment frictions and
improve ease of access to encourage more foreign investors to register as FPIs and directly invest onshore.
Offshore trading continues to grow on the Singapore Exchange (SGX) and Dubai Gold Commodity
Exchange (DGCX), with the SGX having just launched Indian single stock futures in January 2018 as a
complement to its Nifty 50 index futures, which already enjoys a higher market share than its counterpart
onshore in India. We believe that the following measures will attract foreign investors to invest directly in
the Indian equity markets:
▪ Further ease the FPI registration process, including smoothening out the current KYC challenges
▪ Adopt algo friendly regulations in line with global practice
▪ Extend the block trading window and price band
▪ Allow institutional friendly Stock Borrowing and Lending both for better hedging as well as to
attract active investors and alpha generation
▪ Develop an ID market which does not preclude efficient and effective omnibus trading at the fund
manager level
▪ Adopt tax regulations and compliance framework which are fair, transparent and effective, but
not onerous
▪ Implement operational guidelines and clarify any pending tax matters with respect to the issuance
of unsponsored Depositary Receipts
▪ Facilitate increased regulatory transparency and consistency through a more open consultation
process
In the words of Prime Minister Modi at the World Economic Forum, Davos 2018: Our mantra is 'reform,
perform and transform'.
8B. Importance of the Capital Markets
1. Importance of capital markets supported by institutional investors
Capital markets, defined as the part of a financial system concerned with raising capital by dealing in
shares, bonds and other long-term securities and derivatives investments, are of critical importance to
the financial system of a country and to the country’s economic development as a whole. A country’s
capital markets play an important role in mobilising financial resources and their allocation towards
productive projects and channels. Another key element is to act as an alternative source of funding to an
over-reliance on bank lending which can cause systemic risk. Strong and functioning capital markets:
▪ Provide a method to mobilise savings and accelerate capital formation;
▪ Allow for the raising of long-term capital;
▪ Act as an effective economic barometer;
▪ Offer investment opportunities for the public; and
▪ Enable foreign capital to enter the local economy.
The perceived benefits from having functioning capital markets include:
▪ Higher productivity growth;
▪ High real-wage growth;
▪ Greater employment opportunities; and
▪ Greater macro-economic stability.
Investors in capital markets are generally split between retail and institutional investors. Retail investors
are individual investors who buy and sell on their own behalf while institutional investors are professional
entities that rely on pools of money generally from third parties including retail investors to fund their
transactions. Both groups of investors play a key role in financial markets but ensuring that institutional
investors support the capital markets of a country is of fundamental importance, due to their size and the
stability they add to the market. Institutional investors generally include investment funds, insurance
companies, pension funds, treasury operations of banks, foundations and endowments and are a driving
force in financial markets. They are complemented by public institutions such as central banks, sovereign
wealth funds, and treasuries. In OECD countries institutional investors hold assets in excess of 60% of
their country’s gross domestic product (GDP)1 and the prospects for future growth among institutional
investors remain strong.
1 OECD private pensions report, 2013
9Institutional investors are traditionally seen as sources of long-term capital, given the long investment
horizons they tend to have. They are increasing their exposure to alternative assets in a drive to diversify
and generate higher returns on their investments and are increasing their international holdings. These
trends are in conjunction with their traditional investments in equities and fixed income assets.
Increasing institutional investor participation in India’s equity markets would be most beneficial, as a
diversified investor base promotes stable shareholding and healthy liquidity. Institutional investors have
different investment perspectives and time horizons from retail investors. They are less prone to pursuing
market fads or to herding during market stress.
A country with well-developed capital markets will serve as a foundation for its domestic institutional
investors to act as a source of long-term capital and entice foreign investors in with their capital and
practices which can be leveraged to further develop domestic capital markets.
2. Country growth
As stated earlier, a key function of capital markets is to mobilise savings, promote liquidity, provide an
infrastructure to investment and fundraising, and assist in drawing in foreign investments.
Over the period 2011-2016, India’s savings rate fell from 35.5% to 30.2% which is still high by international
standards. During the same period, market liquidity – measured as the turnover ratio – fell from 16.2 to
5.4 for BSE and 53.4 to 34.7 for NSE which can be attributed to increases in the market capitalisation for
the two exchanges rather than decreases in turnover (Figure 1). Foreign investment in India increased
from USD 33 billion to USD 45 billion. The infrastructure for effective capital markets was strengthened
by the removal of the Capital Issues (Control) Act with effect from 1992, freeing-up the pricing of market
issuances in both debt and equity markets, and generally favourable economic conditions including bullish
stock markets, a low-interest rate environment and a positive future economic growth forecast.
Indian Bourse Liquidity Ratios, 2011-2016
60
50
40
30
20
10
0
2011 2012 2013 2014 2015 2016 2017
BSE Turnover Ratio BSE Traded Value Ratio
NSE Traded Value Ratio NSE Turnover Ratio
Figure 1: Indian Bourse Liquidity Ratios, 2011-201
Source: SEBI
10During this period, India saw increased productivity growth averaging 5.3%, whilst real-wage growth rose
from 20.1% to 20.4%, unemployment fell from 3.7% to 3.6%, and the macro-economic environment was
generally regarded as improving as evidenced by commentary from institutional bodies such as the World
Bank.
3. Industry/corporate growth
The strength of capital markets translates into industry and corporate growth as capital flows to economic
sectors that investors believe will have stronger growth prospects. Capital markets channel investment
into more productive areas of the economy which in turn promotes greater economic growth and
employment across an economy. Capital markets can also assist in diversifying investments across an
economy, allowing entities to raise capital through debt, equity, private equity, or other means. Such
diversification can serve to protect firms in general and the economy as a whole from over-reliance on
one form of capital raising, i.e. debt financing through banks.
One particular group of companies which benefits from well-functioning capital markets are Micro, Small,
and Medium Enterprises (“MSMEs”). Due to their size they may have a risk profile too high for commercial
banks to lend to them so the capital markets enable them to undertake capital raising. Given the large
proportion of MSMEs in India - they account for roughly 80% of firms, 8% of GPD, and 69% of employment
- their continued ability to remain in operation is a key driver of economic growth.
Figure 2 below demonstrates the increasing number of issuances by MSMEs and their increasing
fundraising activities using India’s capital markets whereas previously they may have relied more of
networks of friends and family to achieve their funding requirements.
MSME Issues and Fundraising (USD m), 2013 - 2016
300 60
50
200 40
USD mn
30
100 20
10
0 0
2013* 2014* 2015 2016
Amount Total Issues (RHS)
*FY ending in March
Figure 2: MSME Issues and Fundraising, 2013-2016 (USD million)
Source: SEBI
11The contribution of non-MSMEs to India’s GDP is overweighed compared to their MSMEs counterparts;
they account for 20% of firms, 92% of GDP, and 31% of employment.
In addition, there has been a significant rise of retail investors and expansion of retail accounts in India.
The number of individual folio2 accounts in India reached 65 million; up from 55 million accounts in 1Q173.
While it is possible, and likely, that there are individuals with more than one folio account, the
proliferation of such accounts is an indication of the growth in investors being engaged in the mutual
funds industry in India – and through the mutual funds industry, capital markets in general.
Investors are also able to diversify their holdings when strong capital markets exist and can allocate assets
across a range of classes to spread risk. Thus, strong capital markets serve both investors and the
companies looking for financing as they seek to diversify their investments and lending channels
respectively.
4. Primary market
When investors look to engage with capital markets, they generally do so through two channels; the
primary market and the secondary market.
The primary market is where securities, like stocks and bonds, are created and the secondary market is
where they are traded after their initial creation.
The primary market comprises three methods of capital raising:
▪ Public issue – Initial Public Offerings (“IPOs”) and public offerings of bonds which are listed on
exchanges
▪ Rights issues – Essentially an offer to a company’s existing shareholders to buy additional
securities in the company; and
▪ Private placement – The sale of securities to a relatively small number of select investors.
Over the period 2011-2016, India’s primary market performance – relating to public issues, rights issues,
and private placements – grew by 316% to reach USD 41.5 billion, up from USD 10 billion in 2011. Total
issues increased from 91 in 2011 to 426 in 2016. Specifically, IPOs grew from USD 5.2 billion to USD 15.2
billion with 53 IPOs in 2011 and 245 by 2016, bonds issues increased from USD 1.39 billion to USD 21.9
billion with 10 in 2011 growing to 130 by 2016, rights issues increased from USD 1.4 billion to USD 6.1
billion with 23 in 2011 and 78 by 2016, and debt private placements grew from USD 33.3 billion to USD
2 In the mutual funds industry, a folio account is a number identifying an investor’s account with the fund to uniquely identify fund investors and
keep records.
3 Ignites Asia, 21/12/2017
1291.9 billion from 2011-2016. Some instances of equity private placements occurred over this period but
there is no comprehensive data.
Figure 3 below shows the growth in primary market operations with public issues and rights issues.
Primary Market Fundraising by Category (USD bn), 2011 - 2016*
50
40
30
20
10
0
2011 2012 2013 2014 2015 2016
Public Issues Rights Issues
*FY ending March for 2011-2016 figures
Figure 3: Primary Market Fundraising by Category, 2011-2016 (USD billion)
Source: SEBI
Figure 4 on the next page shows that primary market participants are increasingly comfortable in
venturing beyond simple equity issues and that investors are increasingly investing in bond issuances. The
growth in diversity among primary market fundraising issuances is an indication that India’s capital
markets are achieving their objective of promoting diversification of capital structures and investments.
13Primary Market Fundraising by Type (USD bn), 2011 - 2016*
45
40
35
30
25
20
15
10
5
0
2011 2012 2013 2014 2015 2016
Equities Bonds CCPs and others
*FY ending in March for 2011-2016 figures
Figure 4: Primary Market Fundraising by Type, 2011-2016 (USD billion)
Source: SEBI
5. Funds
Over the same period, India’s mutual fund Assets under Management (AUM) grew by 178%, from USD
87.3 billion in 2011, to USD 242.7 billion in 2016. The private sector share of these assets increased from
77% in 2011 to 81% in 2016, potentially indicating that India’s capital markets are achieving one of their
objectives of increasing participation among sections of society that may not have participated previously.
Assets managed by portfolio managers grew by 224% from USD 53.5 billion in 2011 to USD 173.3 billion
in 2016. The vast majority, 74% in 2011 and 78% in 2016, of these assets are held in discretionary
accounts. Client numbers of portfolio managers fell by 8% over the same period, from 79,180 in 2011 to
72,477 in 2016. Discretionary clients remained the vast majority of clients, accounting for 85% in 2011
and 91% in 2016.
Figure 5 demonstrates the changing composition of Mutual Fund AUM in India. It is interesting to note
the increase in AUM allocated towards debt in line with the increase in debt issuance on the primary
markets shown in Figure 4.
The increase in liquid / money market fund (MMF) allocations could be seen as further confidence in the
development of India’s capital markets as mutual funds feel these products are performing their short-
term nature in the Indian economy and helping lubricate the levers of finance which capital markets are
dependent on to function.
14Indian Mutual Fund Asset Composition (USD bn), 2011-2016
300
200
100
0
2011* 2012* 2013* 2014* 2015 2016
Liquid/MMFs Gilts Debt Infrastructure ELSS
Others Balanced Gold ETFs Other ETFs FoFs
*FY ending in March for 2011-2014, 2015 and 2016 figures are as of December.
Figure 5: Indian Mutual Fund Asset Composition, 2011-2016 (USD billion)
Source: SEBI
Mutual funds have benefited from a low interest rate environment from high savings deposits, and
investors in smaller cities and towns have sought higher returns. Efforts by regulators to incentivise asset
and wealth managers to focus on smaller cities and increase investor education regarding mutual funds
have also contributed.
6. Secondary market
India’s secondary market performance (including equities and debt) – where investors trade securities
already issued in the primary market, usually via an exchange such as the National Stock Exchange (NSE)
or Bombay Stock Exchange (BSE) – grew by 30% to reach USD 1.8 billion in 2016, up from USD 1.4 billion
in 2011. Specifically, the market capitalisation of the BSE and NSE grew from USD 916.1 billion and USD
898.6 billion to USD 1.6 trillion and USD 1.5 trillion respectively. The securities turnover for the exchanges
grew over the same period from USD 112.5 million and USD 47.3 billion to USD 493.2 million and USD
125.5 billion respectively. Equity derivatives grew from an aggregate of USD 4.3 trillion across the NSE
and BSE in 2011, to reach USD 9.8 trillion in 2016 while aggregate contracts stayed around the 1 billion
mark over the same period. India’s domestic corporate debt market has also grown, with turnover
increasing from USD 89.2 billion in 2011 to USD 152.8 billion in 2016, and with trades increasing from
44,043 to 348,620 over the same period.
15The growth in the two pillars of India’s capital markets, in addition to other benefits related to a well-
functioning capital markets, bode well for India’s financial development.
16C. Capital Markets in Asia-Pacific
1. Capital market in India, 2012-2016
Size of Indian capital market, 2012-2016 (USD billion)
5000.0
4000.0
3000.0 2928.7
3104.6
2864.9
2000.0 2017.2 2053.0
1000.0 835.1 942.8 1165.4
645.6 745.8
0.0 178.6 206.8 243.0 281.7 335.6
2012.0 2013.0 2014.0 2015.0 2016.0
Corporate Bond Government Bond Equity
Figure 6: Size of Indian capital market relative, 2012-2016 (USD billion)
Source: SEBI, CCIL, NSE, BSE
The Indian capital markets have grown year-on-year since 2013, and saw their largest growth of 31.2% in
2014, driven largely by gains in the equity market. Both the equity market and the debt market –
comprising of both government and corporate bonds – has been growing steadily from 2012 to 2016.
As of 2016, the Indian capital market stood at USD 4.6b trillion, with the equity market comprising 67.4%
of the entire market. Year-on-year, the equity market grew by 6.0%, compared to the bond market’s
22.6%.
2. Comparison of capital markets in the APAC region
a. Size of equity market relative to GDP in selected economies, 2016
Among countries in the Asia-Pacific region, the Japanese Exchange Group had the highest market
capitalisation, of USD 5 trillion in 2016, whilst the total market capitalisation of the NSE and BSE stood at
USD 1.6 trillion and USD 1.5 trillion, respectively.
As a proportion of GDP, India’s total equity market capitalisation was 139%, trailing only Hong Kong,
Singapore, and Taiwan in the region. This is comparable to that in the US of 147% and much higher than
in European countries such as Luxembourg and Germany.
17b. Size of local currency bond market relative to GDP in selected regional economies, 2016
Market Government debt Corporate debt Total debt
(% of GDP) (% of GDP) (% of GDP)
Japan 195% 15% 209%
Korea 52% 74% 126%
Malaysia 51% 43% 95%
Singapore 47% 35% 82%
Thailand 55% 20% 75%
Hong Kong 43% 31% 74%
India 52% 15% 67%
China 46% 20% 66%
Philippines 27% 6% 34%
Vietnam 21% 1% 22%
Indonesia 15% 3% 18%
Table 1: Size of local currency bond market relative to GDP in selected regional economies, 2016
Sources: Asian Bonds Online, SEBI, CCIL, IMF
In 2016, India’s government debt was more than three times the size of the corporate bond sector,
standing at USD 1.2 trillion and USD 335.6 trillion, respectively. In absolute terms, India’s local currency
debt market was the fourth largest in APAC, trailing Japan (USD 9.6 trillion), China (USD 7.1 trillion), and
Korea (USD 1.7 trillion). However, as a proportion of GDP, India’s bond market ranks seventh among the
eleven selected countries in the Asia-Pacific region, and in particular the corporate bond markets are
significantly underdeveloped.
c. Investment flows channelled through exchanges
Country IPOs Already listed Companies Total
China * 7.2 154.1 161.3
Hong Kong 25.2 38.0 63.1
Japan 7.5 15.6 23.1
India ** 4.5 14.2 18.7
Australia 6.3 8.1 14.5
Thailand 0.9 5.1 6.0
Korea 5.4 - 5.4
Indonesia 0.9 3.2 4.1
Taiwan*** 0.8 3.2 4.0
Singapore 1.7 2.0 3.8
Malaysia 0.2 3.0 3.1
Philippines 0.6 - 0.6
Table 2: Investment flows through selected regional stock exchanges, 2016 (USD billion)
Source: WFE
* Only includes Shanghai Stock Exchange
18** Includes both BSE and NSE
*** Includes both Taipei Exchange and Taiwan Stock Exchange
In 2016, the Shanghai Stock Exchange led the Asia-Pacific region with USD 161.3 billion in total investment
flows from IPOs and existing listed companies. Moreover, much of Hong Kong’s flow can be attributed to
China as well. India, on the other hand, netted the fourth highest investment flows among countries, of
USD 18.7 billion in 2016 from NSE (USD 18.3 billion) and BSE (USD 0.4 billion), respectively.
As a whole, funds raised through IPO activities in India shrank 19.5% year-on-year standing at USD 4.5
billion.
New companies listed through IPOs, 2016
250
237
200
150
117 119
100 101
81 83
50 57
16 18 23
4 11
0
Figure 7: New companies listed through IPOs, 2016
Source: WFE
During 2016, India had one of the highest number of IPO listings – 70 new firms were listed on the BSE,
and 49 went public on the NSE. These listings raised the total number of listed companies on India’s
exchanges to 7,761, the largest number of listings in the Asia-Pacific region. Japan and China, on the other
hand, have 3,541 and 3,052 companies listed respectively. However, one challenge with having more
listings but not a larger overall market capitalisation is that India has fewer larger cap firms and therefore,
stocks in Indian by definition would be less liquid and of less interest to institutional investors, particularly
foreign.
d. Performance of key indices
Index 2016 year-end 1 year returns 3 year returns
Hong Kong Exchanges and Clearing S&P/HKEX Large Cap Index 27926 3.4% -0.7%
BSE Limited S&P BSE SENSEX 26626 1.9% 25.8%
Bursa Malaysia FBM Emas Index 11467 -2.8% -10.8%
Taiwan Stock Exchange TAIEX 9254 11.0% 7.5%
National Stock Exchange of India Nifty 50 8186 3.0% 29.9%
19NZX Limited S&P NZX ALL 7449 9.6% 41.5%
The Philippine Stock Exchange PSE Index (PSEi) 6841 -1.6% 16.1%
Colombo Stock Exchange CSE All Share 6228 -9.7% 5.3%
Australian Securities Exchange S&P/ASX All Ordinaries 5719 7.0% 6.8%
Indonesia Stock Exchange JSX Composite Index 5297 15.3% 23.9%
Shanghai Stock Exchange SSE Composite Index 3104 -12.3% 46.7%
Singapore Exchange FTSE Straits Times Index 2881 -0.1% -8.0%
Korea Exchange KOSPI 2026 3.3% 0.8%
Shenzhen Stock Exchange SZSE Composite Index 1969 -14.7% 86.2%
Stock Exchange of Thailand SET Index 1543 19.8% 18.8%
Japan Exchange Group Topix 1519 -1.9% 17.7%
Hochiminh Stock Exchange VN Index 665 14.8% 33.6%
Taipei Exchange TPEx index 125 -3.0% -3.4%
Average returns 2.4% 18.8%
Table 3: Performance of various indices in Asia-Pacific 2016
Sources: WFE, BSE
The S&P BSE Sensex and NSE NIFTY 50 closed 2016 at 26,626 and 8,186points respectively, growing by
1.9% and 3.0% respectively over the year. Between 2013 and 2016, both indices saw a growth of 25.8%
and 29.9%, respectively.
Among regional economies, the Stock Exchange of Thailand Index had the most remarkable year, ending
2016 on a high of 1,543 points, up from 1,288 points in 2015. Meanwhile, the benchmark composite
indices in Shenzhen and Shanghai had one of their worst years, falling by -14.7% and -12.3% respectively.
e. Derivatives market
Exchange Vol. of stock option contracts (USD Notional value (USD
million) billion)
National Stock Exchange of India 88.8 792.7
Australian Securities Exchange 85.2 140.5
Hong Kong Exchanges and Clearing 70.1 163.0
Korea Exchange 11.6 N/A
Japan Exchange Group 0.8 N/A
TAIFEX 0.3 0.6
BSE Limited 0.1 0.8
Exchange Vol. of single stock futures contracts Notional value (USD
(USD million) billion)
National Stock Exchange of India 172.7 1,468.8
Korea Exchange 172.1 106.3
Thailand Futures Exchange 33.8 N/A
TAIFEX 10.0 50.4
20Australian Securities Exchange 4.7 4.3
Hong Kong Exchanges and Clearing 0.2 0.7
BSE Limited 0.004 0.03
Excluding China - Following the crash of 2015, China virtually banned the trading of index futures to prohibit shorting of the
market. Trading amounts were restricted, and fees increased substantially to discourage trading.
Table 4: Volume of equity derivatives in selected regional economies, 2016
Source: WFE
India is one of the most vibrant marketplaces in Asia-Pacific for equity derivatives. In 2016, the NSE led
the region with the highest volume of stock options worth USD 792.7 billion. In addition, the notional
value of single stock futures traded on the NSE was the highest in the region, standing at USD 1.5 trillion,
more than ten times that in the second largest market, South Korea (USD 106.3 billion).
f. Mutual funds
Total Managed Assets (Mutual funds and ETFs), 2016 (USD Bn)
Australia
China
Japan
India
South Korea
Taiwan
Hong Kong *
Thailand
Singapore *
Indonesia
0.0 200.0 400.0 600.0 800.0 1000.0 1200.0 1400.0 1600.0 1800.0
*Hong Kong and Singapore data are for the onshore market only.
Figure 8: Total APAC Managed Assets (Mutual Funds and ETFs) by market
Source: Various local regulatory bodies, Morningstar
With respect to mutual funds and exchange-traded funds (ETFs) which serve as a good proxy for the level
of institutional investor activity, India has a respectable market showing managed assets larger than that
of Hong Kong, Korea, Taiwan and Singapore. Although, if taken within context to relative size of GDP, it
becomes clear that there is potential for significant future growth.
However, from a cash equities trading perspective, Indian markets still trade quite poorly. Cash trading to
GDP is among the lowest compared to other large markets.
21The ratios of equities cash trading volumes to GDP as of the end of September 2017 is shown in table 5
below. India is the least active in trading volume after Brazil which indicates there are still a number of
market reforms that need to be undertaken in the market structure to encourage a more liquid market.
Country Cash Trading Volume to GDP
China 162%
United States 133%
Switzerland 131%
Japan 116%
Korea 110%
Taiwan 110%
United Kingdom 106%
Canada 73%
Australia 58%
Spain 55%
Germany 36%
India 33%
Brazil 24%
Table 5: Cash trading volume to GDP
Source: World Federation of Exchanges and IMF
22D. Accessing India’s Capital Markets
1. Growth potential of India’s capital markets
India’s capital markets have significant growth potential. As mentioned earlier, equity cash trading and
mutual funds / ETFs have significant upside potential.
2016 saw significant progress with the Nifty 50 reaching the 10,000 mark driven largely by strong flows
into emerging markets, government reforms, a good monsoon season, and a positive global outlook.
From a fundamental perspective, India’s economy doubled from 2003-2007, and again from 2007-2015.
Market growth, across both the BSE and NSE, reflected this economic growth and remain poised to
continue to do so off the back of India’s demographics and consumption-based economy.
2. Overall tax and regulatory environment needs improvement
One impediment cited by FPIs which may discourage more active investment in India are the trading
frictions which exist due to cumbersome regulations and tax policies. PWC’s Foreign Portfolio Investor
Survey 2016-17 showcases respondents’ satisfaction with specific issues related to India tax and
regulations, rates on capital gains, outcome of the (Minimum Alternate Tax) MAT controversy, tax audits,
and the regulator’s responsiveness. However, an assessment of the overall environment would be
incomplete without taking stock of the other aspects of tax and regulation, which might not necessarily
be a pocket of strength. For instance, the FPI registration process and KYC requirements, despite the
government’s current initiatives, could benefit from further easing. We will go into further detail on these
recommendations in section F.
When asked about the overall regulatory and tax environment, 77% and 81% of the respondents,
respectively, found them to be challenging relative to other emerging markets. The report recommends
that regulators should look at further easing the FPI registration process by rationalising the criteria for
registration and KYC norms.
3. Directly accessing the Indian capital markets onshore – Types of foreign investors
Currently, foreign institutional investors are able to access Indian capital markets through portfolio
investments as either FPI, as a Foreign Venture Capital Investor (FVCI) or as a Foreign Direct Investor (FDI)
for strategic investments.
FPIs are required to be registered and this is delegated from SEBI to Designated Depositary Participants
(DDPs). FVCIs need to be registered with SEBI, but FDIs do not need to undergo registration.
The product options open to each foreign investor segment are outlined in the table below:
23Market Segment Instrument type FPI FDI FVCI
Equity market Listed equity ✓* ✓* ✓
Unlisted equity No ✓ ✓*
Preference shares ✓ ✓ ✓
Warrants ✓ ✓ ✓
Partly paid shares ✓ ✓ No
Units of mutual funds ✓ No No
Fixed income Dated government securities ✓ No No
State development loans ✓ No No
Treasury bills No No No
Commercial paper No No No
Certificates of deposit No No No
Corporate bonds ✓* ✓* ✓*
Derivative Index futures ✓ No No
contracts
Index options ✓ No No
Stock futures ✓ No No
Stock options ✓ No No
Interest rate futures ✓ No No
Currency derivatives ✓ No No
Others Others ✓* ✓* No
Table 6: Allowed instrument type per investor segment
Source: PWC
FPIs are further segmented into one of three categories as part of a risk based approach KYC process:
▪ Category I (Low Risk): typically government or quasi-governmental entities like central banks,
Sovereign wealth Funds, Multilateral Organizations, etc.
▪ Category II (Moderate Risk): typically regulated entities such as banks, pension funds, insurance
companies, mutual funds, investment trusts, asset management companies, etc.
▪ Category III (High Risk): all other FPIs not eligible under Category I and II such as endowments,
charitable societies, charitable trusts, foundations, corporate bodies, trusts, individuals and family
offices.
4. Accessing the Indian capital markets from offshore: Access products (swaps, P-notes, cash, stock
futures)
a. What are access products?
Access products are instruments that allow an investor to take economic exposure to various global
markets. Some investors, who do not wish to register with the local regulator and be subject to local
24tax and regulatory compliance requirements, approach issuers of access products for taking indirect
exposure to such markets.
There are different types of access products to suit the type of exposure that investors wish to take in
one or more jurisdictions. However, in essence, such access products represent underlying assets that
may be of different classes, or represent a portfolio of assets. Access products and their underlying
asset may not correspond to each other, and the access products may not be fully hedged. The access
products are always cash settled and do not permit delivery of the underlying assets. An investing
entity offers access products to its clients (potential investors) to enable them to take exposures in
various financial markets.
Taking exposure through access products in a country’s capital market and not directly is quite popular
for the following reasons:
▪ Investing through access products allows investors to offset their exposure in various markets in
which they have invested and consequently, allows them to do a ‘net settlement’ of their
outstanding positions. Net settlement is useful because it allows clients to mitigate / manage
foreign exchange and the related settlement / operational risks.
▪ Access products enable investors to deal in a single currency, reduce costs and minimise
intervention of various intermediaries. Incidentally, investors also get services of a single
relationship person and an overall portfolio overview for exposures across markets. They also
allow investors to get familiar with a market before moving onshore with its requisite additional
costs and compliance burden.
▪ There is no requirement to appoint intermediaries such as brokers, clearing houses, bankers and
tax consultants, resulting in substantial saving of the costs.
▪ Reduced tax or regulatory compliances.
In addition to the above, there may be certain restrictions in the exchange control regulations that
may pose challenges in making direct investments.
A detailed overview of the different types of access products can be found in Annex A.
A diagrammatic representation of a simple access product arrangement is provided below:
Investors/ customers
Invest Issue of access products
Investing entity
Optional
25
Global Markets▪ The investing entity is the issuer of the access product. The investing entity may, at its discretion,
decide to hedge by taking a position in the underlying securities.
▪ The investing entity continues to be the legal owner of the underlying assets. The investors /
customers do not have any right or interest in the underlying assets held by the investing entity.
Also, the investee entity would recognise the investing entity as the holder of its securities.
▪ The rights of investors / customers in the access products are not related to, or dependent upon,
the existence or otherwise of any underlying investments in the investing entity. For example, if
the investing entity were to become bankrupt, the investors / customers would have no rights or
legally enforceable interest in the underlying assets.
b. Regulations governing access products (Participatory Notes or P-notes) in India
Certain categories of FPIs registered with SEBI are permitted to issue ODIs (also known as Participatory
Notes or P-notes) in accordance with the SEBI (Foreign Portfolio Investors) Regulations, 2014 (‘FPI
Regulations’). The FPI Regulations provide that ODIs can only be issued: (a) to those persons who are
regulated by an ‘appropriate foreign regulatory authority’, and (b) after compliance with ‘know your
client’ norms. Accordingly, an eligible FPI seeking to issue ODIs to any person must be satisfied that such
person meets these two tests. The FPIs issuing ODIs are required to put in place necessary systems to
ensure compliance with the regulations and the reporting requirements.
Over the last few years, SEBI has consistently attempted to increase the transparency around issuance of
P-notes. Some measures include:
▪ Category III (and certain Category II) FPIs are not allowed to deal in P-notes;
▪ P-notes are allowed to be issued only to those entities which are regulated by an appropriate
foreign regulatory authority;
▪ Issuers of P-notes also have to satisfy the KYC norms before issuing a P-note;
▪ FPIs are required to ensure that P-notes are not issued or transferred to resident or non-resident
Indians;
▪ Resident of non-compliant Foreign Action Task Force countries are barred from holding P-notes;
▪ Opaque structures (where the details of the UBO are not accessible or they were ringfenced with
regard to enforcement) are barred from holding P-notes.
However, the primary concern of the regulator was that all these measures were targeted only at the first
level issuer. There was only one major requirement for subsequent transfer being that the transfer could
be made only to regulated entities. Therefore, SEBI did not have much control and information about
26subsequent transfers of P-notes. It was perceived that it may be easy for players to have layered
structures behind which they could hide the UBOs.
In June 2016, based on the recommendation of the Special Investigation Team set up by the Supreme
Court of India, SEBI issued further guidelines and put in place a mechanism to understand the identity of
the UBO of the ODIs. Below are some of the conditions/ compliance requirements introduced by SEBI:
▪ ODI issuers required to identify and verify the Beneficial Owner (BO) in the subscriber entities who
holds stakes beyond prescribed thresholds, i.e. 25% in case of a company and 15% in case of
partnership firms/trust/unincorporated bodies;
▪ If no material shareholder is identified, the identity and address proof of the relevant natural
person who holds the position of senior managing official of the material shareholder/owner
entity should be obtained;
▪ ODI subscribers will have to seek prior permission of the original issuer for further/onward
issuance/transfer of ODIs unless the person to whom the ODI are transferred to are pre-approved
by the FPI;
▪ Risk review to be done at the time of onboarding and once every three years for low risk clients.
In respect of all other clients, risk review is to be done at the time of onboarding and every year
thereafter;
▪ ODI issuers are required to file suspicious transaction report with Indian Foreign Investigation
Unit, if any, in relation to ODI issued by them;
▪ ODI issuers are required to carry out reconfirmation of ODI position on a semi-annual basis;
In order to further enhance the transparency in the process of issuance and monitoring of ODIs being
issued by the FPIs registered with SEBI, SEBI has in July 2017 undertaken the following measures:
▪ Prohibit ODIs from being issued against derivatives except for those used for hedging: SEBI, vide
circular dated 7 July 2017, prohibited ODI issuing FPIs to issue ODIs with derivative as underlying
(with the exception of those derivative positions that are taken by the ODI issuing FPI for hedging
the equity shares held by it on a one-to-one basis i.e. where the derivatives have the same
underlying as the equity share).
▪ Imposition of regulatory fees on FPIs issuing ODIs: SEBI, vide notification dated 20 July 2017,
amended the FPI Regulations and imposed regulatory fees of USD 1,000 on each ODI issuing FPI
for each and every ODI subscriber coming through such FPI. These fees will be levied for a period
of every three years. This provision is primarily to discourage the ODI subscribers from taking the
ODI route and encourage them to directly take registration as an FPI, since it was observed that
quite a few ODI subscribers invest through multiple issuers.
c. Taxation of access products (P-notes) in India
27P-notes are contractual arrangements between two parties, one of which is an offshore entity registered
as FPI, holding underlying securities. P-notes usually do not confer any interest or title in the underlying
security to the P-note subscriber/ holder. Even though there are no express provisions regarding taxability
on transfer/ redemption of P-notes, in a typical P-note issuance as discussed above, there should not be
any India tax implications.
GAAR provisions have been made effective 1 April 2017. The law provides that GAAR provisions are not
applicable to investments made by non-residents in P-notes issued by FPIs. GAAR provisions empower
Indian tax authorities to consider any transaction as an ‘impermissible avoidance arrangement’ where the
main purpose of the arrangement is to obtain a tax benefit.
d. Impact of regulations on ODI market
The regulator in India has time and again been extremely sensitive to investments made in the country by
way of ODIs/P-Notes in view of their anonymity and, as mentioned above, has frequently amended
regulations for tightening the ODI/P-Notes norms.
Evidently, investments via P-notes as a percentage of FPI flows have been falling over the years. Their
contribution to total FPI flows in India was at an all-time high of 55.7% in June 2007, and fell to 15.1% in
December 2010. As of March 2017, it was a mere 6.6% of the total FPI flows and it fell further to 4% by
November 2017. This fall can be attributed majorly to the tightening of norms on black money by the
Indian government as well as imposing various regulatory requirements on FPIs issuing the ODIs/P-Notes.
5. Comparison with access programs in other Asian jurisdictions
Many economies have adapted temporary conduits, which are ultimately sub-optimal for investment
purposes, on their path to having fully-open capital markets allowing direct investment by institutional
investors. While different countries follow different methods of access, India’s measures to restrict
the use of access products may be overstated and stifle genuine investment. We recommend that the
measures be balanced with the need for ease of doing business in India.
a. Taiwan
Foreign institutional investors have been able to invest in Taiwan’s capital markets since 1983 when
Taiwanese investment trust companies were permitted to solicit overseas capital for investment in
Taiwan’s domestic stock market. In 1991, this was expanded to allow qualified foreign institutional
investors to apply to Taiwan’s Central Bank to invest directly on the Exchange via a Qualified Foreign
Institutional Investor (QFII) account subject to an investment ceiling (later removed). The QFII
application process was then replaced by a streamlined registration process via the Taiwan Stock
Exchange to secure Foreign Institutional Investor (FINI) accounts. Repatriation controls were relaxed,
and securities lending was reformed to become better aligned with international practice. Foreign
institutional investors have become significant players in the Taiwan market which has helped to
bolster the capital markets there.
28b. Korea
Korea’s capital markets are generally regarded as being globalised and open thanks to the process of
opening-up that capital markets went through starting from 1981 when the government announced a
four-phased Capital Market Globalisation Plan which included the introduction of the Korea
International Trust and Korea Trust as investment vehicles for foreign portfolio investors.
Foreign investors have been able to access Korean securities since 1992 and their numbers and
participation in Korea’s capital markets have steadily increased since then. Foreigners are allowed to
acquire all securities available in Korea, though there are ceilings on foreign investment for certain
companies like public utilities and SOEs.
For foreigners to hold domestic securities they need to create an external account for the exclusive
trading of securities and a non-resident KRW account for the same purpose under their own name.
They then need to register as a foreign investor at the Financial Supervisory Service and receive an
investor registration number. They can then nominate a permanent agent to place their orders
through securities companies.
c. China
China offers foreign institutional investors multiple channels through which to invest in its capital
markets. Chinese mainland companies listed in Hong Kong are known as “Red Chips” or H shares,
traded via the Hong Kong Exchanges and Clearing Limited (HKEX) and settled in HKD. In recent years,
more and more Chinese companies have also been directly listing in the US and other markets to tap
into offshore capital markets. On the domestic bourse, there are two share classes: A shares which
are traded on the local exchanges (Shanghai and Shenzhen) and which settle in RMB, and B shares
which are also traded on the local exchanges but which are settled in USD. China launched its Qualified
Institutional Investor programme (QFII) in 2002, which is a license and quota scheme, through which
institutional investors can invest directly onshore and invest in China A shares via the Shanghai or the
Shenzhen Stock Exchange.
As of December 2017, a total of USD 97.159 billion had been allocated in QFII quota. China maintains
a “closed” capital account, which means investors can move money into and out of China only subject to
strict rules. Per earlier mention, Chinese authorities have been gradually opening its capital markets, via
tightly controlled programs like the QFII scheme, to allow some foreign participation in China’s capital
markets. In November 2014 China inaugurated Shanghai-Hong Kong Stock Connect, opening a low friction
portal to China’s largest stock exchange to foreign investors. The launch of Shenzhen-Hong Kong Stock
Connect on 5 December 2016 opened a similar channel to China’s second stock exchange, home to listings
of mostly smaller-cap, faster growing Chinese companies.
The typical route for investors in one country to buy stocks in another country is via a relationship between
the broker in the originating country and a correspondent broker in the target country. Stock Connect, by
contrast, is a direct link between exchanges. The original link, launched in November 2014, enabled
29brokers who are members of HKEX to execute “Northbound” orders for customers through a link to the
Shanghai/Shenzhen Stock Exchange (SSE/SZSE) itself, rather than to brokers who are members of the
SSE/SZSE in China. The HKEX has an omnibus account at the SSE/SZSE (or to be precise, with its clearing
entity Chinaclear) containing all the shares of the HKEX members who participate in the link. The link is
symmetrical, allowing investors in China to trade HKEX stocks “Southbound” via Chinese brokers who are
members of the SSE/SZSE.
The Stock Connect link enables the Chinese authorities to allow money to flow into (and out of) Chinese
shares in a way which they can control because it all flows through this single conduit. Crucially, when an
investor who bought shares via Stock Connect sells them, the RMB proceeds are delivered in Hong Kong.
Investors wishing to buy Chinese shares have to purchase RMB in Hong Kong (technically they purchase
offshore RMB, or CNH), not on the mainland, or have their broker arrange to purchase the RMB for dollars
or other currency for them. Thus Stock Connect forms a “closed loop”, segregating RMB used to buy
Chinese shares from the rest of the Chinese economy.
30E. Taxation
1. Background and overview
India follows a source basis of taxation in respect of income arising to non-residents
(including FPIs). This is unlike a lot of developed as well as emerging economies, that do not impose capital
gains tax on portfolio investments. Due to the applicability of tax, the capital gains tax regime applicable
to FPIs is relatively complex. However, over the years, the Government of India has endeavored to provide
a stable regime for taxation of FPIs. The Indian tax law has a self-contained code which provides a
concessional tax framework for FPIs in India. This was progressively liberalized with the removal of taxes
on long-term capital gains on shares. The domestic tax rates are further subject to beneficial tax rates, if
any, provided in a Double Taxation Avoidance Agreement (DTAA). India has entered into DTAAs with
various countries such as Mauritius and Singapore, which provided for capital gains tax exemption to non-
residents (including FPIs). These jurisdictions have accounted for a significant inflow of foreign
investments into India4. However, in the recent past, in line with the objective to prevent double non-
taxation, the Government of India has amended tax treaties with various countries including Mauritius,
Singapore, Cyprus, etc. making capital gains on shares now taxable. This section presents an overview of
the taxation system applicable to FPIs.
2. Overview of taxability in India
a. Charge of tax
With respect to non-resident taxpayers, India follows a source basis of taxation. Accordingly, foreign
investors, being non-residents as per the Indian tax law, are subject to tax in India on their India sourced5
income or income received in India.
b. Tax framework
A foreign investor being a FPI typically earns the following types of income on account of its investments
in the Indian equity capital markets:
▪ Dividend income: Dividend distributed by an Indian company is exempt from tax in the hands of
the recipient shareholder6.
4 Source: http://dipp.nic.in/sites/default/files/FDI_FactSheet_Updated_September2017.pdf
5 Income is said to be sourced from India if it accrues or arises or is deemed to accrue or arise in India.
6 The Indian company paying the dividend is subject to a dividend distribution tax (DDT) at the rate of 15% (plus applicable
surcharge and education cess). DDT is required to be computed by grossing up the dividend payable. The effective rate of DDT
following the grossing-up mechanism would be 20.358% (the Finance Bill, 2018 proposes to levy Health and Education Cess at
the rate of 4% instead of the education cess of 3%. Accordingly, rate of DDT would be 20.5553%, effective 1 April 2018).
31▪ Income distribution from equity oriented mutual funds7: Distribution of income by an equity
oriented mutual fund to its unitholders is exempt from tax in the hands of the unitholders. The
Finance Bill, 2018 proposes to levy tax on income distribution at the rate of 10%, effective 1 April
2018.
▪ Capital gains earned from the transfer of equity shares, equity oriented mutual funds and
exchange traded derivatives (collectively referred to as ‘securities’) are subject to tax. Any
investment in securities made by FPIs in accordance with SEBI FPI Regulations shall be regarded
as a capital asset. Accordingly, income earned by FPIs from transfer of such Indian securities would
be taxable as “capital gains”.
3. Tax administration and compliance
a. Obtain a PAN
To commence investment activities in India, an FPI is required to obtain an alphanumeric tax identification
number i.e. PAN from the Indian tax authorities. The application for PAN has to be filed along with
documentary evidence for identity and address of the applicant.
b. Withholding tax and self-discharge of taxes
No deduction of tax is required from income by way of capital gains arising to FPIs from transfer of
securities. The FPI will need to self-discharge taxes on its income, prior to remittance or on quarterly
advance tax due dates, whichever is earlier. Delay/ deferment in deposit of advance tax has interest
implications.
4. Types of tax
a. Capital gains tax
Taxability of capital gains earned by a FPI on transfer of securities broadly depends on:
▪ The legal status of a FPI;
▪ Whether Securities Transaction Tax (STT) has been paid on purchase and/ or sale;
▪ The period for which the securities were held prior to their transfer (depending on the period
held, the gains can be classified as short-term capital gains or long-term capital gains)
b. Minimum Alternate Tax (MAT)
Companies (including foreign companies) liable to tax in India are required to pay tax at the higher of
the normal domestic tax law provisions and 18.5% of book profit8. However, as per a recent amendment,
a foreign company is not liable to pay the tax under the MAT provisions in a scenario where:
7Afund is treated as an equity oriented mutual fund if more than 65% of its investible funds are invested in equity shares of
domestic companies.
8Book Profit is essentially the profit as shown in the profit and loss account of the company and further adjusted by certain
additions and deletions as prescribed under the provisions of the Indian tax law.
32You can also read