Accountability: What Really Counts for Teachers - Duval ...
←
→
Page content transcription
If your browser does not render page correctly, please read the page content below

Accountability: What Really Counts for Teachers

What is the purpose of this course?
       What this course is:                       What this course is not:

• A tool to understand the student growth   • A place to discuss the quality or content
  portion of evaluations.                     of the district assessments.

• A tool to understand which students       • A place to discuss situations that are
  count in evaluations and where this         specific to only individual teachers or
  information can be found.                   students.

• A tool to better understand how growth    • A place to let out your aggression or
  scores are calculated and the process       dissatisfaction with how scores are
  for reporting possible discrepancies.       figured on your kind instructors.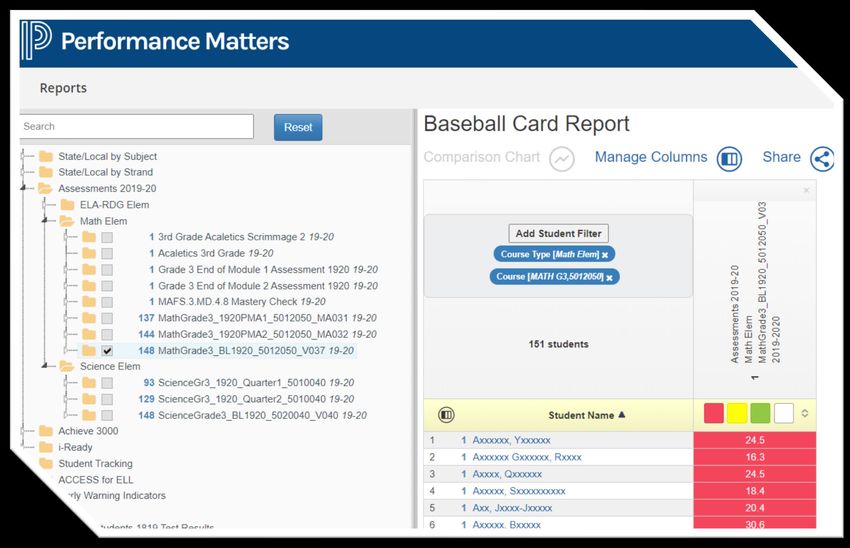
CAST Measures

• Published annually and approved by
  DTU.

• Each course listed in FOCUS is tied to
  CAST Measures and can be found
  under a general course subject.

• Lists the type of assessment that will
  be used for evaluation.

Where can I
    find CAST
   Measures?                           • The CAST measures document can
                                         be located within the DAT's
                                         Professional Development
                                         SharePoint.
https://duvalschoolsorg.sharepoint.c
om/sites/DataandAssessment/SitePa      • The SharePoint also houses other
ges/CAST-&-VAM-Information(1).aspx       important information and links.
CAST Model (18-19 and Prior)
                              CAST
                     Collaborative Assessment
                       System for Teachers

             VAM                                      DCS
         Value Added Model                    District Calculated Score

                                Growth                           Performance
                             Pre-Test to Post-Test                  Post-Test Only
CAST Model (20-21 and Beyond)

                                  CAST
                         Collaborative Assessment
                           System for Teachers

                                   DCS
                         District Calculated Score

          VAM                  DC Growth               DC Performance
     Value Added Model         Pre-Test to Post-Test      Post-Test Only
What is the difference between
VAM, District Growth and Performance?
                    VAM                       Growth and Performance
 • Florida's Value-Added Models (VAM)        • District Growth and Performance is the
   are the measurement of                      measurement for student growth and
   the teacher's contribution to student       improvement for teachers with courses that
   learning for courses that end in a          end in a district EOC or post-test or a
   state assessment.                           combination of state and district assessments
                                               or post-test.
 • 3-year aggregate (17/18, 18/19, 20/21).
                                             • Annual calculation that is included in a 3-
 • Calculations made by the state only for     year average (17/18, 18/19, 20/21).
   students' individual expected score.
                                             • Calculations made by the district for
 • For years 18-19 and prior, overall          expected score.
   performance level for VAM only teachers
   was calculated by the state.
What is VAM?

What is VAM?

      What teachers receive a VAM                       Who counts for me?
                score?
      Typical Year: Teachers who teach
                                                Students who were present for survey 2 OR
   Grades 4-10 ELA, Grades 4-8 Math, and/or
                                                survey 3 FTE window AND have a qualifying
                  Algebra 1
                                                    score. These students are listed in My
   For 2020-2021 Year: 6-10 ELA and 6-8 Math,                  Accountability.
          and/or Algebra 1 (8th and 9th)
How is a VAM score calculated?
What is a Value-Added Model?
•   The value-added models measure the
    difference in each student’s actual
    performance on a statewide assessment
    from that student’s expected
    performance.
•   This model considers specific student and
    classroom factors that impact the learning
    process.

What does a VAM score mean?
• VAM scores represent the amount the
  teacher contributed to student learning
  growth, on average, to the students they
  taught while adjusting for factors that
  impact student learning growth.
VAM Visualization Portal
State scores
The portal shows
will only transfer
Navigating to the VAM multi-year measures
once you have
& overall
Visualization Portal evaluation level.
received scores
from Duval county.
1. Go to portal.fldoesso.org.
2. Select Educators. Teachers can
The portal will show
the students who
see student level
met or exceeded
data.
3. Choose VAM. expected growth.VAM Portal Reports
District, School and
Teacher Reports
AvailableVAM Rating/Performance Level
VAM Score

    Teacher
  Value-Added
Individual Student VAM Scores
Teacher's Student
Roster
Student
Names
The individual student scores are only available to teachers.How is the expected score
determined for District Growth
and Performance?Components of District Growth and
Performance
Which teachers use District Growth Who counts for me for District
and/or Performance? Growth and/or Performance?
Teachers who teach a course that Students who were present for the Survey 2
OR Survey 3 FTE window AND have a
uses a pre-test or baseline and/or a
finalized grade by anyone in the
post-test or district EOC. district. These students are listed in My
Accountability.How is the District Calculated
Growth determined?
• First, the pre-test score is subtracted from the post-test score for each student.
• Taking into account ½ of a standard deviation, the district average of the differences becomes
the expected score for each test.
• Each student's difference is then compared to the expected score.
• Any student that met or exceeded the expected score will count as "Yes" for the teacher's
growth.
• Expected growth scores are different every year depending on the population's performance.
• Some subsets of students (ESE, ELL and Overage) are given a different weight in
order to create a more equitable balance in the scores.
• This method is used for all classes on CAST Measures that have a pre assessment and post
assessment that is not figured by the state.How is the District Calculated Performance determined? • Performance does not mean proficiency. • Taking into account ½ of a standard deviation, the district average becomes the expected score for each test. • Each student's score is then compared to the expected score. • Any student that met or exceeded the expected score will count as "Yes" for the teacher's growth. • Expected performance scores are different every year depending on the population's performance. • Some subsets of students (ESE, ELL and Overage) are given a different weight in order to create a more equitable balance in the scores. • This method is used for all previous and current FSAA, IB, AP and AICE courses. It was also used for most elementary courses in the 20-21 school year.
How do teachers see who counted for them?
How do teachers see who met or exceeded the expected score?

                          My Accountability
     • Everyone logs into this portal to verify their enrollment during Survey
       2 or Survey 3.

     • VAM, District Growth and District Performance results will be displayed in this
       portal and each student's growth is indicated with a "Yes" or a "No".
How do teachers see who counted for them and met or exceeded expected growth? • Log into My Accountability by typing myaccountability/ into the address of your web browser. You must be on the network. • Under "CAST Class List", choose the desired silo from the dropdown. • The last column will indicate if the student did or did not meet the needed growth.
How are teachers’ 3-year averages calculated?

                            • All the numerators (students who met or
                              exceeded growth) for the three years
                              are added together.

                            • All the denominators (students in
                              survey 2 and 3) for the three years
                              are added together.
                               • For the 20-21 school year, students that do
                                 not have an FSA, EOC or DEOC score will be
                                 removed from the denominator.

                            • The numerator is then divided by the
                              denominator to obtain your 3-year
                              district calculated average.
How do teachers find students' pre-test and post-test
scores for District Growth and Performance?
• Once you know who counts for
you, you can find the students'
scores in Performance Matters.
• First, log into PM and choose
"Baseball Card Report".
• Then, click "Add Student Filter" and
"Geographical".
• Under this tab, you can select the
course type and course for the
assessment you are wishing to
view.
• Finally, check next to the
assessment title, and look for any
students missing a score.Feedback/Questions/Issues?
• What is the process for changing something in CAST Measures?
• The following Qualtrics link allows for suggestions to be made for CAST Measures.
• https://dcps.qualtrics.com/jfe/form/SV_8dbZDJMGnxOkZIV
• What is the process for making changes to Baseline/DEOC tests?
• Contact the Academic Services team that is responsible for writing the test through email with
suggestions. You can ask DAT if you need the contact information. You may also cc DAT@duvalschools.org if
you prefer.
• Who do I contact if I have questions or see errors in what I am seeing in specific platforms?
• FLDOE SSO (VAM Portal):
• https://floridavam.org/contact.html?as=d&aj=c
• This link gives technical and single sign on help for the portal.
• Top Portion of My Accountability:
• 1st Step: Contact CRT or APC to ensure you are properly scheduled in FOCUS. Check back with them
to make sure updates were corrected in FOCUS and the survey site.
• 2nd Step: If FOCUS is correct after step one and info is still showing incorrectly in MA, APC will reach out
to DAT@duvalschools.org
• Performance Matters: Contact DAT at DAT@duvalschools.org or 390-2678How do I sign up for teachers to receive this
training at my school?
• Fill out the Qualtrics survey to have
this training be a part of your pre-
planning agenda or a designated
time during the year.
• Share the DAT Professional
Development flyer to allow for
teachers to sign up for individual
training during the year.
• Share the DAT PD SharePoint with
teachers to view pre-recorded
trainings whenever convenient for
them.How do I sign up for users to have school-wide
access to my building?
• School-wide Performance Matters
access will be deleted when we
roll to the 2021-2022 school year in
FOCUS.
• Fill out the Qualtrics survey to allow
various users to have school-wide
access.2021-2022 Updates to Performance Matters • Updated Proctoring Capabilities and Roles- Start of 21-22 • Password Protected Online Assessments- Start of 21-22 • Next Generation Baseball Card- October-November 2021 • Student Accommodations Updates- Start of 21-22 • Subgroup comparison- Currently Available • Customizable Dashboards- Winter 2021
Updated Proctor Roles and Password
Protected Online Assessment
• Proctors may
  release and pause
  tests

• Option to generate
  randomized
  password

• Option to have
  class specific
  password

                                     28
Next Generation of Baseball Card
New Features
• Improved user interface
• Add any student attributes as a column
• Redesigned measure selection
• Column averages/sum
• Compute averages/sum/difference
across columns
• "OR" based multi-column filtering
• Manage saved reports
• See Performance Band thresholds
• Accessible from other Classroom
products
29Accommodations Update
Accommodation Updates Improved Text to Speech
• Student accommodation profile • Includes follow-along visual indicator
• Ability to use online testing tools • Ability to control speech speed
simultaneously • Ability to magnify the words being read
• New text to speech tool • No character/word limit
• Handles randomized answer choices
• Natural Language Math ML Support
30Subgroup Comparisons
Comparative Results will
feature assessment
data by standard for
student subgroups.
31Customizable Dashboards
32Thank you for joining us!
Please reach out to DAT at
DAT@duvalschools.org or 390-2678 with
any questions or concerns.You can also read