Acellerate - Operational Case Study Examination May / August 2021 Pre-seen material - Astranti
←
→
Page content transcription
If your browser does not render page correctly, please read the page content below

Operational Case Study Exam – May/Aug 2021

                Operational Case Study Examination
                                  May / August 2021
                                   Pre-seen material
COVID-19 Statement
This pre-seen and the case study in general (while aiming to reflect real life), are set in a context
where the COVID-19 pandemic has not had an impact.

Remember, marks in the exam will be awarded for valid arguments that are relevant to the question
asked. Answers that make relevant references to the pandemic or social distancing will, of course, be
marked on their merits. In most cases, however, candidates may find it helpful to assume that there
are no restrictions to the movement of people, goods or services in place.

                                  Acellerate
 Contents:                                                                                   Page
 Job and role outline                                                                              2
 Company information                                                                          3–13
 Industry analysis                                                                           14–15
 Extract from the company website: Acellerate                                                    16
 Financial statements                                                                        18–21
 Budget and costing information                                                              22–27
 Tax regime in Everland                                                                          28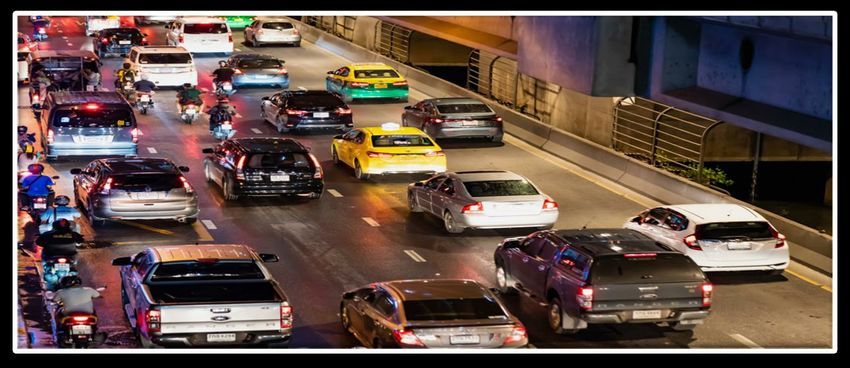
Internet article: To own or not to own                                             29
 Internet article: Keeping connected                                                30

Job and role outline
You are a Finance Officer for Acellerate, a car rental company. Your main role is to support
Ethan Tennant, the Finance Manager. Your tasks include preparation of the annual budget,
producing the monthly management accounts and providing information to management as
required. You also assist with the preparation of the financial statements and deal with any
queries regarding financial reporting.

© CIMA 2021 No reproduction without prior consent
                                                                                          2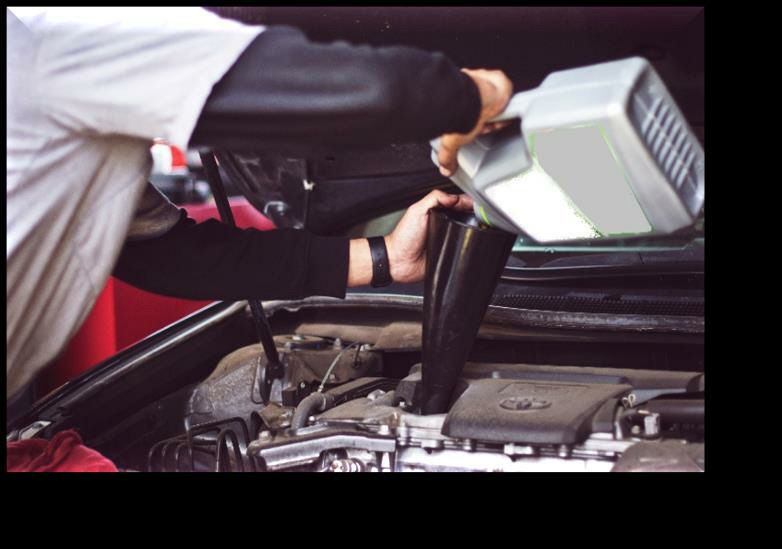
Company information
Company background
The company, Acellerate, is a leading car rental company based in Everland, in Western
Europe. Everland has a population of around 72 million and has the E$ as its home currency.
In the financial year to 31 December 2020 the company reported sales revenue of E$206.3
million, a decrease of 25% from the previous year. It incurred a loss before tax of E$0.8 million
compared to a profit before tax for 2019 of E$11 million. The reduction in revenue and the pre-
tax loss arose as a result of a global economic recession which impacted the business
throughout most of 2020.

The company was formed in 2002 by Joseph Waller, the current Managing Director. The
company’s development was initially slow as it faced severe competition from global car rental
brands, however between 2010 and 2019 it grew rapidly, exploiting its home-grown credentials
and commitment to quality customer service.

The company, operating under the Acellerate brand, provides a high-quality car rental service.
Rental fees are generally above those of value-branded car rental companies. It mainly
services the business and premium leisure segments of the travel industry.

The company operates a number of sales locations throughout Everland. The sales locations
are situated at, or close to, airports and in some off-airport sites. Each sales location is
supported by a car maintenance centre which is located close to the sales location. A single
maintenance centre may support more than one sales location. Some of the sales locations
and maintenance centre properties are owned by the company whilst others are leased.

In response to the reduced demand, and in an effort to lower costs, the number of sales
locations was cut in 2020 from 155 to 117. The main closures were in off-airport sites.
Acellerate however continues to operate car rental sales locations at most of the airports and
largest cities in Everland. Maintenance centres were also closed in 2020 where the sales
locations that they supported were closed or where it was decided that the maintenance work
could be carried out at another centre.

The company’s rental fleet consists of a mixture of company-owned cars and cars subject to
repurchase agreements (see the extract from the notes to the financial statements on page
20). Under a repurchase agreement, the manufacturers agree to repurchase the car at a
specified price subject to car condition, mileage and holding period requirements. Typically,
the holding period for a car is 12 months.

The fleet was reduced during 2020 by a mixture of disposals and non-replacement when the
car repurchase agreement expired. It currently has a fleet of 15,000 cars down 4,995 from the
previous year. In normal trading conditions, the size of the fleet will vary throughout the year
depending on the season. The demand for car rental is at its highest during the summer
months.

The actions taken by the company in 2020, such as reducing the fleet size and closing some
sales locations and maintenance centres, have proved to be effective in enabling the company
to survive the worst effect of the recession. In addition, the failure of some companies
operating in the market has provided opportunities for Acellerate. Financial performance for
the first quarter of 2021 was in line with budget and the Senior Management Team believes
that the company is now in a solid position for future development.

© CIMA 2021 No reproduction without prior consent
                                                                                               3
Company services

The company provides car rental services throughout Everland. Customers normally rent a
car for 1 day or for a period of up to 1 month. The average daily fee for the car rental varies
depending on the length of the rental period and the size and type of car hired.

The company’s rental fleet includes a wide variety of types of cars in different sizes from a
range of manufacturers. The fleet includes cars with manual and automatic transmission. The
fleet cars are mainly diesel and petrol powered but there are also a small number of electric
cars. Additionally, it includes a number of “Prestige” cars which are expected to appeal to the
business market or to leisure customers who are looking for a bit of indulgence on their
vacation. The average monthly car rental fleet size typically peaks in the summer months.

The car rental fee includes basic insurance. The car will have a full tank of fuel on collection
and customers are expected to return the car with a full tank. In the event that the car is
returned without a full tank, the customer will be charged for the shortfall.

Customers can book the car rental online direct via the company’s website or app.
Alternatively, the customer can book at the sales location on arrival. Such customers run the
risk, especially at busy times, that the sales location will have no cars available of the size and
type required.

In addition, car rental can be booked via third parties, including hotels, airlines and other third-
party brokers. Acellerate pays a commission on all rentals booked through third parties.

Additional rental services

Long-term car rental: The company offers long-term car hire of periods between 1 month and
3 months. The rental is charged at a fixed fee per month and includes an enhanced level of
insurance cover and free additional drivers. There is a restriction on total mileage with an
additional fee payable for extra mileage.

Deliver and collect: On payment of an additional fee, the rental car will be delivered at the start
of the rental period and collected at the end of the rental period from the customer’s home or
place of work.

One-way rental: This service allows customers to collect the car from one sales location and
return it to another location on payment of an additional fee.

Ancillary products and services

In addition to revenue generated from the car rentals and the additional services detailed
above, the company generates revenue from customers through the sales and/or rental of
optional ancillary products and services including:

·   Collision and loss damage waivers, under which Acellerate agrees to relieve a customer
    from financial responsibility arising from car damage incurred during the rental.
·   Additional / supplementary liability insurance or personal accident / effects insurance
    products which provide customers with additional protection for personal or third-party
    losses incurred.
·   Products for driving convenience such as roadside assistance services, portable
    navigation units and child safety seats.

© CIMA 2021 No reproduction without prior consent
                                                                                                  4
Company strategy
The company aims to grow the business through both the development of new markets and
expansion of its range of services.

The main objective is to continue to improve margins by utilising digital technologies to:
· improve asset utilisation;
· improve methods for car disposal using online, direct to consumer and direct to dealer
   channels;
· achieve fleet cost efficiencies through fleet planning initiatives;
· control costs and increase efficiencies through process improvements.

The people
The company currently employs 885 staff. Most of the staff are employed at the sales locations
and maintenance centres (751) and the remainder at Head Office (134).

The directors
The company directors are as follows:

Managing Director: Joseph Waller
Finance Director: Megan Dubois
IT Director: Gavin Hoffman
Marketing Director: Jessica Strauss
Retail Operations Director: Jack Durand
Human Resources Director: Ben Spiegel

The directors have a wide range of previous experience, mainly in the car rental industry. They
are relatively young and highly enthusiastic.

© CIMA 2021 No reproduction without prior consent
                                                                                             5
Directors’ profiles

                    Managing Director: Joseph Waller
                    Joseph is responsible for the company's strategy. He worked for a
                    competitor company before founding Acellerate in 2002. Joseph is
                    keen to continue to expand the business through the exploitation of
                    digital technologies. He wants to ensure that an appropriate
                    infrastructure is in place to support future expansion.

                    Finance Director: Megan Dubois
                    Megan is a CIMA qualified accountant. Megan was appointed as
                    Finance Director last year and has quickly earned a reputation for
                    keeping a tight rein on the company's finances. She is interested in
                    exploring the use of digital technology to make the finance processes
                    more efficient.

                    IT Director: Gavin Hoffman
                    Gavin graduated with a masters degree in Computer Science from
                    Everland University. He has been pivotal in the development of the
                    company's fleet management system which is seen as ground-
                    breaking in its use of digital technology.

                    Marketing Director: Jessica Strauss
                    Jessica joined the company in 2010 after previously working as a
                    marketing executive for a retailing company. She is keen to exploit
                    social media marketing both to gain market intelligence and to promote
                    the brand.

                    Retail Operations Director: Jack Durand
                    Jack graduated from Everland University with a masters degree in
                    Sales Management. Jack works closely with Jessica and is keen to
                    further expand the company's services. He is constantly looking at
                    potential new opportunities to meet customer needs.

                    Human Resources Director: Ben Spiegel
                    Ben has a wealth of experience in Human Resources Management.
                    He believes that the company's employees are its most important
                    asset and that employee development is the key to the company's
                    success.

© CIMA 2021 No reproduction without prior consent
                                                                                         6
Extract from Acellerate’s organisation chart

                                     Megan Dubois                 Ethan Tennant
                                    Finance Director             Finance Manager

                                                                   James Conran
                                                             Fleet Management System
                                                                     Manager
                                     Gavin Hoffman
                                      IT Director
                                                                     Anita Roper
                                                             IT Infrastructure Manager
     Joseph Waller                  Jessica Strauss
    Managing Director              Marketing Director
                                                                  Paul Wahlberg
                                                                Fleet Management
                                                                     Manager

                                                                   Tony Berger
                                       Jack Durand
                                                                Fleet Procurement
                                Retail Operations Director
                                                                     Manager

                                     Ben Spiegel
                                                                 George Oswald
                                   Human Resources
                                                              Maintenance Manager
                                       Director

© CIMA 2021 No reproduction without prior consent
                                                                                     7
The Finance Department

                        Finance Director
                         Megan Dubois

                        Finance Manager
                          Ethan Tennant

                                      Finance Team

                                 3 Senior Finance Officers
                           5 Finance Officers (of which YOU are
                                           one)
                                   3 Finance Assistants

© CIMA 2021 No reproduction without prior consent
                                                                  8
Company operations
Sales
The company operates a number of sales locations throughout Everland. The sales locations
are either on-airport – situated at or close to airports, or off-airport – situated in areas such as
train stations or city centres. Some of the properties are owned by the company but many of
them are leased.

Revenue by customer for 2020 was split 49% business and 51% leisure whilst revenue by
market was split 68% on-airport and 32% off-airport.

Sales revenue is subject to seasonal variations in customer demand patterns, with the spring
and summer vacation periods representing the company’s peak seasons. The fleet size is
adjusted over the course of the year to help manage these seasonal variations. Any localised
changes in demand are managed through moving cars to different locations where necessary.

                           SALES REVENUE BY QUARTER

                                        Oct - Dec Jan - Mar
                                          25%       21%

                                                     Apr - Jun
                                        Jul - Sept     26%
                                          28%

The average daily car rental fee varies depending on the length of the rental period and the
size and type of car hired. The rental fee per day reduces as the length of the rental period
increases. However, there is a cost advantage to longer rental periods since many of the costs
are incurred at the end of each rental period, e.g. maintenance and cleaning costs. The
company’s rental income management system (see below) is fundamental to ensuring that
prices are competitive. The average rental period is 6.3 days. This varies by customer type
with the average period for leisure customers being longer than that for business customers.

Rental fees are normally paid in advance however the company also provides credit facilities
to a number of businesses which regularly rent cars for staff and visitors.

The employees at the sales locations are empowered to resolve most customer issues and
receive appropriate training to enable this to happen. Customer satisfaction levels are tracked
by sending location-specific surveys to recent customers. These are used to assess services
and identify ways to improve the customer service delivery and the overall customer
experience.

© CIMA 2021 No reproduction without prior consent
                                                                                                  9
Maintenance
The quality of the maintenance process is considered to be of vital importance as it is
fundamental to customer safety and customer satisfaction. Quick and proper repairs are also
critical to ensure fleet utilisation rates are kept as high as possible. To ensure this, the
maintenance centres hold inventory of consumables and spare parts.

There are four main occasions when the car is checked by the mechanics in the maintenance
centres:

   ·   Checks are carried out when the new car is first delivered by the dealer, this is known
       as an initial car inspection. Although the dealer will have checked the car prior to
       delivery, checks are also done by the company’s mechanics. The exterior of the car is
       checked for any scratches and the interior is checked for any tears or other damage.
       Checks are carried out on fuel, oil, fluids, mirrors, sound system, air conditioner,
       windscreen wipers, heater, horn, doors and windows.

   ·   Checks are also carried out when the car is returned by the customer after a rental.
       The customer is asked when returning the car to report any damage or problems. If a
       car comes back from a rental with a defect noted, the car is given a quality control
       inspection before the defect is repaired. In this way, mechanics hope to catch other
       items in need of repair. In addition to all items previously checked in the initial car
       inspection check, the quality control inspection includes steering and all mechanical
       items and checks to the tyres, including the spare tyre.

       Photo by Tim Mossholder on Unsplash

   ·   Regular servicing is carried out in line with the manufacturers' recommendations under
       the warranty requirements. The company’s maintenance centres have also been
       approved by the main car manufacturers to carry out rectification work under warranty.

   ·   Accident repairs are carried out by third-party suppliers. When the suppliers complete
       the body repairs, each car is inspected by an Acellerate mechanic before payment is
       made.

© CIMA 2021 No reproduction without prior consent
                                                                                           10
Fleet management system and fleet purchases and disposals
Fleet management system
The company uses a range of technologies in its car rental operation, all of which are linked
to its fleet management system. The fleet management system is a national reservation,
rental, fleet control, data processing and information management system. The fleet
management system allows thousands of customer enquiries to be processed each day. It
provides customers with accurate and timely information about the company’s locations, rental
rates and car availability, as well as enabling the customer to place or modify reservations.
The company also uses data supplied from the fleet management system and other
information management systems to maintain centralised control of major business processes
such as pricing, fleet acquisition and logistics.
The fleet management system incorporates two main components:
· The fleet planning model is a comprehensive decision tool which enables the company to
develop plans for the acquisition and disposal of its fleet. The fleet planning model provides
details on fleet age, mix, mileage and cost reports. This allows management to monitor
and change fleet deployment and to optimise its fleet plan based on estimated business
levels and available repurchase programmes.
· The rental income management system is designed to enhance profitability by providing
greater control of car availability, car movements and pricing. The system monitors and
forecasts both car supply and customer demand to support the company’s strategy to
optimise utilisation rates at each location. The company also utilises systems to gather
and report competitive industry rental rates every day using data from third-party
reservation systems, which automatically scan rate movements and report significant
changes.
Fleet purchases and disposals
In 2020, approximately 45% of the company’s rental car fleet was comprised of cars subject
to agreements requiring car manufacturers to repurchase cars at a specified price. Cars
subject to these agreements are referred to as “programme” cars. The remaining 55% of the
fleet are cars not subject to these agreements and referred to as “risk” cars because the
company retains the risk associated with the residual value of these cars at the time of their
disposal. The fleet purchases are financed using different types of borrowing from major
financial institutions. At present, none of the fleet is leased.
The agreement with car manufacturers typically requires the company to pay more for
programme cars and retain them in its fleet for a minimum number of months. It imposes
certain return conditions, including car condition and mileage restrictions. When the
programme cars are returned to the manufacturer, the company receives the price guaranteed
at the time of purchase and is therefore protected from fluctuations in the prices of previously
owned cars in the wholesale market.
The company disposes of its risk cars largely through car auctions and direct-to-dealer sales.
In 2020, it continued to expand the scope of its direct-to-consumer car sales programme to
include the sale of risk cars directly to consumers through company-owned second-hand car
retail sites in several Everland cities. Direct-to-consumer sales and alternative disposal
channels such as online auctions provide the opportunity to maximise car sale prices.
© CIMA 2021 No reproduction without prior consent
11Marketing
Marketing is the responsibility of the company’s Marketing Department which employs a range
of marketing methods including more traditional marketing media, such as TV and magazines,
and social media marketing. The marketing department’s main activities are: market research;
promoting and advertising the Acellerate brand; raising brand awareness and helping to
determine pricing strategies.
The company’s website and app are considered important marketing tools and represent its
main sales channels. The website and app have been continually developed to ensure visitors
are engaging with the content. Both can be accessed in all major European languages.
Website and app pages are informative, clear and easily navigated.
The website and app employ data analytics to enable the company to source sales data but
also other metrics such as: number of visits; average time on page and “bounce rate” which
measures the percentage of visitors accessing the website and leaving without visiting another
page. The data analytics also captures data about the customer, such as the customer’s home
address, age and the reason for the car rental. This data analytics is considered an important
source of information to help determine customer preferences and the sales potential of the
company’s products.
In addition to the data collected from the website and app, an email is sent to customers at
the end of each rental period requesting them to complete a survey about their rental
experience.
IT
The company makes extensive use of digital technology both to manage its fleet of rental cars
and to improve the service offered to its customers.
The recently launched Acellerate mobile app allows customers to reserve, update and cancel
reservations, choose their car, exchange or upgrade their car, add ancillary products, extend
rentals, return the car with one click and confirm their fuel level at the beginning and end of
their rental, using their mobile device.
The company’s recently installed rental income management system includes pricing analytics
tools to enable it to increase the profits earned per rental day. It plans to continue deploying
new technology systems to support management decisions and to enable it to tailor products,
services and price offerings to meet customers’ needs and react quickly to shifting market
conditions.
Finance
The financial information system produces monthly management accounts and annual
financial statements. This information system also generates daily and weekly sales revenue
and fleet operating cost information.
Budgets are produced on an annual basis. Daily rental fees and operating costs are reviewed
as part of the budgeting process and other information to formulate the budgets is obtained
from the fleet management system. Individual functional managers have responsibility for
setting and achieving budgets. Monthly reporting on actual performance compared to budget
is to both the functional managers and the Senior Management Team.
© CIMA 2021 No reproduction without prior consent
12Human resources
The company believes that its employees are fundamental to its success. It is committed to
maintaining a professional and supportive workplace. It seeks to support the well-being and
growth of its employees by offering development opportunities and training.
The company operates an apprenticeship programme for its maintenance technicians and
provides specialised training for staff at different stages of their development. A customer
service training programme is also available for customer-facing staff to continually improve
the overall customer experience.
© CIMA 2021 No reproduction without prior consent
13Industry analysis
The European car rental industry is fragmented with approximately 65% of the market share
being held by five major companies which operate in company-owned or franchised locations
throughout the world. The remaining share is held by regional and national companies.
The major companies operate in the market under multiple brands aimed at different target
market segments. Other smaller companies will generally operate under a single brand name
aimed at one of the market segments.
There are three main types of brands on the market:
· Premium brands: These brands provide high-quality car rental and other mobility
solutions at price points generally above value-branded car rental companies. They
serve the premium business and leisure segments of the travel industry. They tend to
offer more additional service options than lower prices brands and their range of cars
will be more extensive particularly at the prestige end of the market.
· Middle segment or value brands: These brands are aimed at the value-conscious
consumer. Prices are lower than those of the premium brands, but the level of service
and resultant customer satisfaction levels are similar. There tends to be fewer options
available in terms of the type of car and the ancillary services offered.
· Low cost or deep-value brands: These brands are aimed at the cost-conscious
consumer. Prices are lower than those of the value brands but the services on offer
are at a basic level. Customers are likely to be required to pay a relatively high deposit
as a guarantee against damage to the car. The business model used by these brands
allows companies operating with multiple brands to extend the life-cycle of a portion of
their fleet, as they “cascade” cars that exceed certain premium or value-brand age or
mileage thresholds to be used by the low cost brands.
The industry, in common with other industries, has suffered a severe setback as a result of
the recent global economic recession. Prior to 2020, market experts were predicting an
average growth in sales revenue of around 7.5% over the next 5 years, however it is now
predicted that the industry will not return to 2019 levels until 2025 and that some car rental
companies will not survive.
The car rental sector has gone through some significant changes as a result of the internet
and e-commerce:
· Online brokers and travel agents/intermediaries have grown in importance as a
distribution channel. Online websites serve as intermediaries between the client and
the operator. This is a highly competitive segment where price is the main decision
factor. Sales through brokers and intermediaries offer lower margins compared to
direct sales due to lower prices and commissions.
· The growth of the value segment, particularly in major tourist markets, e.g. in Southern
Europe. Online brokers have facilitated this change allowing small players with a
limited, local physical presence to reach a global clientele. A major consequence of
this growth is that prices have come under significant pressure.
· Car rental companies have taken advantage of the opportunities provided by
technological innovations to simplify the customer experience. This has included self-
service kiosks, online check-in and automatic rental pick-ups, all of which makes the
rental process quicker and smoother. The issue for the car rental industry is that there
are two very distinct customer groups that have very different expectations. Business
customers, who are often frequent renters, appreciate automatic rental pick-ups,
loyalty points and a global network and are willing to pay for this as a value-adding
© CIMA 2021 No reproduction without prior consent
14service. The leisure segment however is price driven and may be unwilling to pay for
these new services as the perceived value added is negligible.
· In the last few years, a number of new services, including car-sharing services, car-
club schemes and car-subscription services have come to market, driven by the overall
mobility trend.
The next few years is likely to see the industry focus on two main themes which are linked
with the increase in demand for more mobility and flexibility: Cars-as-a-Service (CaaS) and
connected car technology.
· CaaS offers potential for new business channels including car-sharing services, car-
club schemes and car-subscription services (see internet article on page 29).
· Connected technology (see internet article on page 30) allows companies clear insight
into how many cars they have available, where they are and the car status. All of this
facilitates asset management. Added to this, the use of predictive analytics technology
which predicts the likelihood of outcomes based on past data, will minimise the
likelihood of car mechanical failures. Connected-car technology also offers the
potential for new business models and will provide significant marketing opportunities
for the industry.
© CIMA 2021 No reproduction without prior consent
15Extract from the company website: Acellerate.com
The car rental process
Finding our sales counter
If you’re picking up a hire car from an airport or railway station, the rental counter might be in
the terminal or in a nearby car rental centre. In some locations you will be directed to a free
shuttle bus for transfer to the car rental centre.
What you will need to pick up the car
If you have already made a reservation online,
you will need a copy of the car rental voucher or
the rental reservation number. If you haven’t
made a reservation, our staff will ask you to
complete a reservation form. In either case, you
will also need your driving licence, proof of
identity (ID card or passport) and a credit card in
the main driver’s name, in order to pick your car
up.
Extras
The counter staff will offer you optional extra insurance which will reduce your excess in the
event of a claim or avoid the need to leave a security deposit. It’s entirely your choice whether
to buy additional insurance or not. It is not a legal requirement. You will also be offered other
ancillary products such as additional drivers, child seats or a satnav/GPS device.
Payment
You will pay for the car if you haven’t pre-booked, and pay for any extras you’ve requested or
want to add to your rental. The counter staff will also pre-authorise a security deposit on your
card, to cover costs if the car gets damaged during your rental.
© CIMA 2021 No reproduction without prior consent
16Signing the rental agreement and getting the key
Photo by Cytonn Photography on Unsplash
Don’t feel rushed into signing the rental agreement: give it a good read-through first. Keep the
documents safe: you may need to check something during your rental or need to call the
counter or roadside assistance.
Once you’ve signed the agreement, the counter staff will give you the key to your hire car and
tell you where to find it.
Take a good look over the car. If you find any issues with it, ask our staff to record the
damage before you leave the car park.
© CIMA 2021 No reproduction without prior consent
17Extract from Acellerate’s 2020 Financial Statements
Statement of profit or loss 2020 2019
for the year ended 31 December E$000 E$000
Revenue 206,278 275,037
Operating expenses:
Fleet operating costs (122,853) (163,806)
Personnel costs (40,400) (47,529)
Network and Head Office costs (18,631) (21,919)
Non-car related depreciation and amortisation (11,721) (13,790)
Operating profit 12,673 27,993
Finance charges (13,496) (17,008)
(Loss) / profit before tax (823) 10,985
Taxation 227 (1,810)
(Loss) / profit for the year (596) 9,175
© CIMA 2021 No reproduction without prior consent
18Statement of financial position 2020 2019
as at 31 December E$000 E$000
Non-current assets
Property, plant and equipment 12,488 15,611
Right-of-use assets 23,911 31,559
Intangible assets 8,451 10,564
44,850 57,734
Current assets
Inventory 2,018 2,690
Rental fleet 219,093 292,123
Rental fleet related receivables 65,958 87,944
Trade and other receivables 36,615 48,820
Cash and cash equivalents 43,921 58,562
367,605 490,139
Total assets 412,455 547,873
Equity and liabilities
Share capital 910 910
Share premium 4,737 4,737
Retained earnings 15,043 15,639
Total equity 20,690 21,286
Non-current liabilities
Borrowings 100,271 133,696
Lease liabilities 11,546 15,395
111,817 149,091
Current liabilities
Trade and other payables 42,922 59,650
Rental fleet related payables 55,496 73,995
Borrowings 173,922 231,897
Lease liabilities 7,608 10,144
Tax payable 0 1,810
279,948 377,496
Total equity and liabilities 412,455 547,873
© CIMA 2021 No reproduction without prior consent
19Extract from the notes to the financial statements
NOTE 4:
(a) Rental fleet recorded in the statement of financial position
The company operates a large fleet which is either acquired with, or without, a repurchase
agreement with the manufacturer or the dealer. The accounting treatment is detailed below:
(i) Cars acquired with a repurchase agreement (“programme’’ cars)
These cars are acquired under contracts with a clause requiring repurchase by the
manufacturer or the dealer after a predetermined period and generally less than 12 months.
The asset is recorded at the acquisition cost of the cars (net of volume rebates) in the
statement of financial position. The cost of the asset less the contractual repurchase price, is
depreciated through the statement of profit or loss on a straight-line basis over the contractual
holding period of the car. Given the duration of these assets, the company recognises these
cars as current assets under “Rental fleet” at the start of the contract.
(ii) Cars acquired without a repurchase agreement (“at risk” cars)
The so-called “at risk” cars are cars acquired without a clause requiring repurchase by the car
manufacturer or car dealer, and the risk of residual value is therefore borne by the company.
The cars are initially valued at cost and depreciated on a straight-line basis, net of their
projected residual value, over the planned holding period. The residual value of the cars is
regularly examined during the holding period in light of second-hand market conditions and
adjusted if necessary.
In most cases, the holding period of a car does not exceed 12 months. Consequently, although
"at risk" cars are in the nature of tangible non-current assets, the company classifies these
cars on the statement of financial position in current assets under "Rental fleet".
(b) Rental fleet related receivables and payables recorded in the statement of financial
position
Rental fleet related receivables are amounts due from car manufacturers or dealers after cars
purchased with a repurchase clause have been returned to the car manufacturer at the end of
the holding period.
Rental fleet related payables are amounts due to car manufacturers or dealers.
© CIMA 2021 No reproduction without prior consent
20Statement of cash flows 2020
for the year ended 31 December E$000
Cash flows from operating activities
Loss before tax (823)
Depreciation of property, plant and equipment 1,677
Depreciation of right-of-use assets 7,648
Amortisation of intangibles 2,113
Loss on disposal of property, plant and equipment 196
Net finance costs 13,496
Decrease in inventory 672
Decrease in trade and other receivables 12,205
Decrease in rental fleet receivables 21,986
Decrease in rental fleet 73,030
Decrease in rental fleet related payables (18,499)
Decrease in trade and other payables (16,728)
Cash generated from operations 96,973
Tax paid (1,583)
Interest paid (13,496)
Net cash generated from operating activities 81,894
Cash flows from investing activities
Proceeds on disposal of property, plant and equipment 1,250
Net cash used in investing activities 1,250
Cash flows from financing activities
Decrease in borrowings (91,400)
Payment of capital element of lease liability (6,385)
Net cash used in financing activities (97,785)
Net decrease in cash and cash equivalents (14,641)
Cash and cash equivalents at beginning of the year 58,562
Cash and cash equivalents at the end of the year 43,921
© CIMA 2021 No reproduction without prior consent
21Budget and costing information
Budget for the year to 31 December 2021
Total company budgeted revenue and operating profit:
Ancillary
Car rental
products Total
E$000 E$000 E$000
Sales revenue 175,565 13,185 188,750
Fleet operating costs 98,588 7,118 105,706
Fleet operating profit 76,977 6,067 83,044
Personnel costs 34,340
Network and Head Office costs* 16,768
Non-fleet related depreciation and amortisation 10,549
Operating profit 21,387
Operating profit margin 11.3%
* Network and Head Office costs include the operating costs of the sales locations, IT and
telecommunication costs, operating costs of the Head Office and sales and marketing costs.
© CIMA 2021 No reproduction without prior consent
22Detailed budget for car rental:
Large
Small Medium Prestige Total
/ SUV
Number of cars 2,800 7,800 3,200 1,200 15,000
Available days per year 1,022,000 2,847,000 1,168,000 438,000 5,475,000
Rental days per year 664,300 1,850,550 759,200 284,700 3,558,750
Fleet utilisation rate* 65% 65% 65% 65% 65%
E$ E$ E$ E$
Average per car:
Revenue per rental day 32 44 60 96
Revenue per year 7,592 10,439 14,235 22,776
Operating costs 4,720 5,780 8,360 11,280
Operating profit 2,872 4,659 5,875 11,496
E$000 E$000 E$000 E$000 E$000
Total fleet:
Revenue 21,258 81,424 45,552 27,331 175,565
Fleet operating costs 13,216 45,084 26,752 13,536 98,588
Fleet operating profit 8,042 36,340 18,800 13,795 76,977
Operating profit margin 37.8% 44.6% 41.3% 50.5% 43.8%
* Fleet utilisation rate is calculated as the number of rental days per year divided by the
number of available days per year.
© CIMA 2021 No reproduction without prior consent
23Budgeted average fleet operating costs per car:
Large /
Small Medium Prestige
SUV
E$ E$ E$ E$
Depreciation 2,250 3,000 4,500 6,750
Acquisition and disposal 190 250 340 380
Cleaning and other costs 800 850 950 1,100
Repairs and maintenance 720 780 1,120 1,330
Commission 350 400 700 800
Insurance 260 320 520 660
Road tax 150 180 230 260
Total fleet operating costs per car 4,720 5,780 8,360 11,280
Notes:
· The average fleet operating cost is based on an assumed average utilisation rate,
number of rental periods and kilometres travelled.
· Direct costs for each range of cars include depreciation, acquisition and disposal
costs, commission, insurance, road tax, parts and consumables.
· Indirect costs are apportioned to each range based on the number of cars.
© CIMA 2021 No reproduction without prior consent
24Costing information
Fleet operating costs
Direct fleet operating costs
Direct fleet operating costs consists of the following costs:
· Depreciation
· Acquisition and disposal costs
· Car insurance
· Car tax
· Parts and consumables
· Commission
After assumptions about utilisation rates, number of rentals and kilometres travelled, the total
direct fleet operating costs are assumed to vary with the number of cars.
Indirect fleet operating costs
Maintenance and repairs: the costs of maintenance and repairs include parts and
consumables which are direct costs and will vary directly with the number of cars. The
remaining maintenance and repair costs including depreciation of maintenance centre
machinery and lease costs of premises are fixed costs. These costs are apportioned to each
range of car based on the number of cars.
The capacity of the maintenance centres is fixed in the short-term. The demand on the
capacity will mainly be dependent on the number of rental periods since each car is inspected
and any repairs carried out after each rental period.
Cleaning: cleaning costs also include parts and consumables which are direct costs and will
vary directly with the number of cars. The remaining cleaning costs, including depreciation of
machinery and lease costs of premises, are fixed costs. These costs are apportioned to each
range of car based on the number of cars.
The capacity of the cleaning operation is fixed in the short-term. The demand on the capacity
will mainly be dependent on the number of rental periods since each car is cleaned after each
rental period.
© CIMA 2021 No reproduction without prior consent
25Profit by sales location
The company determines the operating profit by individual sales location.
Each sales location has an allocated fleet of cars. The allocated fleet changes on occasions
when a car is transferred to another sales location to meet fluctuations in demand or as a
result of a one way rental.
Revenue: the revenue for each sales location is based on the actual revenue achieved from
car rentals starting from that location.
Fleet operating costs: fleet operating costs are charged out to sales locations based on the
budgeted average fleet operating cost per car for the allocated fleet.
Non-fleet operating costs: the non-fleet operating costs are specific to each location and
include staff salaries, lease cost of premises, telecommunication costs and any specific
marketing costs.
© CIMA 2021 No reproduction without prior consent
26Acellerate key performance indicators
Budget Actual Actual Actual
2021 2020 2019 2018
Total sales revenue (E$000) 188,750 206,278 275,037 262,149
Operating profit (E$000) 21,387 12,673 27,993 24,235
Operating profit margin 11.3% 6.1% 10.2% 9.2%
Average number of locations 117 136 155 145
Average fleet size 15,000 17,754 19,995 18,250
Number of available days 5,475,000 6,480,210 7,298,175 6,661,250
Number of rental days 3,558,750 3,888,126 5,181,704 4,796,100
Fleet utilisation rate 65% 60% 71% 72%
Total car rental revenue (E$000) 175,565 191,938 254,990 245,320
Average per car:
Revenue per year (E$) 11,704 10,811 12,753 13,442
Revenue per available day (E$) 32.07 29.62 34.94 36.83
Revenue per rental day (E$) 49.33 49.37 49.21 51.15
© CIMA 2021 No reproduction without prior consent
27The tax regime in Everland
Corporate profits:
· The corporate tax rate applicable to taxable profits is 20%.
· The value added tax (VAT) rate is 20%. The sales revenue threshold for VAT
registration is E$150,000.
· Unless otherwise stated below, accounting rules on recognition and measurement are
followed for tax purposes.
· The following expenses are not allowable for tax purposes:
o accounting depreciation;
o amortisation;
o entertaining expenditure;
o donations to political parties; and
o taxes paid to other public bodies.
· Tax depreciation allowances are available on items of plant and machinery (including
cars used for business purposes) at a rate of 25% per year on a reducing balance
basis. A full year’s allowance is available in the year of purchase.
· Tax losses can be carried forward to offset against future taxable profits from the same
business.
© CIMA 2021 No reproduction without prior consent
28Recent internet articles
To own or not to own
30 April 2021 Michelle Dolan
The car industry has experienced an evolution fuelled by technological innovation
and driven by changing consumer behaviour. There has been a major shift from car
ownership to car “usership”. This "Car-as-a-Service" or CaaS model includes
concepts such as ride sharing, car sharing and car-club membership schemes.
One of the earliest concepts in the CaaS model was the car-subscription service
which allows customers to outsource the ownership and entire management of their
cars: from procuring it, to maintaining and remarketing it. So, for the payment of a
monthly fee you can access a brand-new car and all you will ever have to do is add
fuel. A car-subscription service also provides consumers with the potential to swap
their car after a short period if they decide they don’t like it or just want to try
something different.
Another innovation has been the emergence of car-club membership schemes in
many European cities. These schemes allow members to hire a car by the hour and
to pick it up and drop it off at a convenient location. Such schemes are especially
popular with the younger generation, as it’s a much cheaper alternative to owning a
car in a highly populated area where parking is at a premium. So far in Everland,
one such scheme exists in the capital city.
So why own a car? That is the question!
© CIMA 2021 No reproduction without prior consent
29Keeping connected
13 April 2021 Matthew Kettering
Car connectivity presents the greatest challenges but also opportunities for the car
industry. So, what is car connectivity? A connected car has two-way communication via
the internet with other systems both inside and outside the car. The connected car can
access data, send data, download software and patches, communicate with other Internet of
Things (IoT) devices, and provide WiFi for onboard passengers.
A typical journey in a connected car will include the satnav giving directions and informing
you of road difficulties ahead and the kids streaming a video in the back whilst you listen to
your favourite music. You can also turn on the central heating system before you get home
and ask your smart fridge whether you need to stop to buy milk.
The benefits for car rental and fleet management companies are immense. Car connectivity
provides a new competitive advantage to run a smarter fleet and increase efficiency and
reduce costs. Real-time visibility and critical data are allowing companies to improve their
business models and even transform them. Fleet managers are now able to manage their
fleets remotely knowing location, health status, speed, fuel consumption, temperature, tyre
pressure and much more.
© CIMA 2021 No reproduction without prior consent
30You can also read