Achieving Low-Latency Human-to-Machine (H2M) Applications: An Understanding of H2M Traffic for AI-Facilitated Bandwidth Allocation
←
→
Page content transcription
If your browser does not render page correctly, please read the page content below
626                                                                                    IEEE INTERNET OF THINGS JOURNAL, VOL. 8, NO. 1, JANUARY 1, 2021

Achieving Low-Latency Human-to-Machine (H2M)
Applications: An Understanding of H2M Traffic for
       AI-Facilitated Bandwidth Allocation
                                     Lihua Ruan , Member, IEEE, Maluge Pubuduni Imali Dias,
                                             and Elaine Wong , Senior Member, IEEE

   Abstract—Human-controlled and haptic feedback data in
emerging Tactile Internet human-to-machine (H2M) applica-
tions require stringent low-latency transmission. Understanding
the traffic features of the new applications is vital in innovat-
ing network control and resource allocation strategies to meet
their latency demand. In this article, we present our experi-
mental study on human control and haptic feedback traffic in
H2M applications and investigate novel bandwidth allocation
schemes in supporting converged H2M application delivery over
access networks. We introduce our haptic experiment system,
the developed H2M applications, and analyze the control and
feedback traffic traces collected. Then, exploiting the correlation              Fig. 1.   H2M applications over fiber-wireless access networks.
between real-time control and feedback reported in our analysis,
we propose an artificial intelligence-facilitated low-latency band-
width allocation (ALL) scheme for emerging H2M applications.                     defined as an ultrareliable and ultraresponsive network for
ALL provisions priority-differentiated bandwidth allocation for                  manipulating and/or perceiving both virtual and real objects
aggregated H2M and conventional content-centric applications
over future access networks. By using ALL, the central office
                                                                                 in a remote environment [2]. The H2M applications with hap-
preallocates bandwidth for control and its corresponding feed-                   tic capability are its featured application, whereby human
back traffic interactively and prioritizes their transmission over               operators can “feel” tactile and kinetic sensations when
content traffic. This expedites H2M application delivery by elim-                controlling remote objects and immersively interact with
inating the report-then-grant process in the existing bandwidth                  the environment [3]. Seemingly, human and machine/robot
allocation schemes. Via extensive simulations injected with exper-               interaction mutually benefits IoT functionalities and human
imental traffic traces, we comprehensively investigate the latency
performance of ALL and existing schemes. Our results validate                    communication experiences.
the superior capability of ALL in reducing and constraining                         H2M applications typically comprise: 1) a master domain
latency for H2M applications.                                                    with human operators and control interfaces; 2) a distant slave
   Index Terms—Bandwidth allocation scheme, haptic commu-                        domain with execution machines; and 3) a network domain
nication, human-to-machine applications, low latency, tactile                    that communicates human-controlled and feedback packets
Internet.                                                                        between both master and slave domains. Unlike the existing
                                                                                 content-centric and machine-centric applications that demand
                                                                                 high bandwidth, stringent low latency is required in H2M
                          I. I NTRODUCTION                                       applications whereby the control traffic from human oper-
                                                                                 ators and haptic feedback traffic from the slave machines
A. Motivations
                                                                                 need to adhere to an end-to-end latency of approximately
      OMMUNICATION networks are rapidly evolving from
C     supporting only content-centric traffic to also including
machine-centric traffic through the Internet of Things (IoT).
                                                                                 1–10 ms [4]. Lowering the network-domain latency relies on
                                                                                 strategic infrastructure deployment and upgrading, together
                                                                                 with efficient control and resource allocation over the network.
The next evolution is driven by the advent of the Tactile                           State-of-the-art research has emphasized the critical role
Internet [1], which envisions a plethora of real-time and                        of converged fiber and wireless access networks in realiz-
remotely controlled human-to-machine (H2M) applications                          ing low-latency H2M applications [5]–[7]. As illustrated in
over our communication networks. The Tactile Internet is                         Fig. 1, wireless front ends, such as cellular base stations
   Manuscript received March 15, 2020; revised May 17, 2020 and June 20,
                                                                                 and WiFi access points are integrated with optical network
2020; accepted July 1, 2020. Date of publication July 8, 2020; date of current   units (ONUs). Such a converged architecture benefits from
version December 21, 2020. (Corresponding author: Lihua Ruan.)                   the high capacity and reliability of optical networks, and the
   The authors are with the Department of Electrical and Electronic              flexibility and mobility of wireless networks. Then, by strate-
Engineering, University of Melbourne, Melbourne, VIC 3010, Australia
(e-mail: ruanl@student.unimelb.edu.au; ewon@unimelb.edu.au).                     gically placing edge intelligence at the central office (CO)
   Digital Object Identifier 10.1109/JIOT.2020.3007947                           and/or at the wireless interface at ONUs as shown in Fig. 1,
                       2327-4662
                                 c 2020 IEEE. Personal use is permitted, but republication/redistribution requires IEEE permission.
                                     See https://www.ieee.org/publications/rights/index.html for more information.

       Authorized licensed use limited to: University of Melbourne. Downloaded on January 04,2021 at 02:28:19 UTC from IEEE Xplore. Restrictions apply.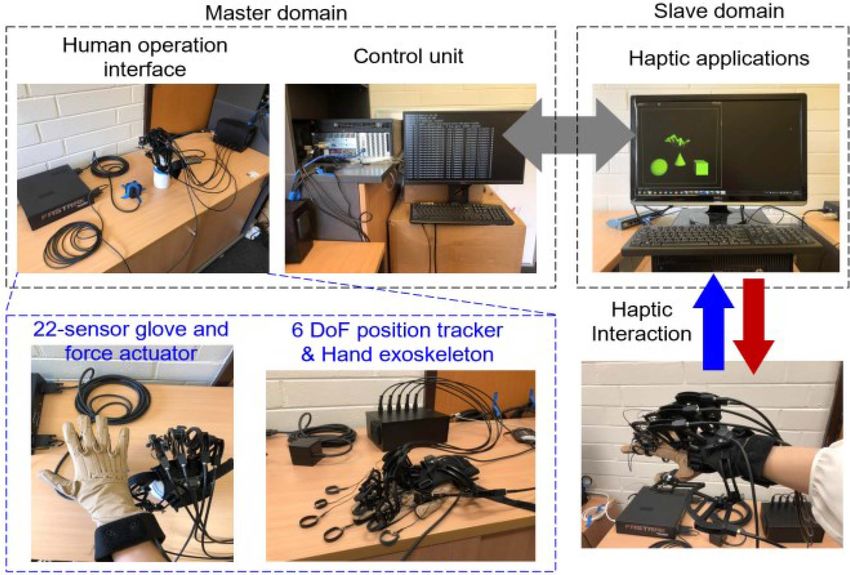
RUAN et al.: ACHIEVING LOW-LATENCY HUMAN-TO-MACHINE (H2M) APPLICATIONS: UNDERSTANDING OF H2M TRAFFIC                                                     627

data processing and exchanging can be expedited in converged                    in [19] are efficient for constant-flow traffic. ARMA in [18]
access networks [8], [9]. Note that depending on the locations                  and neural networks are typically applied to bursty arrivals.
of the masters and slaves, H2M applications can be realized                     Second, bandwidth allocation in the above schemes relies on
either locally (intra-ONU as shown in Fig. 1) or nonlocally                     the round-robin reports from ONUs. Regardless of the estima-
(inter-ONUs via the backhaul optical access network and the                     tion algorithms/techniques used, bandwidth is allocated to an
CO) [6]. In this article, we focus on the latter case since                     ONU only upon a report is received. The reports can reflect
such applications are more susceptible to the latency of con-                   the intra-ONU traffic statistics, but not sufficiently addressing
verged access networks. In order to achieve 1–10 ms latency                     the inter-ONU traffic association.
in inter-ONU communications, the latency attributed to the                         In light of the above, to improve the existing schemes
optical access network (PON) can be at most a few hundreds                      for emerging H2M applications, understanding the H2M traf-
of μs [5]. Since multiple ONUs share the same bandwidth for                     fic characteristic is essential, and research on H2M traffic at
uplink transmission to the CO, effective bandwidth resource                     present is demanded. The Tactile Internet and H2M applica-
allocation to ONUs is critical in reducing the latency.                         tions are in their infancy and H2M applications have not been
                                                                                widely practiced over the access networks. The unique traffic
                                                                                characteristics of H2M applications and their aggregation in
B. Challenges in Bandwidth Allocation                                           access networks, are yet to be fully understood and exploited
   At present, bandwidth allocation schemes in PONs are                         in the existing schemes. As stringent low latency is required by
primarily designed for content-centric applications in a report-                H2M applications, a thorough examination on the performance
then-grant manner. ONUs report the number of packets in                         of the existing schemes in supporting aggregated H2M appli-
their buffer in a round robin. The CO then responds the                         cations is warranted. Novel solutions that can ensure latency
transmission start time and duration of ONUs accordingly.                       for H2M applications in the presence of conventional applica-
The existing bandwidth allocation schemes can be classified                     tions need to be explored. These new aspects are the focus of
into classic and predictive schemes. In the classic schemes,                    this article.
the CO primarily allocates bandwidth in accordance with
the bandwidth requested by the ONUs. The limited service
scheme is currently the widely-adopted baseline, whereby the                    C. Original Contributions
CO grants bandwidth equal to the request but not exceeding                         In this article, we develop interactive H2M applications to
a threshold [10]. In comparison, in the predictive schemes,                     experimentally study the human control and haptic feedback
the CO allocates some surplus bandwidth in addition to the                      traffic in H2M applications. In our experiments, we report the
request [10]. This allows ONUs to transmit arrivals without                     statistical and time-domain characteristics of H2M arrivals,
reporting, thereby reducing the latency. Credit schemes were                    highlighting the arrival models and the cross-correlation of
early predictive schemes that provide a fixed amount of sur-                    control and feedback traffic. Exploiting the characteristics
plus bandwidth to ONUs [10], [11]. Furthermore, statistical                     reported, we propose an AI-facilitated low-latency bandwidth
predictive schemes utilize estimation algorithms to estimate                    allocation (ALL) scheme to improve the latency of access
the surplus bandwidth. For example, the Bayesian algorithm                      networks in supporting future aggregated H2M and content
was utilized to estimate packet interarrival time, which can                    applications. Note that a preliminary study of our experiments
then be used to estimate bandwidth demand [12]–[14]. Various                    was presented in [23], where only time-domain traffic anal-
schemes as in [15]–[18] adopted short-term traffic prediction                   ysis was presented. In comparison, this article details our
algorithms, e.g., linear regression and autoregressive moving                   experiments, extends comprehensive analysis on H2M traffic
average (ARMA), in estimating bandwidth for bursty arrivals.                    characteristics, and proposes the ALL scheme that: 1) facili-
   Concurrently, artificial intelligence (AI) and machine learn-                tates interactive and predictive bandwidth allocation for H2M
ing (ML) techniques are also utilized for predictive schemes.                   applications harnessing an ANN and 2) ensures low H2M
The scheme in [19] used the k-nearest neighbourhood (kNN)                       latency via priority-differentiation bandwidth estimation and
to estimate arrivals of video flows. The support-vector                         allocation for H2M and content traffic. With extensive simu-
machine was used to sifting noise data to enhance bandwidth                     lations using experimental traffic traces, the performance of the
utilization [20]. Hatem et al. [21] exploited a recurrent neural                existing schemes and the ALL in supporting aggregated H2M
network and deep learning to estimate bandwidth for multiple                    and content application is comprehensively compared and ana-
polling cycles ahead. Our previous work investigated the use                    lyzed. The effectiveness of the ALL scheme is validated. The
of multilayered artificial neural networks (ANNs) in improv-                    contributions of this work are summarized in threefold.
ing the bandwidth estimation accuracy for bursty traffic [22],                     1) Experimental investigation on low-latency human con-
[23], [43]. Mikaeil et al. [24] studied the use of ANN for                             trol and haptic feedback traffic in H2M applications, and
traffic prediction in the next-generation access networks.                             provision of insights in both statistical and time-domain
   Note that the design and performance of the above schemes                           characteristics of H2M traffic. Together with state-of-
are closely tied with the traffic characteristics. First, bandwidth                    the-art research on H2M applications, this experimental
estimation in these schemes relies on packet arrival statistics,                       study aims to add understandings to the H2M traffic.
such as e.g., interarrival time and the number of arrivals on                      2) Proposal of the ALL scheme that interactively allo-
record. Consequently, the performance of the existing schemes                          cates bandwidth for H2M traffic. To the best of our
is impacted by such traffic statistics in application scenarios.                       knowledge, the ALL scheme is the first attempt to inno-
For examples, credit schemes in [10] and kNN-based scheme                              vate bandwidth allocation taking the unique H2M traffic

      Authorized licensed use limited to: University of Melbourne. Downloaded on January 04,2021 at 02:28:19 UTC from IEEE Xplore. Restrictions apply.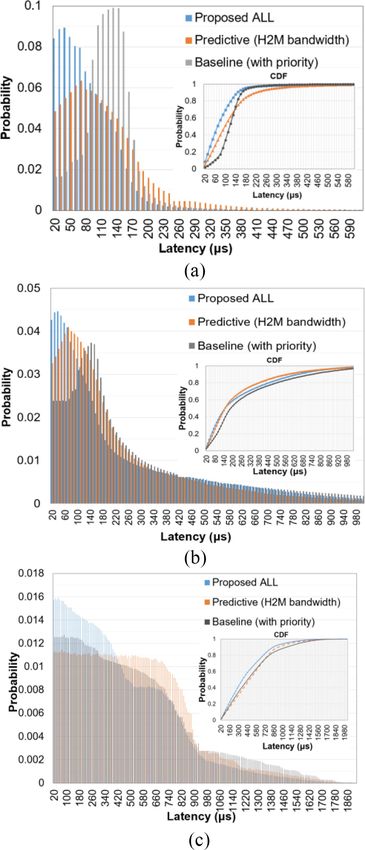
628                                                                                   IEEE INTERNET OF THINGS JOURNAL, VOL. 8, NO. 1, JANUARY 1, 2021

       characteristics and latency demand into account for
       aggregated H2M and content applications in converged
       access networks.
   3) Performance evaluation of the existing bandwidth allo-
       cation schemes and the ALL scheme, providing the first
       examination on existing schemes in supporting emerging
       H2M applications using experimental H2M traffic.
   In the remainder of this article, Section II overviews the
studies on H2M traffic and how such knowledge is used to
improve resource allocation. The experiments and traffic anal-
ysis are in Section III. Section IV presents the ALL scheme.
Results are evaluated in Section V. Finally, we summarize in
Section VI.

                                                                                Fig. 2.   Teleoperation system for haptic H2M applications.
           II. R ELATED W ORK ON H2M T RAFFIC
   Real-time human control and haptic traffic in H2M appli-
cations are the latest traffic that needs to be supported
by our communication networks. In supporting their low-
latency transmission, studying the H2M traffic characteristics
is vital and draws growing research interests. As detailed
in [25], human control and haptic feedback in H2M applica-
tions are mainly described by the Degree of Freedom (DoF),
i.e., the number of different directions that create forces,
e.g., 3-DoF force along x-, y-, z-axis in a touch spot. The                     Fig. 3. Experimental H2M (teleoperation) applications. (a) Hand movement.
                                                                                (b) Touching. (c) Grasping and moving.
control/feedback packets may comprise one DoF to over
hundreds of DoFs, which are sampled/generated by master
control interface/slave machines [26]. The H2M communi-
cation was studied in [27]–[29] and several observations on                     our experimental analysis and the proposed ALL scheme in
H2M traffic were presented. Feng et al. [30] investigated the                   reducing inter-ONU H2M communication latency in PONs.
coding schemes and discussed a bursty profile of control
and force feedback packets in their teleoperation experi-
ment. This knowledge of burstiness was used to design
                                                                                        III. E XPERIMENTAL H2M A PPLICATIONS AND
a bandwidth resource reservation scheme for wireless access
                                                                                                       T RAFFIC A NALYSIS
networks [28]. In [29], haptic traffic in several application
cases, such as immersive virtual reality, teleoperation, was                    A. Haptic Teleoperation System and Applications
studied. Different haptic packet arrival models, including peri-                   Our experiments comprise a series of interactive H2M
odic, event based, and bursty, of these applications, were                      applications based on a commercial haptic teleoperation
reported. Using these models, a latency optimal radio resource                  system [33]. As illustrated in Fig. 2, the system is an inno-
management was proposed to ensure latency and reliability in                    vative touch and force feedback teleoperation platform for
LTE networks. Feng et al. [30] modeled bursty H2M traf-                         fingers and hands, allowing human operators to remotely touch
fic in a switched Poisson process and proposed to adaptively                    and grasp computer-generated virtual objects. The master
reserve and allocate resource in cellular networks [31]. Recent                 domain consists of a human operation interface and a control
research reported in [32] analyzed the statistical nature of                    unit as shown in Fig. 2. The interface includes a 22-sensor
H2M packet interarrival time in two teleoperation systems.                      data glove and a 6-DoF position tracker that capture human
In this study, the authors discussed different arrival models,                  hand movements and actions. A hand exoskeleton is strapped
including deterministic, Gamma, generalized Pareto (GP), and                    to the glove, reacting to the haptic feedback by creating
Poisson distributions. Our previous study in [13] adopted the                   different resistive forces at fingers and joints.
Poisson and Pareto-distributed H2M arrival models to improve                       In slave-domain applications, a virtual hand can be con-
bandwidth and wavelength allocation schemes in PONs for                         trolled to touch and/or grasp virtual objects as shown in Fig. 2.
H2M applications.                                                               Then, the haptic feedback, indicating the reaction and friction
   The above research implicated the burstiness of H2M traf-                    forces of the virtual objects, is delivered back to the master-
fic and described arrival models to characterize the bursty                     domain exoskeleton to actuate feelings of touch and force. In
pattern. Nevertheless, compared to conventional content appli-                  our study, we develop three types of H2M applications that
cations, H2M applications have not been widely utilized over                    create different haptic feedback as follows. These applications
access networks. Continuing experimental investigations on                      are illustrated in Fig. 3. The control and haptic feedback traffic
H2M traffic are still necessary and novel bandwidth alloca-                     in each application are specified in Table I.
tion schemes to support low-latency H2M applications need                          1) Application A: Moving the hand in free space. The vir-
to be explored. For these purposes, we present the details of                          tual hand in the virtual space moves with the human

      Authorized licensed use limited to: University of Melbourne. Downloaded on January 04,2021 at 02:28:19 UTC from IEEE Xplore. Restrictions apply.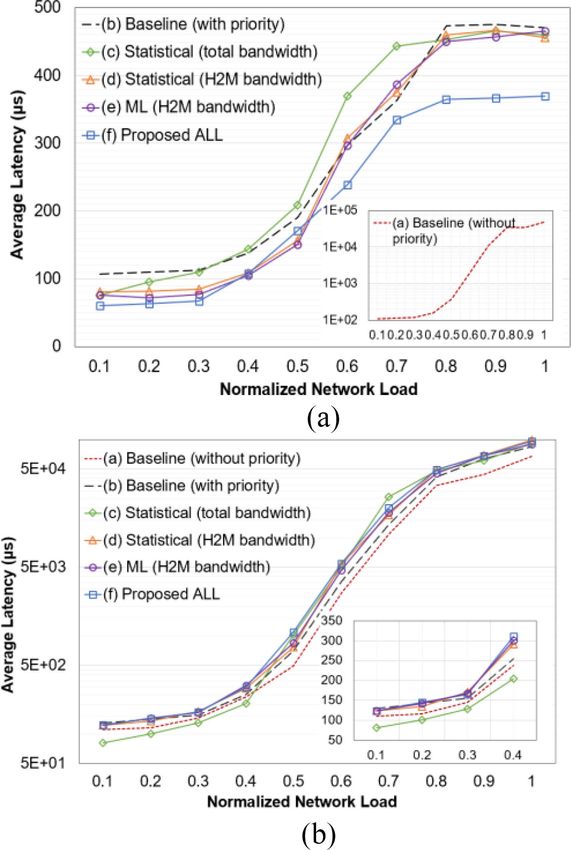
RUAN et al.: ACHIEVING LOW-LATENCY HUMAN-TO-MACHINE (H2M) APPLICATIONS: UNDERSTANDING OF H2M TRAFFIC 629
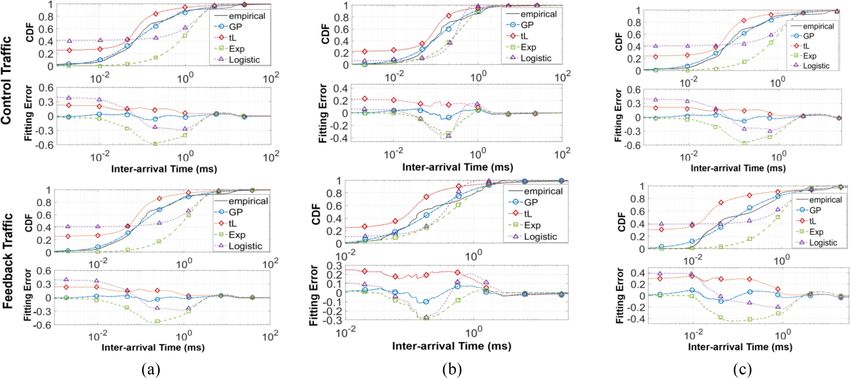
Fig. 4. Control and feedback packet interarrival time cumulative distribution functions of (a)–(c) Applications A–C.
TABLE I TABLE II
E XPERIMENTAL H2M A PPLICATIONS AND C ONTROL /H APTIC AVERAGE CDF F ITTING E RROR
F EEDBACK T RAFFIC
TABLE III
F ITTED PARAMETERS IN GP D ISTRIBUTIONS *
hand in real time as shown in Fig. 3(a). Without inter-
actions with virtual objects, a constant default force is
put to the figures.
2) Application B: Touching a virtual ball surface. A vir-
tual ball is placed in the virtual space. When the hand
touches the ball as shown in Fig. 3(b), reaction forces B. Statistical Analysis: Packet Interarrival Time
act to fingers to imitate stiffness of the object texture. Packet interarrival time is one of the key features in study-
3) Application C: Grasping and moving objects, i.e., a ball, ing network traffic. The statistics of interarrival time can
a box, and a cone in the virtual space. When human be utilized in traffic classification [34] and fitting arrival
operators pick an object and move it in virtual space as models [35]. In this article, we fit control and feedback packet
shown in Fig. 3(c), vibrated forces are put to fingers to interarrival times into a variety of distributions in the existing
create the feeling of friction when moving the object. network traffic studies [32], [36]. The candidate distributions
The control traffic in Applications A–C contains similar include Exponential, Gamma, GP, Inverse Gaussian, Logistic,
content, i.e., hand posture and position. The haptic feedback Lognormal, Nakagami, Normal, t-location (tL), and Weibull.
traffic depends on the type of applications. Based on the The maximum likelihood estimation is utilized to fit the
developed Applications A–C, we collect human control and parameters in each candidate distribution. The goodness of
feedback traffic traces during H2M interaction. In our exper- fitting is measured by comparing the average fitting error
iments, we allow human participants to start an application, between the fitted cumulative distribution function (CDF) and
perform operations such as grasping either a ball or a box, the experimental CDF. The fitting results are presented in
and move it to a random position such as in Application C, Fig. 4 and Tables II and III.
and pause/restart an application at any time. Each experiment In Fig. 4, we plot the CDFs and fitting errors of the
lasts around 20 mins. Then, we analyze the statistical charac- top-four best fitted distributions, i.e., GP, tL, Logistic, and
teristics of the experimental control and feedback traffic. The Exponential (Exp) distributions, to our experimental traces.
comparative analysis with existing studies on H2M traffic and Notably, in both control and feedback traces, the GP best
the content traffic over the Internet is presented as follows. fits empirical distributions. This observation is consistent in
Authorized licensed use limited to: University of Melbourne. Downloaded on January 04,2021 at 02:28:19 UTC from IEEE Xplore. Restrictions apply.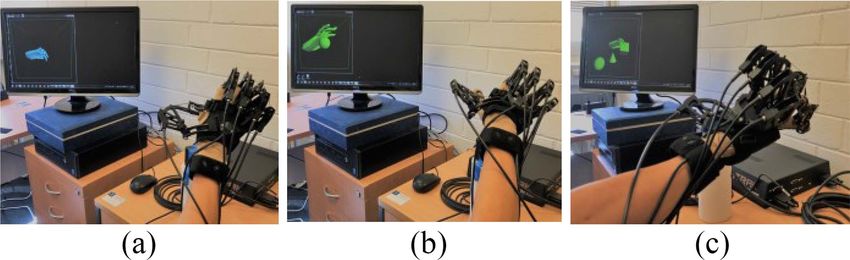
630                                                                                      IEEE INTERNET OF THINGS JOURNAL, VOL. 8, NO. 1, JANUARY 1, 2021

Fig. 5.    Illustration of control and feedback traffic in Application C.

Applications A–C, and in both control and feedback traces
in Fig. 4(a)–(c). Compared to GP distribution, the rest distri-
butions incur higher fitting errors provided in Table II. The
fitted parameters in Applications A–C are listed in Table III.
It can be noted that the parameter pairs only slightly vary
in different applications, but are distinct in control and feed-
back traces. In the existing studies, the GP-distributed H2M
arrivals are also reported, such as in [29] and [32]. As such,
we highlight the GP distribution as a potential model for H2M
arrivals. However, it should be noted that due to the current
limited knowledge on H2M traffic, more rigorous experimen-
tal studies using diverse H2M applications are still warranted                      Fig. 6.        Illustration of control and feedback traffic correlation.
to validate the observations on H2M traffic.                                        (a) Application A. (b) Application B. (c) Application C.
    From Fig. 4, the CDFs of control and feedback packet inter-
arrival time indicate intensive control and feedback packets                        ρ(k) can be calculated as follows:
exchange during H2M interactions. The control packets are
                                                                                                   1  [fbk(ti ) − μfbk ] ctr(ti−k ) − μctr
                                                                                                     N
transmitted every a few hundreds of microseconds, and the
                                                                                            ρ(k) =                                                           (1)
feedback packets immediately respond. As such, we further                                          N                 σctr σfbk
                                                                                                          i=1
investigate the correlation in the collected traffic traces.
                                                                                    where ctr(ti ) and fbk(ti ) denote the total bytes of control and
C. Time-Domain Analysis: Control/Feedback Correlation                               feedback traffic transmitted in polling cycle i, respectively.
                                                                                    μctr , μfbk , σctr , and σfbk represent the means and variances
   In Fig. 5, we present the human control and haptic feedback                      of control and feedback traffic, respectively. The variable
traffic pattern by plotting the dynamic traffic volume (Mbps)                       k(k = 0, 1, 2, · · ·) indicates the time lag in the unit of polling
in Application C on different time scales, i.e., 1 ms, 1 s, and                     cycle. Similarly, the self-correlation, i.e., autocorrelation in
10 s. Fig. 5 shows an example experiment in which a human                           equivalent, of control and feedback trace, denoted as ρ 1 (k)
operator first moves the hand in virtual space, then grasps the                     and ρ2 (k), respectively, can be calculated by
three virtual objects, i.e., the ball, cone, and cube as depicted
                                                                                                        1  [ctr(ti ) − μctr ] ctr(ti−k ) − μctr
                                                                                                           N
in Fig. 3(c). Note that after moving or grasping, the human
operator pauses his action for a while. This is to distinguish                             ρ1 (k) =                                                    (2)
                                                                                                       N                    σ 2 ctr
traffic from different actions for the illustrative purpose. The                                          i=1

                                                                                                        1  [fbk(ti ) − μfbk ] fbk(ti−k ) − μfbk
                                                                                                           N
observations of the traffic in Applications A and B are sim-
ilar to those shown in Fig. 5. Therefore, we do not repeat                                 ρ2 (k) =                                                  . (3)
                                                                                                       N                      σ 2 fbk
the analysis for different experiments. As can be observed in                                             i=1
Fig. 5, control and feedback packets are closely correlated,                        Fig. 6 compares ρ(k), ρ 1 (k), and ρ 2 (k) in Applications A–C.
and packet arrivals fluctuate on the 1-ms granularity compared                      Note that ρ 1 (k) and ρ 2 (k) are even functions in k, and ρ 1 (0)
to the 1-s and 10-s timescales. Note that in PONs, the CO                           and ρ 2 (0) equal to 1. We focus on the positive k values in ana-
allocates uplink bandwidth to ONUs in a round-ribbon man-                           lyzing the correlation. The results in Fig. 6 indicate a stronger
ner and the interval between consecutive transmissions of an                        cross-correlation, i.e., ρ = 0.6−0.8, between control and feed-
ONU, known as a polling cycle, is in millisecond order. As                          back than the self-correlation, i.e., ρ1 < 0.6 and ρ2 < 0.4, of
such, the short-term (within ms) traffic characteristic is critical                 the individual traces. Particularly, the high cross-correlation,
for bandwidth allocation improvement.                                               i.e., ρ > 0.6, is shown between the bilateral traces in the
   We analyze the correlation between control and feedback                          same or the most recent polling cycles, i.e., at k = 0 and 1.
traffic on the time scale of polling cycles. Considering a 1-ms                     This is mainly attributed to that haptic feedback responds
polling cycle duration and a sequence of control/feedback                           to human control in real time. Based on the above analysis,
packets (in bytes) in N polling cycles, the Pearson cross-                          leveraging the control and feedback cross-correlation in band-
correlation between control and feedback traffic denoted as                         width prediction and allocation can potentially improve the

          Authorized licensed use limited to: University of Melbourne. Downloaded on January 04,2021 at 02:28:19 UTC from IEEE Xplore. Restrictions apply.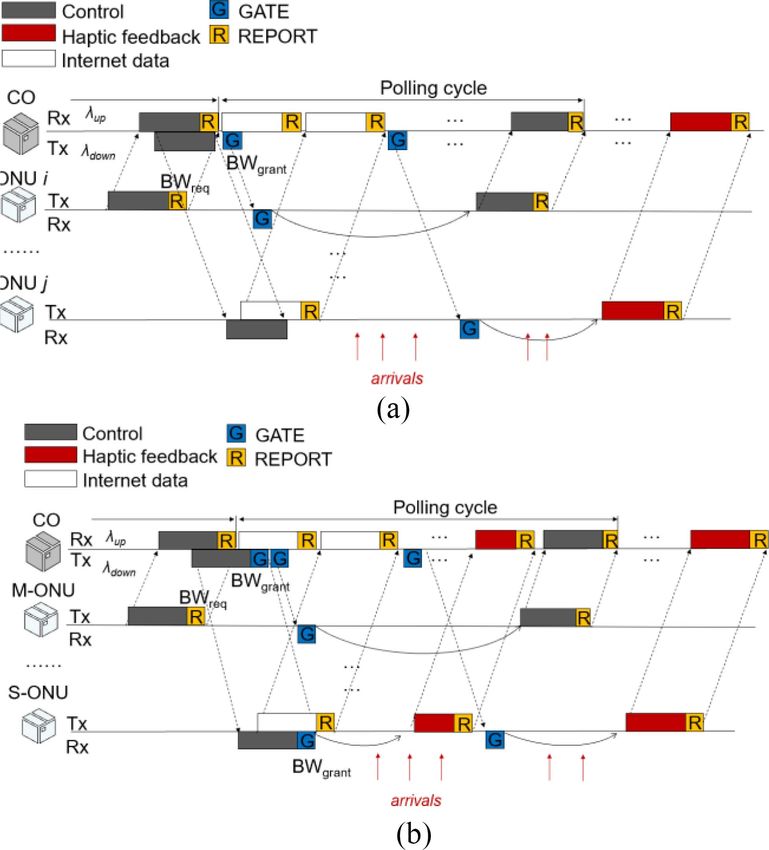
RUAN et al.: ACHIEVING LOW-LATENCY HUMAN-TO-MACHINE (H2M) APPLICATIONS: UNDERSTANDING OF H2M TRAFFIC                                                       631

                                                                                  scheme for H2M bandwidth estimation, given its proven abil-
                                                                                  ity and the ease of use [39]–[43]. In comparison, we consider
                                                                                  moving average-based algorithms for statistical predictive
                                                                                  schemes. This type of algorithms remains a vital solution in
                                                                                  estimation bandwidth for PONs [15]–[18]. It should be noted
                                                                                  that improving bandwidth estimation is not the focus of this
                                                                                  study. We follow the existing methods in facilitating bandwidth
                                                                                  allocation.
                                                                                     Note that as shown in Fig. 7(a), the CO allocates bandwidth
                                                                                  to ONUs based on their independent reports. Differently, in the
                                                                                  ALL scheme, we propose to interactively allocate bandwidth
                                                                                  exploiting the inter-ONU control and feedback traffic correla-
                                                                                  tion. Furthermore, as differentiating H2M and content traffic
                                                                                  in their bandwidth estimation and allocation is yet to be fully
                                                                                  studied in the existing predictive schemes, we also present our
                                                                                  design in this aspect in the ALL scheme.

                                                                                  B. Proposed ALL Scheme
                                                                                     The operation diagram of the ALL scheme is illustrated in
                                                                                  Fig. 7(b). In the ALL scheme, the CO grants bandwidth to
                                                                                  subsequent feedback traffic at the same time when forwarding
Fig. 7. Uplink bandwidth allocation over optical access networks. (a) Existing
bandwidth allocation schemes. (b) Proposed ALL scheme.
                                                                                  control packets to the ONUs, thereby eliminating the band-
                                                                                  width request process and effectively reducing the latency. To
network performance for inter-ONU H2M communications.                             explain the ALL, we categorize ONUs associated with master
As such, we propose the ALL scheme for low-latency H2M                            human operators as an M-ONU, and the counterpart ONUs
applications, detailed as follows.                                                associated with slave machines/robots as S-ONUs as shown
                                                                                  in Fig. 7(b). Note that an ONU can be both an M-ONU
                                                                                  and S-ONU as it can support control and feedback traffic
     IV. BANDWIDTH A LLOCATION FOR L OW-L ATENCY
                                                                                  from multiple H2M applications. In Fig. 7(b), at the CO, the
                      H2M A PPLICATIONS
                                                                                  feedback bandwidth of an S-ONU is estimated based on the
A. Bandwidth Allocation Schemes                                                   received control traffic from its counterpart M-ONU. Then,
   Fig. 7 shows the diagram of bandwidth allocation schemes.                      when the CO forwards the control, a GATE is appended to
As illustrated in Fig. 7, the CO broadcasts downlink packets                      preallocate bandwidth instead of waiting for the report from
to ONUs using downlink wavelength λdown . In the uplink,                          the S-ONU. The ways to achieve bandwidth estimation, allo-
ONUs share uplink wavelength λup for uplink transmission.                         cation and priority differentiation in the ALL scheme are as
Following a report–grant process as introduced earlier, an ONU                    follows.
requests bandwidth using a REPORT piggybacked to the uplink                          1) AI for H2M Bandwidth Estimation: We use an ANN
data. The REPORT notifies the CO of its buffer occupancy                                to realize bandwidth estimation for H2M traffic, given
BWreq . Upon receiving the REPORT, the CO grants bandwidth                              its ability to attain accurate estimation [39]–[43]. For
BWgrant , by sending a GATE to the ONU. The GATE indicates                              a pair of M-ONU and S-ONU, the control and feedback
the assigned transmission start time and duration. This process                         arrivals (counted in bytes) of Applications A–C at an
repeats for each ONU in each polling cycle.                                             M-ONU in the most recent four polling cycles, are used
   For inter-ONU communication, the CO forwards the                                     as the inputs to the ANN, and the target output is the
received data from ONU i to its destination ONU j in broadcast                          estimated feedback bandwidth of the S-ONU in the next
as shown in Fig. 7(a). Recall that in the baseline limited service                      polling cycle. The training set contains ONUs’ arrival
scheme, the CO allocates bandwidth equal to the request, i.e.,                          records of 104 polling cycles, and the training objec-
BWgrant = min{BWreq , BWmax }. The BWmax is the maximum                                 tive is to minimize the mean-square error (MSE) of the
bandwidth that can be assigned to an ONU in each polling                                estimation. By layerwise training [37], i.e., adding the
cycle. As such, in the baseline scheme, packets arriving in the                         number of neurons and layers incrementally, a 2-hidden
current polling need to be reported and then transmitted in the                         layer ANN architecture with five and three neurons in
next polling cycles. In reducing latency, the predictive schemes                        each layer is determined. The gradient descent method
predict arrivals and allocate surplus bandwidth BWpred such                             is used to yield the weights and bias associated with
that BWgrant = min{BWreq + BWpred , BWmax }. This allows                                the neurons. The final ANN architecture is shown in
some arriving packets to be transmitted in the current polling                          Fig. 8, and the attained MSE is in the order of 102 .
cycle without needing to be reported, thereby reducing latency.                         Our preliminary study in [23] details the ANN training
   In the existing schemes, this BWpred can be estimated by                             process and the MSE comparison with the existing
using statistical algorithms or ML techniques as overviewed.                            bandwidth estimation methods. In this article, we focus
In this article, we consider the use of ANN in our proposed                             on innovating bandwidth allocation for H2M traffic.

        Authorized licensed use limited to: University of Melbourne. Downloaded on January 04,2021 at 02:28:19 UTC from IEEE Xplore. Restrictions apply.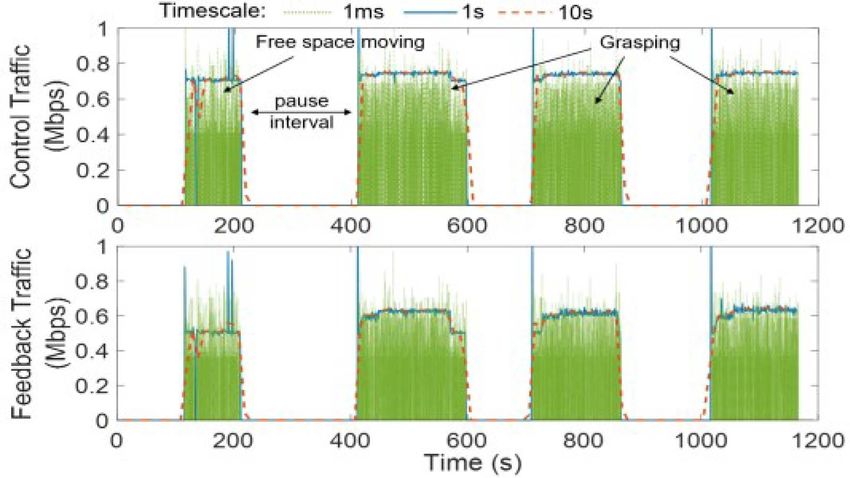
632                                                                                      IEEE INTERNET OF THINGS JOURNAL, VOL. 8, NO. 1, JANUARY 1, 2021

                                                                                    Algorithm 1 ALL Scheme: Pseudocode of CO Bandwidth
                                                                                    Allocation
                                                                                    tscheduled — time up to which the uplink channel has been scheduled
                                                                                    tlocal — current system local time
                                                                                    RTT — round-trip transmission time
                                                                                    T g , T process , T REPORT — guard time; processing time; REPORT
                                                                                    tstart (m, k) and tend (m, k) — start and end time of granted timeslot for an
                                                                                    ONU m in the kth polling cycle
                                                                                    tstart_fbk (m) and tend_fbk (m)— start time of granted timeslot for haptic
                                                                                    feedback traffic of an ONU m
                                                                                    RPON — data rate in the optical access network
                                                                                    BWreq (cont, i, k), BWreq (ctr, i, k), and BWreq (fbk, i, k) — content, control,
Fig. 8.    Illustration of the ANN architecture.                                    and feedback bandwidth requested by ONU i in the kth polling cycle
                                                                                    BWpred (ctr, i, k) and BWpred (fbk, i, k) — estimated control and feedback
                                                                                    bandwidth for ONU i in the kth polling cycle
   2) Interactive H2M Bandwidth Allocation: The CO grants                           BWgrant (i, k+1) — allocated bandwidth for ONU i
       the estimated bandwidth to an S-ONU when forward-                            The operation at the CO upon receiving the REPORT in the kth polling
                                                                                    cycle from ONU i (repeat for all k and i):
       ing the control traffic as shown in Fig. 7(b). This                          1{
       expedites the feedback delivery in response to the con-                      2 // bandwidth estimation for a pair of M- and S-ONU
       trol. Furthermore, to reduce the waiting time of control                     3 Read: BWreq (cont, i, k), BWreq (ctr, i, k) and BWreq (fbk, i, k)
                                                                                    4 Bandwidth estimation by ANN (refer to Section IV-B:
       arrivals at the ONUs, control bandwidth is allocated as                      5 AI for H2M bandwidth estimation):
       in the existing predictive schemes introduced earlier. The                   6 BWpred (fbk, j, k + 1) for its counterpart S-ONU j
       control bandwidth estimation can be fulfilled using an                       7 BWpred (ctr, i, k + 1) for the reporting ONU i
                                                                                    8 // schedule start and end time for feedback from S-ONU j
       ANN following the same training process above, which                         9 if BWpred (fbk, j, k + 1) > 0
       is not repeated justified here. Overall, for H2M appli-                      10        tstart_fbf (j) = min{tlocal + RTT/2 + T process ,
       cations, the CO allocates bandwidth to control traffic                       11                         tscheduled − RTT/2 − Tprocess };
                                                                                    12        tend_fbf (j) = tstart_fbf (j) + BWpred (fbk, j, k + 1)/RPON ;
       predictively and to the feedback interactively exploiting                    13        Send a GATE with tstart_fbk (j) and tend_fbk (j) to ONU j.
       the correlation, thereby reducing for H2M applications.                      14        // update scheduled time in the uplink channel
   3) Priority-Differentiated Estimation and Allocation: Since                      15        tscheduled = tend_fbk (j) + T guard ;
       future networks need to support aggregation of H2M and                       16 End
                                                                                    17 // schedule start and end time for ONU i
       conventional content traffic, appropriate differentiation                    18 tstart (i, k + 1) = min{LocalTime + RTT/2 + Tprocess , tscheduled
       in allocating bandwidth for H2M and content traffic, and                     19                         −RTT/2 − Tprocess };
       in their transmission, is necessary. This is because H2M                     20 BWgrant (i, k + 1) = min{BWreq (cont, i, k) + BWreq (ctrt, i, k) +
                                                                                    21                         BWreq (fbk, i, k) + BWpred (ctr, i, k + 1), BWmax
       packets demand stringent low latency in communication.                       22                         −BWpred (fbk, i, k)};
       Unlike the existing predictive schemes that allocate esti-                   23 tend (i, k + 1) = tstart (i, k + 1) + BWgrant (i, k + 1)/RPON + TREPORT ;
       mated bandwidth to all aggregated arrivals to ONUs, in                       24 tscheduled = tend (i, k + 1) + T guard ;
                                                                                    25 }
       the ALL scheme, the CO allocates bandwidth to content
       traffic only equal to that in the report. Specifically, in
       the ALL scheme, an ONU buffers control, feedback, and
       content arrivals in separate queues. The number of pack-
                                                                                                    V. P ERFORMANCE E VALUATION
       ets in each queue, equivalently the bandwidth demand,
       is reported to the CO in each polling cycle. The CO                          A. Simulation Settings
       allocates content bandwidth equal to that reported, grants                      To evaluate the performance of the ALL scheme, we imple-
       surplus control bandwidth in addition to the request, and                    ment packet-level simulation in MATLAB. A 1 Gb/s PON with
       preallocates feedback bandwidth when forwarding con-                         16 ONUs is considered. In our simulation, we pair two ONUs,
       trol packets. In the transmission time slots of ONUs, the                    e.g., ONUs i and j, and consider inter-ONU H2M communica-
       transmission of H2M packets in the buffer is prioritized                     tion between them. The control and feedback traces collected
       in achieving low latency.                                                    in Applications A–C are injected to ONUs to emulate H2M
   To show the implementation of the above three aspects, the                       arrivals. Concurrently, noting that the characteristic of content
pseudocode of the ALL scheme is provided in Algorithm 1.                            traffic is widely investigated, such as in [10] and [38]–[40],
Upon receiving the REPORT from an ONU i in the kth polling                          we generate content arrivals to ONUs using synthetic traffic
cycle, the CO estimates control bandwidth, BWpred (ctr, i, k +                      source following the Pareto distribution as detailed in [10].
1), for ONU i and feedback bandwidth, BWpred (fbk, j, k + 1),                       Normalized network traffic loads from 0.1 to 1 are simulated.
for the counterpart ONU j (lines 2–7 in the pseudocode).                            The maximum polling cycle duration is set as 1 ms.
Then, the CO grants BWpred (fbk, j, k + 1) to ONU j when                               We compare the average latency of H2M and content packet
forwarding the control traffic (lines 9–16). This is to expedite                    in: 1) the baseline scheme without priority; 2) the baseline
feedback delivery harnessing the correlation between the con-                       scheme with priority, i.e., prioritizing H2M traffic; 3) the sta-
trol and feedback. For ONU i that sends the REPORT, the total                       tistical predictive scheme that estimates the H2M and content
bandwidth BWgrant (i, k + 1), including both the requested and                      bandwidth in total; 4) the statistical predictive scheme that only
estimated bandwidth, is allocated (lines 17–24). In this way,                       estimates H2M bandwidth; 5) the ML-based predictive scheme
priority-differentiated bandwidth estimation and allocation for                     that estimates H2M bandwidth with an ANN; and 6) the
content and H2M traffic are facilitated.                                            proposed ALL scheme. In these schemes, the transmission of

          Authorized licensed use limited to: University of Melbourne. Downloaded on January 04,2021 at 02:28:19 UTC from IEEE Xplore. Restrictions apply.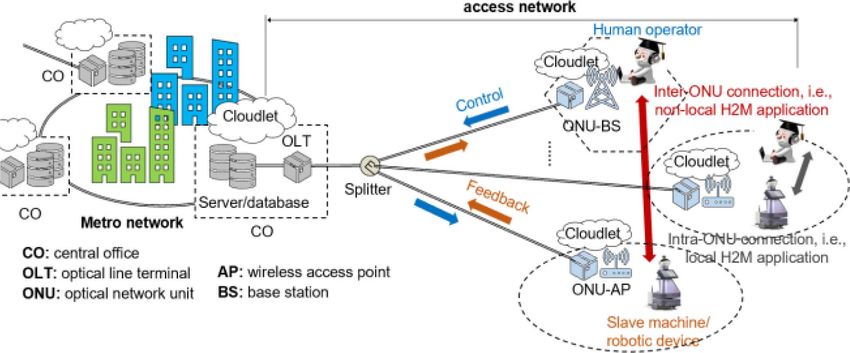
RUAN et al.: ACHIEVING LOW-LATENCY HUMAN-TO-MACHINE (H2M) APPLICATIONS: UNDERSTANDING OF H2M TRAFFIC                                                      633

                                                                                 Fig. 10.   Average polling cycle duration comparison.

                                                                                    As shown in Fig. 9(a), in the light load region, i.e., network
                                                                                 loads 0.1–0.3, adopting priority in the baseline scheme does
                                                                                 not improve the latency performance compared to the no
                                                                                 priority case. This is because when the content buffer is
                                                                                 empty under light loads, the H2M packets experience the
                                                                                 report–grant latency. As such, prioritizing H2M traffic in
                                                                                 the baseline scheme sees benefits only when the network
                                                                                 load is above 0.3 in Fig. 9(a). Compared to the baseline
                                                                                 scheme 2), predictive schemes reduce the latency, depending
                                                                                 on the network loads and the amount of surplus bandwidth
Fig. 9. Latency performance comparison. (a) H2M traffic. (b) Content traffic.    estimated and allocated. This is illustrated by comparing
                                                                                 the statistical predictive schemes 3) and 4). Fig. 9(a) shows
                                                                                 that the H2M latency of scheme 3) is below the base-
                                                                                 line schemes only under network loads 0.5, the baseline scheme 2) shows
feedback bandwidth in responding to the control. We plot the                     a lower latency over all the predictive schemes as it prevents
polling cycle durations in Fig. 10 and explained more details.                   bandwidth over granting.

       Authorized licensed use limited to: University of Melbourne. Downloaded on January 04,2021 at 02:28:19 UTC from IEEE Xplore. Restrictions apply.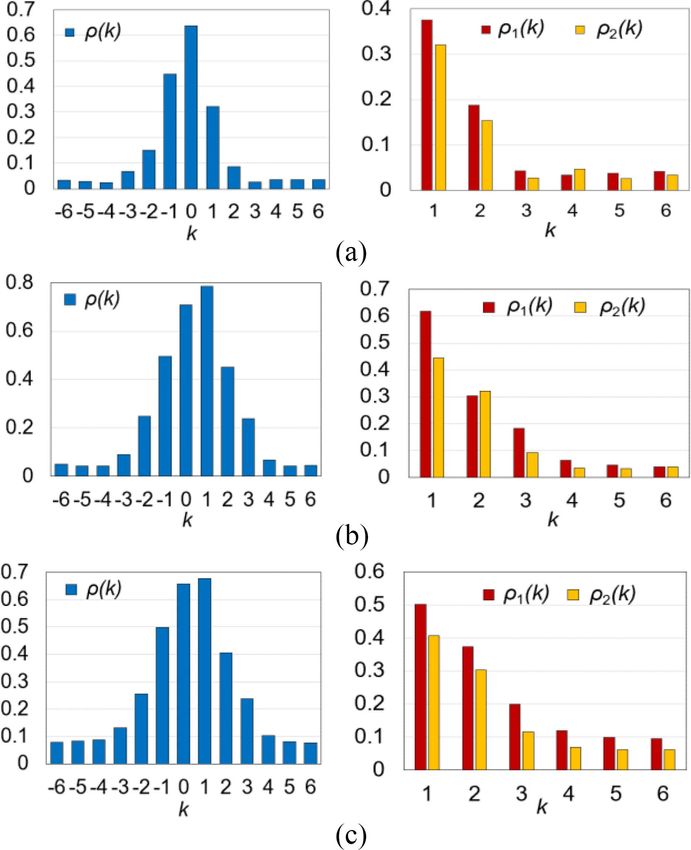
634                                                                                    IEEE INTERNET OF THINGS JOURNAL, VOL. 8, NO. 1, JANUARY 1, 2021

                                                                                  on the above evaluations, we narrow our focus to the baseline
                                                                                  scheme (with priority), predictive scheme (H2M bandwidth),
                                                                                  and the ALL scheme. In Fig. 11(a)–(c), we present H2M
                                                                                  packet latency distributions and CDF under network load
                                                                                  0.2 (light load), 0.5 (moderate load), and 0.8 (high load),
                                                                                  respectively.
                                                                                     The latency distributions under the studied schemes have
                                                                                  distinct centers and shapes as plotted in Fig. 11. Compared
                                                                                  to the baseline and predictive schemes, the distribution under
                                                                                  the ALL scheme has the narrowest shape in Fig. 11(a)–(c).
                                                                                  Referring to the CDFs in Fig. 11, the ALL scheme constrains
                                                                                  a higher proportion of packets with latency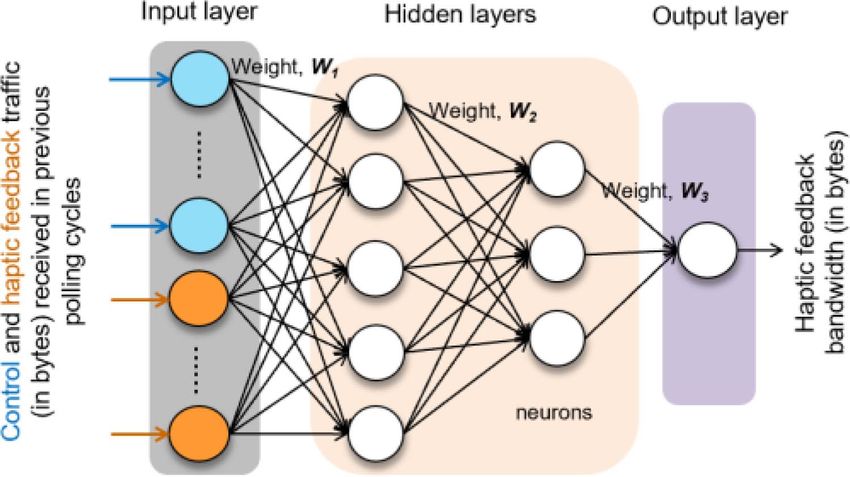
RUAN et al.: ACHIEVING LOW-LATENCY HUMAN-TO-MACHINE (H2M) APPLICATIONS: UNDERSTANDING OF H2M TRAFFIC                                                           635

report–grant process is the main latency cause in the baseline                     [19] P. Sarigiannidis, D. Pliatsios, T. Zygiridis, and N. Kantartzis, “DAMA:
scheme; 2) the predictive schemes reduce the latency for                                A data mining forecasting DBA scheme for XG-PONs,” in Proc. 5th Int.
                                                                                        Conf. Modern Circuits Syst. Technol. (MOCAST), May 2016, pp. 1–4.
H2M applications depending on bandwidth estimation meth-                           [20] Y. Wu, M. Tornatore, Y. Zhao, and B. Mukherjee, “Traffic classifica-
ods and network loads; and 3) the ALL scheme effectively                                tion and sifting to improve TDM-EPON fronthaul upstream efficiency,”
reduces latency for H2M applications compared to the existing                           J. Opt. Commun. Netw., vol. 10, no. 8, pp. 15–26, 2018.
                                                                                   [21] J. A. Hatem, A. R. Dhaini, and S. Elbassuoni, “Deep learning-based
schemes.                                                                                dynamic bandwidth allocation for future optical access networks,” IEEE
                                                                                        Access, vol. 7, pp. 97307–97318, 2019.
                                                                                   [22] L. Ruan, M. P. I. Dias, and E. Wong, “Machine learning-based band-
                     ACKNOWLEDGMENT                                                     width prediction for low-latency H2M applications,” IEEE Internet
                                                                                        Things J., vol. 6, no. 2, pp. 3743–3752, Apr. 2019.
   The authors would like to thank the anonymous reviewers                         [23] L. Ruan, M. P. I. Dias, M. Maier, and E. Wong, “Understanding the
and the Editor for their constructive feedback and suggestions                          traffic causality for low-latency human-to-machine applications,” IEEE
                                                                                        Netw. Lett., vol. 1, no. 3, pp. 128–113, Oct.–Dec. 2019.
that helped improve the quality of this article.                                   [24] A. M. Mikaeil, W. Hu, and S. B. Hussain, “Traffic-estimation-based low-
                                                                                        latency XGS-PON mobile front-haul for small-cell C-RAN based on an
                                                                                        adaptive learning neural network.” Appl. Sci., vol. 8, no. 7, p. 1097,
                               R EFERENCES                                              2018.
                                                                                   [25] C. Pacchierotti, S. Sinclair, M. Solazzi, A. Frisoli, V. Hayward, and
 [1] O. Holland et al., “The IEEE 1918.1 ‘tactile Internet’ standards working           D. Prattichizzo, “Wearable haptic systems for the fingertip and the hand:
     group and its standards,” Proc. IEEE, vol. 107, no. 2, pp. 256–279,                Taxonomy, review, and perspectives,” IEEE Trans. Haptics, vol. 10,
     Feb. 2019.                                                                         no. 4, pp. 580–600, Oct.–Dec. 2017.
 [2] G. P. Fettweis, “The tactile Internet: Applications and challenges,” IEEE     [26] H. Culbertson, S. B. Schorr, and A. M. Okamura, “Haptics: The present
     Veh. Technol. Mag., vol. 9, no. 1, pp. 64–70, Mar. 2014.                           and future of artificial touch sensation,” Annu. Rev. Control Robot.
 [3] ITU-T. (2014). The Tactile Internet. [Online]. Available: https://www.             Auton. Syst., vol. 1, pp. 385–409, Feb. 2018.
     itu.int/dms_pub/itu-t/opb/gen/T-GEN-TWATCH-2014–1-PDF-E.pdf%                  [27] J. Kammerl, I. Vittorias, V. Nitsch, E. Steinbach, and S. Hirche,
 [4] M. Dohler et al., “Internet of skills, where robotics meets AI, 5G                 “Perception-based data reduction for haptic force-feedback signals using
     and the tactile Internet,” in Proc. Eur. Conf. Netw. Commun. (EuCNC),              velocity-adaptive deadbands,” Presence, vol. 19, no. 5, pp. 450–462,
     Jun. 2017, pp. 1–5.                                                                2010.
 [5] M. Maier, M. Chowdhury, B. P. Rimal, and D. P. Van, “The tactile              [28] M. Condoluci, T. Mahmoodi, E. Steinbach, and M. Dohler, “Soft
     Internet: Vision, recent progress, and open challenges,” IEEE Commun.              resource reservation for low-delayed teleoperation over mobile
     Mag., vol. 54, no. 5, pp. 138–145, May 2016.                                       networks,” IEEE Access, vol. 5, pp. 10445–10455, 2017.
 [6] M. Chowdhury and M. Maier, “Local and nonlocal human-to-robot task            [29] K. S. Kim et al., “Ultrareliable and low-latency communication tech-
     allocation in fiber-wireless multi-robot networks,” IEEE Syst. J., vol. 12,        niques for tactile Internet services,” Proc. IEEE, vol. 107, no. 2,
     no. 3, pp. 2250–2260, Sep. 2018.                                                   pp. 376–393, Feb. 2019.
                                                                                   [30] D. Feng et al., “Toward ultrareliable low-latency communications:
 [7] M. Chowdhury and M. Maier, “Collaborative computing for advanced
                                                                                        Typical scenarios, possible solutions, and open issues,” IEEE Veh.
     tactile Internet human-to-robot (H2R) communications in integrated
                                                                                        Technol. Mag., vol. 14, no. 2, pp. 94–102, Jun. 2019.
     FiWi multirobot infrastructures,” IEEE Internet Things J., vol. 4, no. 6,
                                                                                   [31] Z. Hou, C. She, Y. Li, T. Q. S. Quek, and B. Vucetic, “Burstiness-aware
     pp. 2142–2158, Dec. 2017.                                                          bandwidth reservation for ultra-reliable and low-latency communica-
 [8] M. Chiang and T. Zhang, “Fog and IoT: An overview of research                      tions in tactile Internet,” IEEE J. Sel. Areas Commun., vol. 36, no. 11,
     opportunities,” IEEE Internet Things J., vol. 3, no. 6, pp. 854–864,               pp. 2401–2410, Nov. 2018.
     Dec. 2016.                                                                    [32] M. Maier and A. Ebrahimzadeh, “Towards immersive tactile Internet
 [9] T. Taleb, K. Samdanis, B. Mada, H. Flinck, S. Dutta, and D. Sabella,               experiences: Low-latency FiWi enhanced mobile networks with edge
     “Onmulti-access edge computing: A survey of the emerging 5G network                intelligence,” J. Opt. Commun. Netw., vol. 11, no. 4, pp. B10–B25, 2019.
     edge cloud architecture and orchestration,” IEEE Commun. Surveys              [33] CyberGlove Systems Inc. (2017). CyberGrasp. [Online]. Available:
     Tuts., vol. 19, no. 3, pp. 1657–1681, 3rd Quart., 2017.                            http://www.cyberglovesystems.com/cybergrasp/
[10] G. Kramer, Ethernet Passive Optical Networks. New York, NY, USA:              [34] T. T. T. Nguyen and G. Armitage, “A survey of techniques for Internet
     McGraw-Hill, 2005.                                                                 traffic classification using machine learning,” IEEE Commun. Surveys
[11] C. Chen, H. Wu, and K. Ke, “Predictive credit based dynamic bandwidth              Tuts., vol. 10, no. 4, pp. 56–76, 4th Quart., 2008.
     allocation mechanisms in Ethernet passive optical network,” in Proc.          [35] P. Assimakopoulos et al., “Statistical distribution of packet inter-arrival
     TENCON, 2006, pp. 1–4.                                                             rates in an Ethernet Fronthaul,” in Proc. IEEE ICC Workshops, 2016,
[12] M. P. I. Dias, B. S. Karunaratne, and E. Wong, “Bayesian estima-                   pp. 140–144.
     tion and prediction-based dynamic bandwidth allocation algorithm for          [36] C. Majumdar, M. Lopez-Benitez, and S. N. Merchant, “Accurate
     sleep/doze-mode passive optical networks,” J. Lightw. Technol., vol. 32,           modelling of IoT data traffic based on weighted sum of distributions,”
     no. 14, pp. 2560–2568, Jul. 2014.                                                  in Proc. IEEE Int. Conf. Commun. (ICC), May 2019, pp. 1–6.
[13] E. Wong, M. P. I. Dias, and L. Ruan, “Predictive resource allocation          [37] Y. Bengio, P. Lamblin, D. Popovici, and H. Larochelle, “Greedy layer-
     for tactile Internet capable passive optical LANs,” J. Lightw. Technol.,           wise training of deep networks,” in Proc. Adv. NIPS, 2007, pp. 153–160.
     vol. 35, no. 13, pp. 2629–2641, Jul. 1, 2017.                                 [38] W. H. Tranter et al., “On the self-similar nature of Ethernet traf-
[14] Z. M. Fadlullah, H. Nishiyama, N. Kato, H. Ujikawa, K.-I. Suzuki, and              fic (extended version),” in Proc. IEEE Commun. Netw. Res., 2007,
     N. Yoshimoto, “Smart FiWi networks: Challenges and solutions for QoS               pp. 517–531.
     and green communications,” IEEE Intell. Syst., vol. 28, no. 2, pp. 86–91,     [39] R. Fontugne et al., “Scaling in Internet traffic: A 14 year and 3 day
                                                                                        longitudinal study, with multiscale analyses and random projections,”
     Mar./Apr. 2013.
                                                                                        IEEE/ACM Trans. Netw., vol. 25, no. 4, pp. 2152–2165, Aug. 2017.
[15] Y. Luo and N. Ansari, “Limited sharing with traffic prediction for
                                                                                   [40] P. Cortez, M. Rio, M. Rocha, and P. Sousa, “Multi-scale Internet traffic
     dynamic bandwidth allocation and QoS provisioning over EPONs,”                     forecasting using neural networks and time series methods,” Expert Syst.,
     J. Opt. Netw., vol. 4, pp. 561–572, Aug. 2005.                                     vol. 29, no. 2, pp. 143–155, 2012.
[16] H. Wang et al., “LP-DWBA: A DWBA algorithm based on linear                    [41] W. Wang et al., “A network traffic flow prediction with deep learning
     prediction in TWDM-PON,” in Proc. 14th Int. Conf. Opt. Commun.                     approach for large-scale metropolitan area network,” in Proc. IEEE/IFIP
     Netw. (ICOCN), Nanjing, China, 2015, pp. 1–3.                                      Netw. Oper. Manag. Symp. (NOMS), 2018, pp. 1–9.
[17] K. Nishimoto et al., “Predictive dynamic bandwidth allocation based on        [42] A. M. Mikaeil, W. Hu, and S. B. Hussain, “A low-latency traffic esti-
     the correlation of the bi-directional traffic for cloud-based virtual PON-         mation based TDM-PON mobile front-haul for small cell cloud-RAN
     OLT,” in Proc. Int. Workshop Techn. Committee Commun. Qual. Rel.,                  employing feed-forward artificial neural network,” in Proc. Int. Conf.
     2017, pp. 1–6.                                                                     Transp. Opt. Netw., 2018, pp. 1–4.
[18] N. Hanaya, Y. Nakayama, M. Yoshino, K.-I. Suzuki, and R. Kubo,                [43] L. Ruan, M. P. I. Dias, and E. Wong, “Enhancing latency performance
     “Remotely controlled XG-PON DBA with linear prediction for flexi-                  through intelligent bandwidth allocation decisions: A survey and com-
     ble access system architecture,” in Proc. Opt. Fiber Commun. Conf.,                parative study of machine learning techniques,” IEEE/OSA J. Opt.
     2018, pp. 1–3.                                                                     Commun. Netw., vol. 12, no. 4, pp. B20–B32, Apr. 2020.

        Authorized licensed use limited to: University of Melbourne. Downloaded on January 04,2021 at 02:28:19 UTC from IEEE Xplore. Restrictions apply.
You can also read