Acid Mine Drainage and its Governance - in the Gauteng City-Region - Researched and written for the GCRO by Kerry Bobbins
←
→
Page content transcription
If your browser does not render page correctly, please read the page content below
10
                              Acid Mine Drainage
       S I O N A L P A P ER

                              and its Governance
                              in the Gauteng City-Region
 OCC A

                                         Researched and written
                                         for the GCRO by
                                         Kerry Bobbins

                                         May 2015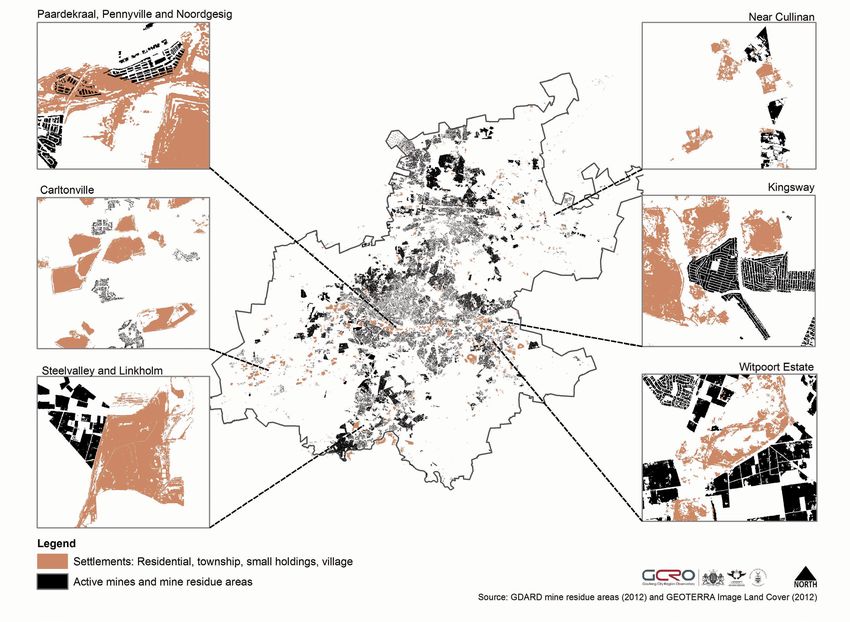
ISBN Number: 978-0-620-65778-5
S I O N A L P A P ER
                             Acid Mine Drainage
                             and its Governance
                             in the Gauteng City-Region
OCC A

                                        Researched and written
                                        for the GCRO by
                                        Kerry Bobbins

                                        May 2015
List of Acronyms
        AECOM      AECOMSM
        AMD        Acid Mine Drainage
        BKS        BKS Group (Pty) Ltd
        CB         Central Basin
        CBD        Central Business District
        CBEC       Central Basin Environmental Corporation
        CGS        Council for Geo-science
        CME        Compliance and Monitoring Enforcement
        CRG        Central Rand Gold
        CSIR       Council for Scientific and Industrial Research
        DBSA       Development Bank of South Africa
        DEA        Department of Environmental Affairs
        DMR        Department of Mineral Resources
        DNT        Department of National Treasury
        DWA        Department of Water Affairs
        DWAF       Department of Water Affairs and Forestry
        DWE        Digby Wells Environmental
        DWS        Department of Water and Sanitation
        EB         Eastern Basin
        EBEC       Eastern Basin Environmental Corporation
        ECL        Environmental Critical Level
        EIA        Environmental Impact Assessment
        ERPM/ERM   East Rand Proprietary Mines
        FSE        Federation for a Sustainable Environment
        GCIS       Government Communication and Information System
        GCR        Gauteng City-Region
        GCRO       Gauteng City-Region Observatory
        GDACE      Gauteng Department of Agriculture, Environment and Conservation
        GDARD      Gauteng Department of Agriculture and Rural Development
        HDS        High Density Sludge
        I&AP       Interested and affected party
        IDC        Industrial Development Corporation
        IMC        Inter-Ministerial Committee
        LHWP       Lesotho Highlands Water Project
        MPRDA      Mineral and Petroleum Resources Development Act 28 of 2002
        MRA        Mine residue area
        MRI        Mine Restoration Investments
        MTEF       Medium Term Expenditure Framework
        NASA       National Aeronautics and Space Administration
        NEMA       National Environmental Management Act 107 of 1998
        NGOs       Non-Governmental Organisations
        O&M        Operations and maintenance
        PAIA       Promotion of Access to Information Act
        PMG        Parliamentary Monitoring Group
        PPP        Public Private Partnership
        QoL        Quality of Life survey
        RU         Rand Uranium
        SA         South Africa
        SALGA      South African Local Government Association
        TCTA       Trans-Caledon Tunnel Authority
        ToE        Team of Experts
        VRS        Vaal River System
        WB         Western Basin
        WBEC       Western Basin Environmental Corporation
        WUC        Western Utilities Corporation
        WWF        World Wildlife Fund

iv
Contents

LIST OF ACRONYMS                                                                    IV
1. INTRODUCTION                                                                      1
  1.1 The acid mine drainage issue                                                   1
  1.2 Aims and structure of the report                                               3
2. FROM GOLD TO YELLOW: A BRIEF HISTORY OF GOLD MINING AND AMD ON
   THE WITWATERSRAND                                                                 5
  2.1 Overview of mining activities in the GCR                                       5
  2.2 Gold and water                                                                 7
  2.3 A legacy of externalizing costs                                                9
  2.4 Negative impacts on the environment, society and economy                      12
3. ACTION TAKEN IN RESPONSE TO AMD                                                  19
  3.1 A timeline of key events                                                      19
  3.2 Project Eutopia                                                               19
  3.3 Preparatory work by an Inter-Ministerial Committee and Team of Experts        22
  3.4 Towards action: detailed planning by the Trans-Caledon Tunnel Authority (TCTA) 25
  3.5 Environmental Impact Assessment (EIA): initial work done and exemption        30
  3.6 Implementation of immediate and short-term interventions                      33
  3.7 Towards a long-term solution                                                  34
  3.8 ‘Paying for the sins of big business’ – funding mechanisms to mitigate AMD    38
4. A REVIEW OF AMD DISCOURSE                                                        42
  4.1 Stakeholder interactions                                                      42
  4.2 Framing an environmental catastrophe                                          47
  4.3 Precedent-setting                                                             49
  4.4 What exactly is Gauteng’s water crisis?                                       50
  4.5 Financial Concerns                                                            51
  4.6 Opportunities                                                                 53
5. CONCLUSION                                                                       56
6. REFERENCES                                                                       59

                                                                                          v
GCRO OCCASIONAL PAPER       10

     List of Figures
       Figure 2.1: Gold production and gold grades along the Witwatersrand
                   (all data sourced from Chamber of Mines, 2013).                          6
       Figure 2.2: An illustration of the imbalance between money spent on developmental
                   and operational costs, and environmental and social remediation costs
                   (information adapted from Adler et al., 2007).                           9
       Figure 2.3: The externalization of cost by the gold mining industry (redrawn from
                   Alder et al., 2007).                                                    10
       Figure 2.4: South Africa’s legislative framework for mine closure
                   (DMR, 2010a and Kruger, 2011)                                           11
       Figure 2.5: Water bodies in the GCR and their proximity to radioactive
                   mining waste.                                                           15
       Figure 2.6: Human settlement and mine footprints in the GCR
                   (data source: GTI 2009 and 2012).                                       16
       Figure 3.1: Timeline of key events and the development of solutions to address
                   AMD in the GCR.                                                         20
       Figure 3.2: Overview of the Western, Central and Eastern Basins of the Witwatersrand
                   Gold Fields (DWA, 2012a). The Western Basin is located in the
                   Krugersdorp, Witpoortjie and Randfontein areas; the Central Basin is
                   located between Durban Roodepoort Deep (DRD) in the west and East
                   Rand Proprietary Mines (ERPM) in the east; and the Eastern Basin is
                   located in the Boksburg, Brakpan, Springs and Nigel areas.               21
       Figure 3.3: Overview of the budget for addressing AMD in National
                   Treasury’s 2011 MTEF (PMG, 2011a)                                       41
       Figure 4.1: Diagrammatic representation of key actors in AMD discourse              43

vi
MAY
                        ACID MINE DRAINAGE AND ITS GOVERNANCE IN THE GAUTENG CITY-REGION
                                                                                           2015

List of Tables
  Table 2.1: Major water development schemes to date (Rand Water, 2004).                          8
  Table 3.1: Overview of mining companies participating in the establishment of
             three environmental corporations (Schoeman, 2011).                                   21
  Table 3.2: Environmental Critical Levels (ECL) calculated by the ToE and
             overview of the Short Term Action Plan (DWA, 2010)                                   24
  Table 3.3: Summary of capital costs to maintain water levels (DWA, 2010).                       24
  Table 3.4: Summary of annual operating costs assuming an electricity price of
             R1,50 per kW/h (DWA, 2010).                                                          25
  Table 3.5: Task schedule for the immediate and short-term intervention to AMD
             (information from AECOM, 2011).                                                      26
  Table 3.6: AECOM Environmental Critical Levels (ECLs) calculated for the
             Western, Central and Eastern Basins in the Witwatersrand and
             immediate and short-term action plan (AECOM, 2011 and
             DWE, 2012b).                                                                         27
  Table 3.7: Summary of capital costs outlined in the AECOM due diligence report
             (AECOM, 2011).                                                                       29
  Table 3.8: Summary of operational costs outlined in the AECOM due diligence
             report (AECOM, 2011).                                                                29
  Table 3.9: Aspects to be covered in the EIA and overview of potential impacts
             and risks to humans and the environment (DWE, 2012d).                                32
  Table 3.10: Overview of contributions made by mining companies in response to
              the directive issued by DWA to manage AMD and assume liabilities
              related to active mining (PMG, 2011b).                                              38
  Table 3.11: Overview of the capital components of the Vaal River System
              presented on 22 October 2014 (Rand Water, 2014).                                    41

                                                                                                       vii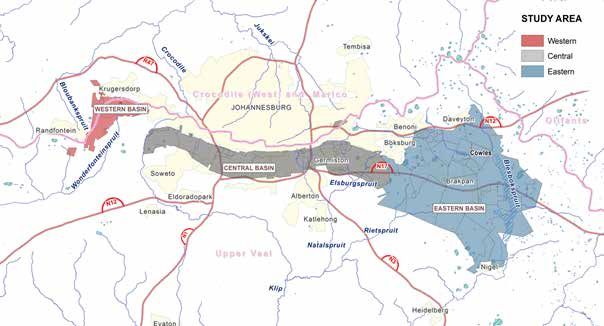
GCRO OCCASIONAL PAPER           10

       Acknowledgments
       This Occasional Paper would have not been possible without the valuable inputs of various individuals
       from government, academia, business, labour, civil society and the general public. As part of the
       preliminary research undertaken for this paper, a call was sent to specific stakeholders to discuss and
       verify facts to be used in this report. The vision of creating an accurate and reflective body of work became
       a reality only because many responded positively. In particular I would like to thank the following:

       •   Consultants AECOM (formerly BKS), Digby Wells Environmental (DWE) and Fourth Element;

       •   The parastatal Trans-Caledon Tunnel Authority (TCTA);

       •   Non-governmental organisations (NGOs) and institutions, Earthlife Africa and the South African Human
           Rights Commission;

       •   Mining and reclamation company Mintails SA, and in particular Anthony Turton;

       •   Academics Mike Muller and Mark Biggars;

       •   Various ward councillors;

       •   Speakers and participants at various AMD-related workshops, seminars and public engagements
           between July 2012 and June 2013.

       Thank you to Graeme Gotz, GCRO, for editing the work.

viii
MAY
                             ACID MINE DRAINAGE AND ITS GOVERNANCE IN THE GAUTENG CITY-REGION
                                                                                                2015

1. Introduction

1.1    The acid mine drainage issue

Introduction
Acid mine drainage (AMD) in the Gauteng City-Region (GCR) has been described in the media as a
ticking time bomb after it was officially reported to have begun surfacing from old mining works on the
West Rand in 2002 (Masondo et al., 2011; TAU SA, 2011; Slack, 2013). Acid mine drainage occurs when
‘fool’s gold’ (FeS2) or iron pyrite found in mined rock oxidises. This occurs when either underground
mine shafts, or crushed conglomerate in Mine Residue Areas (MRAs) on the surface, become exposed
to oxygen and water creating run-off that is very high in sulphates – effectively sulphuric acid – and
is hazardous to both humans and the environment (McCarthy 2010). Over the last decade, a flurry of
news articles have highlighted the threat of acid water decant and its likely effects on human health,
the environment, water quality, municipal infrastructure and building foundations in the Johannesburg
Central Business District (CBD). These reports have fuelled anxieties around when and where decant will
take place and who will be affected by AMD.

In response to these concerns, government, through the National Department of Water Affairs (DWA),
has introduced a set of immediate and short-term interventions to overcome decant in the West Rand.
These have allowed AMD to be framed as an environmental emergency. DWA has also set in motion
a process to develop a long-term solution that, through a broader and more inclusive approach, will
solve various AMD issues over time including its impact on the Gauteng water supply.

In relation to both these two government interventions – the immediate/short and long-term solutions
– very few stakeholders or members of the public know enough about AMD and its governance to
understand what the real challenges are and how they should respond. Even fewer are able to piece
together the series of events that led up to the current and proposed set of actions taken by DWA to
tackle AMD. This paper argues that the current trajectory of government-led responses has suspended
meaningful public engagement and debate, and the result is a grey cloud of misinterpreted facts and
presumed motives that has cast a shadow of misunderstanding, which in turn exacerbates the anxieties
of affected communities and interested stakeholder groups.

A brief background to AMD on the Witwatersrand
AMD is not a new phenomenon, nor is it exclusive to the GCR. It is found internationally in Australia,
Canada, the United States of America and Germany. Locally (aside from along the Witwatersrand Gold
Fields) it is seen in the Klerksdorp, Orkney, Stilfontein, Hartebeespoort and Evander gold mining areas,
in other parts of the Free State, Mpumalanga and KwaZulu-Natal, as well as in the O’Kiep copper district
(DWA, 2010).

While AMD is neither a new phenomenon, nor unique to the GCR, it presents itself as being particularly
problematic along the Witwatersrand goldfields as a result of a combination of factors. These include the
inter-connectivity of the mine voids, the sheer scale of the gold mining operations along the rand, the
proximity of mines in relation to one another, and the fact that they are close to urban areas (DWA, 2010).
                                                                                                              1
GCRO OCCASIONAL PAPER 10
McCarthy (2010) also notes that the region’s geomorphology, its climate, and the distribution of AMD-
generating deposits further exacerbates the occurrence of AMD in this area.
When mining on the Witwatersrand first started the diggings were close to the surface, but as the mines
expanded, excavations went deeper and intercepted the water table. From the 1930s, pumps were
required to draw down groundwater in sunken shafts to expose new sites for deeper-level mining. Over
time, a series of technological advances overcame physical constraints to the extraction of gold from
deeper and deeper below the surface, extending the life of the mines. It was in the best interests of the
mines to draw down water to expose new sites for mining, but this also exposed water to pyrite and
heavy metals in the mine shafts (Leyds, 1964).
A decline in mining profits from the 1950s, resulting from a myriad of economic, societal and environmental
constraints, led to the closure of many mines in the GCR. Mine closures meant that the pumping of water
from the mine voids ceased (McCarthy, 2010). Water started accumulating in the underground mine
workings after mines closed and also began flowing into adjacent mines. Due to the interconnected
nature of the so-called Western, Central and Eastern Basins that make up the goldfields, the pumping
load diffused across the Witwatersrand. Active mines took up the pumping responsibility of redundant
mines, raising their costs, and contributing in turn to their closure. As more and more mines closed, and
more pumping ceased, AMD began rising to the surface at an even faster rate.
Some environmental texts report that the decant of AMD had been occurring from as early as 1996
(Khumalo, 2011), but it was not until 2002 that government first recognised that this was a pressing issue
in the GCR. Reports suggest that the immediate AMD crisis began with a flood event that occurred in the
West Rand of Gauteng in 2002, when acid water from the Western Basin (WB) started decanting on the
surface (Khumalo, 2011).
In 2008, East Rand Propriety Mines (ERPM), one of the few mines still operating, ceased pumping and
underground mine workings and pump stations rapidly became inundated with water as the mine voids
began to fill (McCarthy, 2010). This escalated concerns over AMD to crisis proportions.
In 2011, water was still decanting in the West Rand and the threat of decant began growing in the Central
Basin (CB) and Eastern Basin (EB). To address the crisis, the state-owned Trans-Caledon Tunnel Authority
(TCTA) was instructed to deliver an immediate to short-term solution at a total cost of some R2,2 billion.
In late 2012, an immediate-term pumping intervention to control decant on the WB was commissioned,
and fast-tracked steps to control water in the CB were initiated. On 9 May 2014, the newly constructed
R319 million plant near Germiston in the CB was tested and the pumping, treatment and release of pre-
treated AMD at this plant reached full capacity on 30 May 2014 (DWA, 2014). As of late 2014, at the time
of this report’s finalisation, works for the EB were still in the process of being planned.
AMD as both a technical and a governance problem
This Occasional Paper starts from the premise that the threat of acid water decanting from old mine
workings is a present danger that will impact our environment, built infrastructure, health and ultimately
the economy if not managed properly (McCarthy, 2010). There is some disagreement, discussed in this
report, as to the degree of the threat with some arguing in particular that there is little risk of AMD
flooding into, and causing chemical corrosion of, building basements and municipal infrastructure.
2MAY
ACID MINE DRAINAGE AND ITS GOVERNANCE IN THE GAUTENG CITY-REGION
2015
That being said, there is ample evidence that suggests when AMD rises to the surface and enters
watercourses, it is harmful to aquatic life and is dangerous to anyone reliant on this water for agriculture
or household use. It has also become clear that emergency measures to pump and partially treat AMD
that discharges into river systems, notably the Vaal, which has a very high salt content, may result in the
water quality of Gauteng’s water supply being compromised. Unless long-term desalination solutions
are found, there is an increasing need for more raw water to be released from the Vaal Dam to dilute
streams into which AMD has been discharged. In turn this will upset finely-tuned water balances as far
away as the Orange River System, and raise the risk of water shortages and / or dramatic cost increases
in the GCR. A consultant’s report, introducing a set of studies towards a long-term AMD solution, puts
it bluntly:
“Should the AMD issue, and specifically the desalination, not be addressed appropriately by 2014/15,
the acceptable levels of assurance of water supply will be threatened. This means there will be an
increasing risk of water restrictions in the Vaal River Water Supply area.” DWA (2012a:2).
The distribution of old mine workings and the widespread contamination of water and ecosystems as a
result of AMD makes this a city-region wide problem with far-reaching impacts. It is of great importance
that government, business, academics, civil society and the general public increase their awareness
around AMD, and the risks and opportunities associated with it, and then work together to take the
necessary precautions towards mitigating its impacts in the GCR. The question is whether this has been
adequately enabled by government leadership on the matter.
Over the last few years there has indeed been a flurry of activity to develop shorter- and longer-term
solutions to AMD. However, some believe that these interventions are too little too late to solve a problem
that manifested over a decade ago. Many texts report that AMD is a fairly simple problem to solve
technically, but there is also a sense that the slow response of government – framed by a muddle of
politics, sheer cost and liability blame game – has meant that governance challenges have unnecessarily
exacerbated public anxieties, and has extended the risks of AMD to society and the environment.
1.2 Aims and structure of the report
Aims of the report
This paper straddles Gauteng City-Region Observatory’s (GCRO) current research focus on sustainability
and matters of government, governance and intergovernmental relations. It serves as a follow up to
the first edition of GCRO’s Provocation Series written by Professor Terence McCarthy of the University
of the Witwatersrand School of Geosciences. This Provocation was entitled, The decanting of acid mine
water in the Gauteng City-Region, and was released in September 2010. McCarthy’s Provocation built the
necessary foundations for this report by clarifying the facts behind the issue of acid water from a mining
perspective and suggested recommendations for action in light of conflicting news reports. McCarthy
provided recommendations that are relatively straightforward – establish pumping stations to pump
water into treatment plants and stabilise water levels in the mine voids (McCarthy, 2010). However, his
Provocation also drew out key issues in the discourse around AMD that still appear to haunt current
actions and interventions to mitigate the problem. He asked: who will be held liable for costs incurred
over decades of mining? And how will gaps between the deeds and responsibilities of government play
out in the years to come?
3GCRO OCCASIONAL PAPER 10
Following on from McCarthy’s 2010 Provocation, this paper builds on the technical analysis of AMD,
but more importantly investigates the governance of AMD over time. It updates the historical record by
providing an objective overview of key events and actions taken in response to AMD. It hopes to spark
further argument and debate by presenting factual information to clarify grey areas arising from some
alarmist news articles that have surfaced over the last few years (McCarthy, 2010). It also provides critical
reviews of some of the public discourse around AMD and its management to date, in an attempt to
understand how AMD is a governance challenge in addition to being merely a technical problem.
This said, this report does not attempt to provide recommendations on technical and finance measures
for addressing AMD, and which actors should take on the responsibilities and risks associated with
mitigating AMD. The report also does not aim to place blame on particular actors, and rather presents
AMD discourse in terms of the actors that have shaped it over time.
Structure of the report
This report proceeds through the following structure. Chapter 2 provides a brief historical overview of
gold mining and AMD in the GCR, focusing on the mining industry’s approach to externalising costs
in relation to labour and the environment. This chapter lays the foundation for the overview of actions
taken in response to the threat of AMD decant.
Chapter 3 explores the actions taken over the last few years to mitigate AMD. Key steps taken are
presented with the aid of a timeline, compiled through information from interviews with key players
and an analysis of media articles and official reports. With the timeline providing a synthetic overview,
the bulk of chapter 3 pieces together a narrative of the unfolding immediate/short-term and long-term
interventions to address AMD. The chapter ends with an overview of funding mechanisms – including
public sector budgets and private sector contributions – to mitigate AMD.
Chapter 4 provides a critical review of public discourse around AMD, and the recent attempts to
manage it. It examines: interactions and communications between key stakeholders (also presented
visually through a stakeholder diagram); debates around the economic, social and environmental risks
associated with both AMD itself, and the attempts to deal with it; how AMD is nestled within a wider
set of environmental concerns and debates, in particular over MRAs and the security of South Africa’s
water supply; and debates around the opportunities presented by an integrated approach to AMD
interventions.
Chapter 5 draws together key ideas and content covered in the report and presents on the future
considerations of AMD and MRAs, focusing in particular on the wider legacy of mine waste in the GCR.
4MAY
ACID MINE DRAINAGE AND ITS GOVERNANCE IN THE GAUTENG CITY-REGION
2015
2. From gold to yellow: a brief
history of gold mining and AMD
on the Witwatersrand
“The lust for gold spans all eras, races, and nationalities. To possess any amount of gold seems to ignite
an insatiable desire to obtain more.” (Drye, n.d.)
2.1 Overview of mining activities in the GCR
South Africa is a country well-endowed with mineral resources – in particular gold – that have created
large revenues for individuals, companies, and the nation through government taxation (McCarthy, 2010;
McCarthy, 2011).
South African gold deposits are the largest known repository of gold on earth, and gold mines also yield
uranium, silver, pyrite and osmiridium (GDACE, 2008). Although gold deposits in the interior of South
Africa were mined for centuries by indigenous peoples before European colonisation, the first discovery
of gold by settlers in the Transvaal was made in the 1850s. In 1854, small quantities of gold dust were
found in the Jukskei River, which led to the exploration for gold in the Witwatersrand area and across
the Transvaal (Beavon, 2004). Gold deposits were discovered between 1871 and 1886 at Eersteling (south
of Polokwane), Pilgrim’s Rest, Sabie, Kaapsehoop, Barberton, Leydsdorp, near Malmani, Kromdraai and
Wilgespruit.
Johannesburg became a centre of gold mining after the discovery of gold at Langlaagte Farm in mid-
1886, and the area was declared a public diggings site in September of the same year. Gold was first
found along the Witwatersrand conglomerate reefs, and further gold-bearing reefs discovered from
Roodepoort in the west to Germiston in the east (McCarthy, 2010). The economic engine of Johannesburg
was engaged (Beavon, 2004 and Kaplan, 1985). Johannesburg soon became known as the ‘City of Gold’,
and gold mining became the foundation of the South African economy.
Over a century of mining has lapsed since the discovery of gold along the Witwatersrand. It is estimated
that over 47 000 tonnes of gold was produced from 1886 to 2002. Of course, the annual volume of gold
production along the Witwatersrand has fluctuated with world events, inconsistent gold grades at various
depths, and unavoidable physical constraints (Figure 2.1). External factors, such as the availability of
labour, water and electricity, also shaped how much the mining industry was able to produce and at what
cost. Global financial arrangements over the years – notably the abandonment of the gold standard in
the 1930s, and the official delinking of the dollar from gold in the 1970s – have also impacted the price of
gold, and in turn the profitability of the industry.
Figure 2.1 gives an indication of these fluctuations. Gold production increased rapidly until the formation
of the Union of South Africa in 1910 with a brief disturbance over the course of the 1899-1902 Boer War
(Hartnady, 2009). Production also saw periodic declines due to the First World War, in 1922 after the Rand
5GCRO OCCASIONAL PAPER 10
Rebellion, and after 1945 due to the Second World War (1939-1945) (Hartnady, 2009). Gold production after
1951 showed a considerable growth phase until 1965. This was due to technological developments that
were laid during the 1930s and 1940s, with the intensive exploration of deep extensions of the rand. After
1966, gold production continued at a slower rate, reaching an absolute production peak in 1970. After
1970, there has been a steady decline in production interrupted by occasional short reversals in the trend,
for example, over the 1982-1984 period. Oscillations aside, the production curve has closely mirrored
changes in the gold grade, which improved as mining went to greater depths through technological
advances until its peak in the late 1960s.
Figure 2.1: Gold production and gold grades along the Witwatersrand (all data sourced from
Chamber of Mines, 2013).
1970
120 0000 16
14
Gold produced per year (kg)
100 0000
12
80 0000
10
Gold grade
60 0000 8
6
40 0000
4
20 0000
2
0 0
1884
1891
1898
1905
1912
1919
1926
1933
1940
1947
1954
1961
1968
1975
1982
1989
1996
2003
2010
Year
SA gold output over time Average gold production grade
Mining, in what is now known as the GCR, transformed the then Zuid Afrikaanse Republiek (ZAR)
from a weak subsistance economy to a thriving exchange economy. Between 1886 and 1930 much of the
dividends however were exported to foreign countries. Very little of the returns from gold mining were
available for investment in South Africa and very little was contributed to the reserves of the state (Leyds,
1964). That said, the mines did draw large amounts of capital into South Africa, largely from investors
from Britain.
Mining has brought about many positive impacts for South Africa through the growth and development
of various linked industries and transport routes, in turn, anchoring many towns and cities. After gold
was discovered, the Witwatersrand became the largest urban centre in South Africa virtually overnight.
By 1900, it had reached a total population of 166 000 (Pampallis, 1991). Towns such as Heidelberg, Springs,
Brakpan, Benoni, Boksburg, Germiston, Roodepoort, Krugersdorp and Randfontein began to develop
along the East and West Rand. Coal deposits on the East Rand and settlements close to the gold diggings
further stimulated the development of towns in this part of the Witwatersrand (Pampallis, 1991).
6MAY
ACID MINE DRAINAGE AND ITS GOVERNANCE IN THE GAUTENG CITY-REGION
2015
As mining in the interior of South Africa expanded, ports along the coast also grew rapidly to cope with
the increase of goods and people moving in and out of the country (Pampallis, 1991). Fast developing
Johannesburg saw South Africa’s early railway network extended, with new lines linking the mining
settlements to Cape Town, Port Elizabeth, East London, Durban and Maputo. Links were also made into
surrounding agricultural areas, which in turn fostered the growth of commercial farming operations
focused on maize, wheat, sugar, meat and other foodstuffs to meet the demands of new urban centres
(Pampallis, 1991). Johannesburg was also connected to other towns through new roads and telegraph
and telephone networks (Pampallis, 1991).
It is calculated that the Witwatersrand basins still hold some 36 000 tonnes of gold, or 45.7% of all
remaining gold resources in the world (GDACE, 2008). The amount of gold that can be extracted viably
depends on the price of gold, cost of labour and technological capabilities (GDACE, 2008). At present,
new mining projects are being developed and some derelict mines have been reopened to reprocess old
waste deposits. Dump reclamation through the reprocessing of mine tailings can be a payable operation,
especially on slime dumps at old gold mines where older and more inefficient technologies where
previously unable to extract smaller fragments of gold (GDACE, 2008). That said, there is no disputing
that the gold mining industry on the Witwatersrand has reached its twilight years, and South Africa is
now having to confront the negative impacts of mining on the environment and society, long ignored in
the years of easy profits (McCarthy, 2011).
2.2 Gold and water
As Keith Beavon suggests, the location of Johannesburg, and the wider city-region around it, had
everything to do with the discovery of gold in the area (Beavon, 2004). Other factors, including the
availability of natural resources that would normally be a consideration in the position and growth of
any large settlement, were always secondary. Indeed, the poor resource provisions of the area in which
Johannesburg was established has been a constant constraint, plaguing both the mining operations and
the fast-growing commercial and residential forms around the diggings since their beginning. It was
originally expected, as with so many other gold-rush towns, Johannesburg would be no more than a
temporary mining camp, and so very little was initially invested in appropriate urban infrastructure.
As the urban centre began to grow and made the transformation from a mining camp to a city and
metropolis (Beavon, 2004), increasing focus was placed on the required infrastructure development and
the spatial planning needed to facilitate this.
Water and gold entwined
The quality and quantity of available water has afflicted gold mining on the Witwatersrand from its
earliest days (Leyds, 1964 and Adler et al., 2007). There is an intrinsic link between the excavation of
gold and the use of water, which became stronger as mining went to deeper levels. The development of
Johannesburg can therefore be said to be written in water due to this inherent link between water and
gold mining (Leyds, 1964).
The settlers who first established farms along the Witwatersrand did so alongside the few streams,
springs and wetlands in the area, which provided an accessible, but finite, fresh water supply for farm
and household use (Leyds, 1964 and Beavon, 2004). These water resources were neither sustainable nor
adequate for the development of the mining industry in Johannesburg.
7GCRO OCCASIONAL PAPER 10
When gold was first discovered in Johannesburg in 1886, water was drawn from the Fordsburgspruit,
the Natalspruit located on the eastern end of Commissioner Street, and a spring on the Parktown ridge
located around the present-day Johannesburg General Hospital (Rand Water, 2013). From 1887 onwards,
the growing demand for water saw the establishment of a number of small water companies such as
the Braamfontein Water Company and the Vierfontein Syndicate (Rand Water, 2004). It was already
evident at this time that water was essential to keep mines open, both because it was needed by the
mines themselves and because of the growing population on the diggings. The first major private water
company was the Johannesburg Waterworks Estate and Exploration Co. Ltd, which began building
water infrastructure such as dams, gravity-fed reservoirs and pipes (Leyds, 1964, Rand Water, 2004).
The Johannesburg Waterworks Company tapped into a more sustainable underground water resource
at Zuurbekom farm, and pumps were installed to extract approximately half a million gallons per day
(Leyds, 1964).
Institutional and infrastructural developments to guarantee supply
After 1902, the British realised that it was important to ensure the Witwatersrand’s long-term water
supply, and made provisions to establish the Rand Water Board (Rand Water, 2004). The Board began
to take over companies that were supplying, or capable of supplying, water to the Witwatersrand and
assumed the role of providing bulk water to different water users.
Increased water demand from a growing population and economic base has been identified as the
largest challenge of the Rand Water Board (Rand Water, 2004). To date, the board has implemented and
participated in a number of major development schemes to keep up with the growing water demands of
the GCR. These are highlighted in the table below (Table 2.1).
Table 2.1: Major water development schemes to date (Rand Water, 2004).
Date Water scheme
1914 - 1924 The Vaal River scheme including the Barrage
Vereeniging Pumping Station
Zwartkopjes Pumping Station
1924 Vaal Dam – 1938 – 354 Ml/d
1949 Zuikerbosch Pumping Station
1998 Lesotho Highlands Water Project
Rand Water currently sources bulk water from the Vaal Dam and the Vaal River barrage. Water is
pumped to water treatment plants where it is purified until fit for human consumption (Rand Water,
2013). The Vaal Dam is linked to other catchments through water transfer schemes such as the Lesotho
Highlands Water Project (LHWP). At present, a total of 92% of the water supplied by Rand Water is
piped to municipalities and conveyed to domestic, industrial, commercial and other water users and the
remaining 8% is supplied directly to mines (Rand Water, 2013).
The Vaal catchment is unique in that it not only supports a large number of water users but also lies in
the path of diffuse water pollution from a large number of gold and coal mines as well as return flows
from domestic, industrial and agricultural users (DWAF, 2005). Water quality in the Vaal River System
(VRS) has become significantly compromised through the degradation and pollution of the Vaal’s main
tributaries, in no small part due to mining in the region (Wepener et al., 2011).
8MAY
ACID MINE DRAINAGE AND ITS GOVERNANCE IN THE GAUTENG CITY-REGION
2015
2.3 A legacy of externalizing costs
Cost externalisation
Though the mining industry has made a significant contribution to the economic development of the
GCR, and South Africa more generally, mines often used irresponsible mining methods with little regard
for society and the environment (Swart, 2003). Short- and long-term environmental costs associated
with mining have historically been deflected from the balance sheets of mining companies (as depicted
in Figure 2.2). These environmental remediation costs, not counted as part of mines’ direct production
expenses, have compound over time, and typically peak after mines have closed and become derelict
and ownerless. Historically, the policies of both the mining industry and government, including
apartheid, helped to artificially suppress the costs of labour. In the early years of the Witwatersrand,
mining companies found assistance from the Boer and British governments in forcing rural Africans into
migrant labour arrangements, guaranteeing a supply of cheap labour (Pampallis, 1991). Under apartheid,
the migrant labour system was preserved by forcibly removing millions of Africans to Bantustans and
homelands, which externalised labour’s social-reproduction costs to other parts of the country. The region
has inherited this legacy of systematic externalisation of costs in the form of significant environmental
and social challenges.
Adler et al. (2007) provide a useful diagrammatic representation of the life of a mine, depicting the
externalisation of costs by mines over the long term. Short-term mining costs associated with the
prospecting of land, sinking of mine shafts, pumping of underground water and building of processing
facilities outweighs the long-term costs of environmental compliance and rehabilitation (Figure 2.2 and
Figure 2.3). The developmental and operational costs peak early in the life of a mine and reduce rapidly
(Figure 2.3). Revenues climb quickly as the development and operational cost curve falls off, making
for large profits over the mine’s life-span. The environmental remediation and social costs are delayed
into the future, and profits are only affected when these begin to climb much later in the life of the mine
(Figure 2.3).
Figure 2.2: An illustration of the imbalance between money spent on developmental and
operational costs, and environmental and social remediation costs
(information adapted from Adler et al., 2007).
n
itatio
ecting e r e habil l lega
cy
Prosp shafts Min n d socia
mine n a
Si n k i n g Huma
ing
Pump s
ng cilitie
Cooli a t m ent fa o ns
r tr e ulat i
Wate e n t al reg
nm
Enviro
9GCRO OCCASIONAL PAPER 10
Figure 2.3: The externalization of cost by the gold mining industry (redrawn from Alder et al., 2007).
Revenue Curve Environmental and Social
Development and Remediation Curve
operational cost
curve
Value ($)
Mine
Profit
T1
Time
Poor regulation
To address the worst excesses of cost externalisation, the South African government has, over time,
introduced various regulatory measures. The first attempt at regulating the mining industry was made in
1903 under the Transvaal Mining Law, but this only dealt with occupational safety issues (DMR, 2010a).
Between 1932 and 1951, mining was governed by the Mines, Works and Machinery Regulations Act. In
1956, this was extended to include the Mines and Works Act, promulgated to ensure the rehabilitation
of mines through topsoil treatment and vegetation recovery (DMR, 2010a). Although this required some
environmental consideration by mines, the first real step towards formalising mining’s environmental
remediation liabilities began in 1991 when the Minerals Act made provision for mining companies to
take financial responsibility for rehabilitation after closure (Swart, 2003).
In terms of the Mineral and Petroleum Resources Development Act 28 of 2002 (MPRDA), mines are
now legally obliged to plan for rehabilitation after mining activity has ceased, and to consider the
lagged social and environmental impacts of mining in the short term. Specifically they are obliged to
allocate funds to perform environmental rehabilitation upon the decommissioning or termination of
mining activities. These funds can be earmarked in the following ways: a) cash paid into a Department
of Mineral Resources (DMR) trust; b) through an investment that will be used as security in the form of
a short-term guarantee, called a Section 37(A) Trust; and c) through the provision of a guarantee from a
DMR approved bank or short-term insurer, who will see to the rehabilitation up to a specified amount if
the mine can no longer continue operations (Kruger, 2011). Non-compliance with required provisions for
funding mine rehabilitation carries various penalties (Strydom and McMeekin, 2011).
10MAY
ACID MINE DRAINAGE AND ITS GOVERNANCE IN THE GAUTENG CITY-REGION
2015
The legislative framework for mine closure was extended in 2004, by means of regulations for the
MPRDA, to encompass a social and labour plan (Regulation 42). The 2004 regulations also integrated
key principles from the National Environmental Management Act and the National Water Act (DMR,
2010a and Kruger, 2011). Mine closure is now governed by a loose framework of acts working together
with other regulations such as the requirement for Environmental Management Plans. These acts include
the Constitution of South Africa (1996), Mine Health and Safety Act (1996), National Environmental
Management: Air Quality Act (2004), and Nuclear Energy Act (1999) (Figure 2.4).
Figure 2.4: South Africa’s legislative framework for mine closure
(DMR, 2010a and Kruger, 2011)
National
Constitution of South Environmental
Minerals Africa, 1996 and Mine Health and
Act, 1991 Safety Act, 1996 Management
common law Act, 1998
Minerals and National
National Water Nuclear Energy Petroleum Resources Environmental
Act, 1998 Act, 1999 Development Management: Air
Act, 2002 Quality Act, 2004
Despite the introduction of new legislation, the legal framework governing mining’s social and
environmental responsibilities, especially in the event of mine closure, remains diffuse. There is also a
perception that while regulations are on the books, the enforcement of these regulations by government
departments has not been systematic. Mines have continued to exploit weaknesses in the regulatory
environment, and the practice of deflecting social and environmental costs continues (Adler et al., 2007).
11GCRO OCCASIONAL PAPER 10
2.4 Negative impacts on the environment, society and economy
While most GCR residents would have some broad sense that mines, and large bodies of associated
mine waste, cause damage to the environment, the precise nature of their impact on different aspects
of the environment (especially on water systems), society (notably on human health) and the economy
is not well known (A.T. Kearney, 2012). The rest of this section briefly reviews some of the impacts of
both AMD and so-called MRAs. This overview does not aim to blame mines for a legacy of negative
impacts (mining’s positive contributions have also been considerable), but merely to present the facts of
the current situation that must be acknowledged and confronted.
Impacts on the environment
Mine Residue Areas (MRAs)
Acid mine drainage is only a part of the contamination caused by mine waste in the GCR. Areas of
localised mine waste are known as MRAs. These may include tailings disposal facilities, waste rock
dumps, open cast excavations and quarries, water storage facilities, tailings spillage sites, footprints left
after the re-mining of tailings, disposal facilities and a mix of waste that falls within the boundaries of
former mine properties. MRAs lead to atmosphere-borne pollution and the water-borne contamination
of soil and bedrock around mine sites, and they can also contribute to the collapse of under-mined or
dewatered/rewatered ground (GDARD, 2012). Furthermore, MRAs can contribute to AMD through the
contamination of underground basins via ingress points on the surface. There are 374 identified MRAs in
Gauteng, most of which are associated with gold mining (GDARD, 2012).
MRAs are a particular challenge in light of so-called ‘ownerless and derelict mines’, a key factor in the poor
compliance with legislation around mine closure. DMR has compiled a ranked database of ownerless and
derelict mines, which, abandoned by their previous owners, have become the responsibility of the state.
The ranking is based on the degree of environmental risk that the mines pose to both the environment
and nearby communities. A total of 6 152 ownerless and derelict mines have been identified and, where
applicable, the financial cost to rehabilitate them has also been calculated (DMR, 2010a). In 2011, the
financial implications of ownerless and derelict mines was estimated at R30 billion and this is expected
to increase over time (DMR, 2010a and WWF, 2012).
In light of the sheer number of ownerless and derelict mines in South Africa, efforts made by government
to rehabilitate mines have been slow. For example, while 6 mines were allocated funds during 2011/12
for rehabilitation (DNT, 2011), only 3 were successfully rehabilitated (DNT, 2015). This increased to 13
rehabilitated mines in 2012/13 and 28 in 2013/14 (DNT, 2015). As part of a coordinated effort made by
DMR, we may see a growing number of mines being rehabilitated in the future. This is due to additional
funds being allocated for mine rehabilitation in 2014/15 - 2017/18, where at least 50 ownerless and derelict
mines will be rehabilitated per year (DNT, 2015).
Soil contamination by AMD
Soil that has been contaminated by AMD has a lowered pH, generally between 4 and 6, which is acidic
to strongly acidic. Soil in the upper 0.3m of topsoil is shown to be the most contaminated with increased
levels of heavy metals such as cobalt, nickel, zinc and sulphur (Rösner and van Schalkwayk, 1999). The
acidification of topsoil represents permanent soil degradation that creates difficulties for future land use,
as only acid-tolerant plants can be grown in acidic soils. Heavy metals from contaminated soil are taken
12MAY
ACID MINE DRAINAGE AND ITS GOVERNANCE IN THE GAUTENG CITY-REGION
2015
up by plants and transferred to humans and animals through the food chain. This poses severe risks for
the agricultural and livestock industries in the GCR causing severe health problems and the degradation
of ecosystems (Ochieng et al., 2010).
Impact of MRAs on water quality
Many of the streams that run through mine areas are perennial and their base flow is sourced from
underground seepage (Tutu et al., 2008). These streams are therefore particularly susceptible to
contamination by MRAs and AMD. Ochieng et al., (2010) explain that mine water impacts negatively
on natural water systems by increasing the amount of suspended solids, mobilising iron, aluminium,
cadmium, colbalt, manganese and zinc, and increasing the overall pH of water. The consequent
deterioration of water quality creates risks for domestic, industrial and agricultural water users (Ochieng
et al., 2010).
In a study conducted by Tutu et al., (2008), the quality of surface water in close proximity to MRA and
AMD waste-generating deposits was found to have the lowest quality, though it improved downstream.
Water in lakes was relatively unpolluted but with levels of pollution being higher at the end of the wet
season as a result of increased discharge (Tutu et al., 2008). Groundwater in close proximity to AMD-
generating deposits had higher acidity and contained contaminants such as sulphate compounds (Tutu
et al., 2008). Tutu’s study also found that where groundwater mixed with ponds and streams, the acidity
of the water increased due to oxidation and evaporation. Interestingly, water from mining areas that
drained into wetlands often had improved water quality due to the modification of the pH through
chemical processes that take place within wetland systems. The better quality of water in lakes could be
attributed to wetlands that often surround lake feeder streams (Tutu et al., 2008).
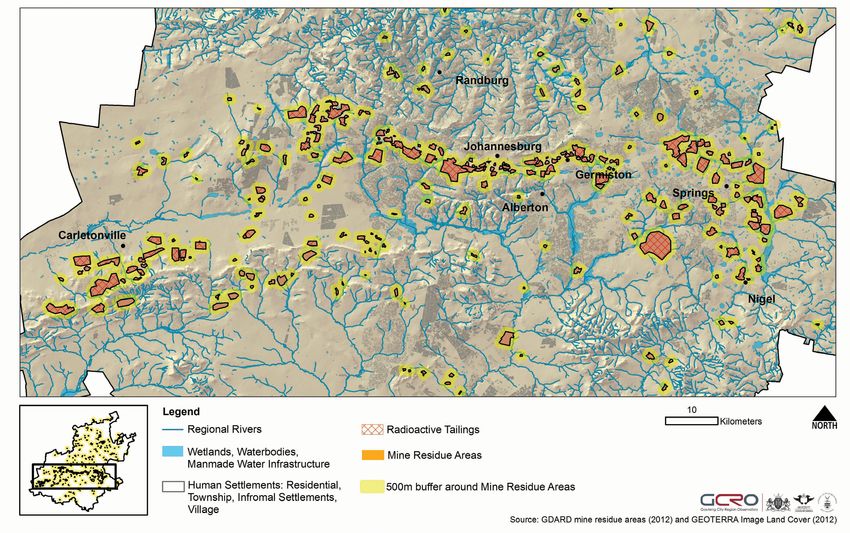
The impact of MRAs on water quality is not only through seepage, but also through airborne radioactive
material. Dust levels are said to be acceptable at a buffer distance of 500m (Coetzee, 2008) but the sheer
number of MRAs scattered around the GCR means that many natural and man-made water resources
in the GCR are in close proximity to mine waste and are susceptible to radioactive particles (Figure 2.5).
There are accounts of AMD-related contamination impacting the Blesbokspruit, Klip River system,
Wonderfontein, Natalspruit, Tweelopiespruit, and Hartebeespoort Dam (Ochieng et al., 2010). The
Vaal River system is most at risk from contamination by AMD and this is not a new phenomenon.
The contamination by AMD of streams that feed into the Vaal River catchment poses a great threat to
the potable water supply of the GCR. As mining activity increased in the 1900s, so did the amounts of
dissolved solids and contaminates entering the Vaal River above the Barrage (Marsden, 1986).
In 1986, Marsden conducted a study on the concentrations of sulphides and total sulphur in areas
around mine deposits from which rainwater run-off could enter the VRS. Marsden (1986) found that
a high percentage of oxidizable and leachable pollution-causing sulphur had already been removed.
Contamination was therefore largely from dissolved salts, and this was less severe when the mine-residue
deposits were vegetated (Marsden, 1986). Marsden, who was the environmental protection officer at the
Chamber of Mines of South Africa, may have had a particular bias with regards to mine waste in the GCR,
but it is important to appreciate the environment’s ability to regulate itself within its own environmental
threshold. This being said, the regulatory capacity of the environment has recently been significantly
affected by the decant of raw acid water into streams, especially those in the WB. The quality of water in
the Tweelopiespruit and Wonderfontein catchment has been most severely affected by decant in the WB.
13GCRO OCCASIONAL PAPER 10
To date, South Africa has been left with a number of sterile dams that serve as a reminder of what we
may face in the future if the environmental risks associated with AMD are not taken seriously. Rand
Water’s “Water Wise” website identifies the Robinson Dam in Randfontein as a product of mismanaged
tailings on the West Rand (Rand Water, n.d.). Robinson Dam is part of the Wonderfontein catchment
which has been heavily polluted with metals such as uranium. The water in Robinson Dam is said to have
deteriorated after a mine began pumping acid water into the dam as an emergency measure in response
to decant in the WB in 2002 (Rand Water, n.d.). Water in Robinson Dam is now said to have a pH as low as
2.2, and the dissolved uranium has created a radioactive environment that can support no life at all. The
occurrence of sterile water bodies such as the Robinson Dam are the clearest warning of what may result
if more care is not taken to prevent the destruction of natural ecosystems and contamination of potable
water by mining-related waste.
Impacts of MRAs on society
Communities in close proximity to MRAs are also vulnerable to waterborne and airborne pollution
(Scherer, 2013). From its earliest beginnings, Johannesburg’s urban form developed around the location
of gold mines. The tented diggers’ camp that first housed prospectors, immediately adjacent to the mine
workings, gave way to a succession of more formal structures, first corrugated iron and then more robust
brick buildings, in the same location (Van Onselen, 1982, Beavon, 2004). Those who made considerable
wealth from the mining activities moved north, and occupied large residences on or over the Parktown
Ridge. The poorer working classes remained behind in the south, housed in cottages, camps and shacks
dotted along points of gold production (Van Onselen, 1982, Beavon, 2004). As mining expanded along
the Witwatersrand from Randfontein and Carletonville in the west, to Springs in the east, so did the
settlements along the rand. A class and racially based society began to evolve in Johannesburg which
later built the foundations of an apartheid city (Worden, 2012).
Many older and poorer townships, informal settlements and government-provided low income housing
estates are still located close to MRAs. Figure 2.6 indicates settlement proximity to mines with Paardekraal,
Pennyville, Noordgesig, Carltonville, Steelvalley, Linkholm, Kingsway, Witpoort Estate and Refilwe/
Cullinan standing out as examples. It is notable that many government-subsidised low income housing
projects appear to have been earmarked for land close to slime dams, mine dumps and landfill sites of
active or derelict mines (Manungufala et al., 2005). Exposure to carcinogenic, mutagenic and teratogenic
elements such as uranium, arsenic, radon, nickel, zinc and other radioactive materials found in mining
waste poses huge health and safety hazards.
People living in these areas are often not aware of the dire health risks they are exposed to daily
(Manungufala et al., 2005). Where they are aware of health problems arising from adjacent mines, they
are often reluctant to raise the issue. While the South African Constitution guarantees that everyone has
the right to an environment that does not harm health and well-being (Swart, 2003), there have been
very few instances of social and environmental activists fighting the risks and impacts associated with
mining. Scherer (2013) believes that this is because communities depend on nearby mines for jobs and
opportunities, and also because mines in these areas are perceived to hold huge power which is difficult
to contest politically.
14MAY
ACID MINE DRAINAGE AND ITS GOVERNANCE IN THE GAUTENG CITY-REGION
2015
Figure 2.5: Water bodies in the GCR and their proximity to radioactive mining waste.
15GCRO OCCASIONAL PAPER 10
Figure 2.6: Human settlement and mine footprints in the GCR (data source: GTI 2009 and 2012).
16MAY
ACID MINE DRAINAGE AND ITS GOVERNANCE IN THE GAUTENG CITY-REGION
2015
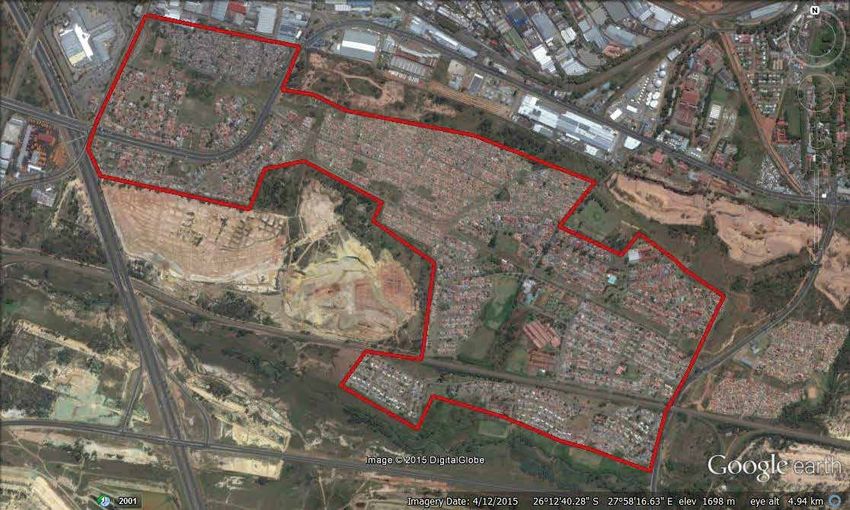
Riverlea - A community standing up for their rights
Riverlea is a community in the south-west of Johannesburg that has been affected by the dust of a
DRD Gold mine reclamation project. Reprocessing of the tailing dump upwind of Riverlea began in
2010. Since then, residents say they have experienced health issues related to the increased dust fallout
as a result of the reclamation project. Communities have confronted DGD Gold about dust levels and
the health issues they have experienced. DRD Gold has taken no responsibility for this, explaining
to community members that they will need to prove that dust from DRD Gold is responsible for
their health issues. The Riverlea community has approached Earthlife Africa to gain information
around mining impacts on the community. Under the Promotion of Access to Information Act (PAIA),
Earthlife Africa was unable to access this information, including the status of the mining and water
licences from government. They were, however, able to obtain half the requested information DWA.
To gain more information, residents now aim to take a legal route to obtain information.
(Text has been consolidated from Kings, 2013a and Kings, 2013b)
Google Earth image showing the Riverlea community located in the south-west of Johannesburg. This image illustrates the
location of Riverlea in relation to surrounding mine dumps.
17GCRO OCCASIONAL PAPER 10
Impacts on the economy
While mining has historically made a key contribution to the South African economy, mine waste now
also represents a considerable economic cost. As the guardian and regulator of mining, the government
has accrued, as property of the state, 6 000 ownerless and derelict mines (Van Schie, 2012 and Baartjes
& Gouden, n.d.). The financial liabilities of these mines – notably the direct costs of their remediation
– therefore now sit as a tax burden on the broader economy. The indirect costs of AMD have also been
described as a ‘binding constraint’ on the South African economy by Nedbank’s chief economist, Dennis
Dykes (Blaine, 2011).
The costs of dealing with mine waste and AMD are a drain on public resources. They subtract funding
from much-needed support for agricultural and industrial production, tourism promotion, power
generation, a host of other essential economic infrastructure investments, and so on. In addition, the
environmental impacts associated with mine waste are likely to contribute to an increased burden on
public healthcare, which again falls as a major cost to the fiscus (A.T. Kearney, 2012).
18MAY
ACID MINE DRAINAGE AND ITS GOVERNANCE IN THE GAUTENG CITY-REGION
2015
3. Action taken in response to AMD
3.1 A timeline of key events
Chapter 2 presented an overview of the history of mining in the GCR and commented on how the mines
had negative environmental, social and economic impacts through the externalisation of costs over time.
This chapter focuses on the history of actions taken towards mitigating AMD.
In order to facilitate an understanding of the history of actions to mitigate AMD, Figure 3.1 presents a
timeline of key events, focusing in particular on the period between 2002 until May 2014. The events
presented in the diagram will be explored in further detail in Chapter 4, where the public discourse
around AMD and the contractual arrangements for devising and implementing the immediate and
short-, and long-term solutions will be reviewed.
3.2 Project Eutopia
In March 2005, DWA issued notices to a number of mines in the GCR in terms of Section 19(3) of the
National Water Act (Act 36 of 1998), instructing them to take steps to install temporary AMD treatment
options and to develop a longer-term sustainable solution to the problem (WUC, 2008). In response to
the directives, three voluntary mining Section 21 cooperative bodies were formed in 2006/7, named the
Western Basin Environmental Corporation (WBEC), Central Basin Environmental Corporation (CBEC)
and Eastern Basin Environmental Corporation (EBEC). Figure 3.2 provides an overview of the geography
of the three basins and Table 3.1 summarises which mines participated in the formation of each corporation
(WUC, 2010).
The corporations were formed in reaction to the DWA directive to develop responses to AMD and to
assume the AMD-related environmental liabilities of active mines. Some of these corporations worked
through subsidiary structures to achieve this purpose. The most notable example was the Western
Utilities Corporation (WUC) (see company origin and structure in Box 2) which was mandated by WBEC
to undertake extensive studies, piloting and consultation to meet the DWA directive (WUC, 2010).
In October 2008, the WUC released a report titled Project Eutopia, detailing its specific solution and strategy
to overcome AMD. It proposed treating water to industrial standards and reselling this water to mines
and industry (WUC, 2008). The WUC raised R75 million on capital markets during the following four
years for research and development of pilot plants. A feasibility study was completed indicating that a
minimum of 75 megalitres could be pumped per day and the best location of the high density separation
water treatment plant was at ERPM (WUC, 2008). A pipeline would connect the WB and EB preventing
the discharge of any polluted water into the Tweelopiespruit River. From 2009 onwards, WUC initiated a
series of pilot plants to test its treatment solution.
In 2009 and 2010, WUC began engaging with DWA at a ministerial level on advancing its alternative AMD
solution (WUC, 2010). In late 2009, it presented government with a proposed complete self-sustaining
solution, said to be capable of operating without any further assistance from mines and able to survive
the ultimate closure of existing mines (PMG, 2011a).
19You can also read