ACQUISITION OF BRUIN E&P - FEBRUARY 3, 2021 ERF: TSX & NYSE - Enerplus
←
→
Page content transcription
If your browser does not render page correctly, please read the page content below
FEBRUARY 3, 2021

ACQUISITION OF BRUIN E&P
          ERF: TSX & NYSE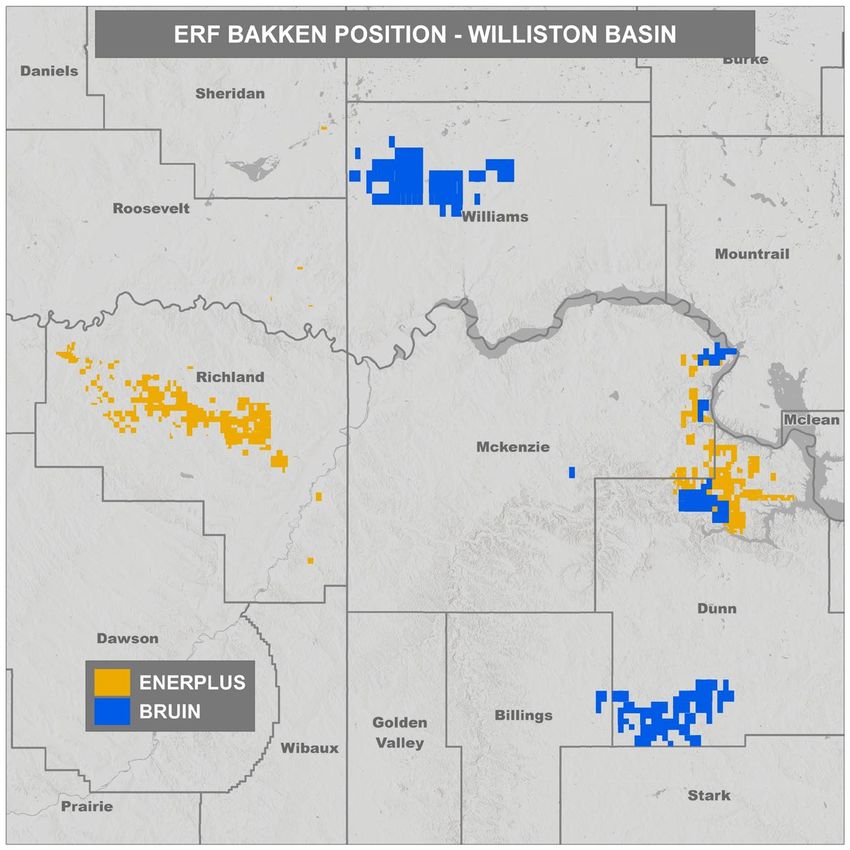
Forward looking information and statements
This presentation contains certain forward-looking information and statements ("forward-looking information") within the meaning of applicable securities laws. The use of any of the words "expect", "anticipate", "continue", "estimate",
"guidance", "ongoing", "may", "will", "project", "plans", "budget", "strategy" and similar expressions are intended to identify forward-looking information. In particular, but without limiting the foregoing, this presentation contains forward-looking
information pertaining to the following: anticipated completion of the acquisition of Bruin E&P HoldCo, LLC (the “Acquisition”) and financings, including expected size, terms, timing and completion thereof; expected benefits of the
Acquisition; expected impacted of the Acquisition on Enerplus' operations and financial results, including inventory of drilling locations, expected accretion to Enerplus' metrics (including expected free cash flow in 2021 and year-end net debt
to adjusted funds flow ratio); Enerplus' expected 2020 and 2021 average production volumes and expected capital levels to support such production; anticipated production mix and Enerplus' expected source of funding thereof; our operating
plans; oil and natural gas prices and differentials and our commodity risk management programs; and anticipated impact of the Acquisition on Enerplus' future costs and expenses; plans for excess cash flow; and Enerplus' ESG targets,
including reduction in GHG emissions intensity and in freshwater use.

The forward-looking information contained in this presentation reflects several material factors and expectations and assumptions of Enerplus including, without limitation: that the Acquisition will be completed substantially on the terms and
within the timeline described in this press release; that Enerplus will realize expected benefits of the Acquisition described in this press release; that Enerplus will conduct its operations and achieve results of operations as anticipated; that
Enerplus' development plans will achieve the expected results; current commodity price and cost assumptions; the general continuance of current or, where applicable, assumed industry conditions, including expectations regarding the
duration and overall impact of COVID-19; the continuation of assumed tax, royalty and regulatory regimes; the accuracy of the estimates of Enerplus' reserves and resources volumes; the continued availability of adequate debt and/or equity
financing, cash flow and other sources to fund Enerplus' capital and operating requirements, and dividend payments as needed; availability of third party services; and the extent of its liabilities. In addition, Enerplus' 2021 outlook contained in
this presentation is based on the following: a WTI price of between US$50.00/bbl, a NYMEX price of US$2.75/Mcf, a Bakken crude oil price differential of US$3.25/bbl below WTI and a USD/CDN exchange rate of 1.27. Certain metrics
included in this press release, including accretion to adjusted funds flow per share and free cash flow per share and net debt to trailing adjusted funds flow ratio, take into account concurrent equity offering. Enerplus believes the material
factors, expectations and assumptions reflected in the forward-looking information are reasonable but no assurance can be given that these factors, expectations, and assumptions will prove to be correct.

The forward-looking information included in this presentation is not a guarantee of future performance and should not be unduly relied upon. Such information involves known and unknown risks, uncertainties and other factors that may
cause actual results or events to differ materially from those anticipated in such forward-looking information including, without limitation: failure to complete the Acquisition, at all or on terms or within the timeline described in this press
release; failure by Enerplus to realize anticipated benefits of the Acquisition; changes, including future decline, in commodity prices, including as a result of continued COVID-19 pandemic; changes in realized prices for Enerplus' products;
changes in the demand for or supply of Enerplus' products; unanticipated operating results, results from Enerplus' capital spending activities or production declines; curtailment of Enerplus' production due to low realized prices or lack of
adequate infrastructure; changes in tax or environmental laws, royalty rates or other regulatory matters; changes in development plans by Enerplus or by third party operators of Enerplus' properties; increased debt levels or debt service
requirements; changes in estimates of Enerplus' oil and gas reserves and resources volumes; limited, unfavourable or a lack of access to capital markets; increased costs; a lack of adequate insurance coverage; the impact of competitors;
reliance on industry partners; failure to complete any anticipated acquisitions or divestitures; changes in law or government programs or policies in Canada or the United States; and certain other risks detailed from time to time in Enerplus'
public disclosure documents (including, without limitation, those risks identified in its AIF, management's discussion and analysis ("MD&A"), and Form 40-F at December 31, 2019 and management's discussion and analysis for the third
quarter of 2020) as it may be updated from time to time by current reports on Form 6-K, all of which are available, as applicable, on SEDAR website at www.sedar.com, on the SEC's website at http://www.sec.gov and on Enerplus' website).

The purpose of our estimated free cash flow disclosure, is to assist readers in understanding our expected and targeted financial results, and this information may not be appropriate for other purposes. Information in this press release is
provided as of the date hereof and Enerplus assumes no obligation to update any forward-looking statements, unless otherwise required by law.The forward-looking information contained in this presentation speaks only as of the date of this
presentation, and none of Enerplus or its subsidiaries assume any obligation to publicly update or revise such forward-looking information to reflect new events or circumstances, except as may be required pursuant to applicable laws.

                                                                                                                                                                                                                                                       2
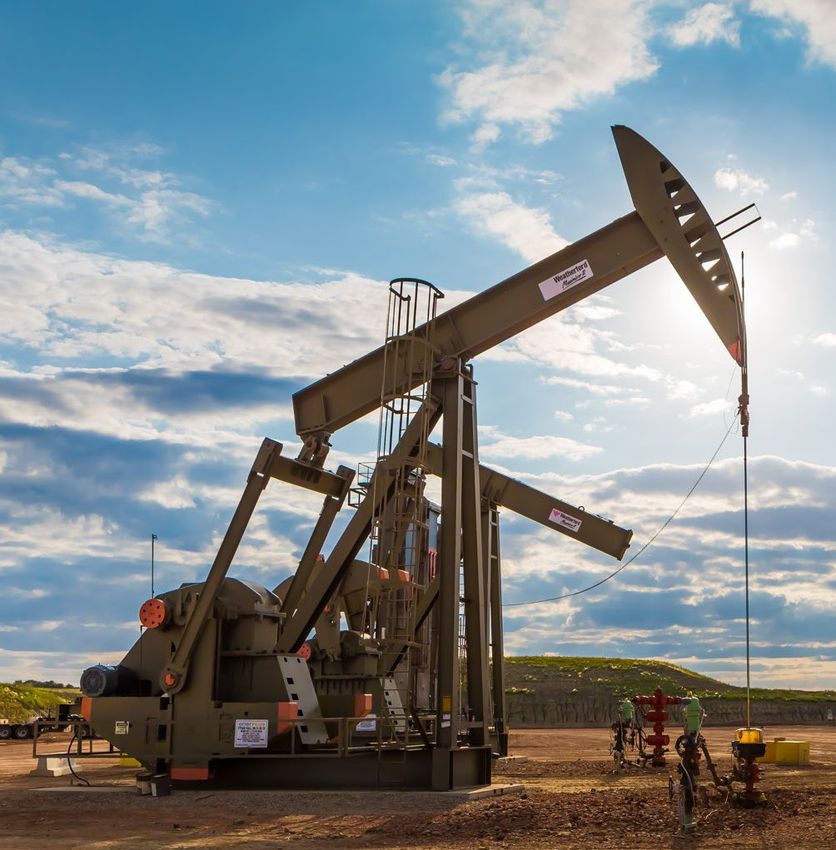
ENERPLUS ACQUISITION OF WILLISTON BASIN OPERATOR BRUIN
Enhancing value for shareholders and accelerating free cash flow
Core acreage position improves scale
Highly complementary to Enerplus’ existing tier 1 position
Accretive to per share metrics
Material accretion to adjusted funds flow and free cash flow per share(1)
Attractive valuation and free cash flow acceleration
Acquisition supports robust free cash flow generation(1)
Maintains strong balance sheet & liquidity
Expect to be at or below 1.3x ND/AFF ending 2021(1) TRANSACTION DETAILS
Total cash consideration of US$465MM
Drives cost synergies Funded with US$400MM term loan, $132MM equity financing
Adjacent acreage offers operational synergies, no incremental G&A Closing expected early March 2021
3
1) Non-GAAP measures. Please see supplemental materials and “Advisories”.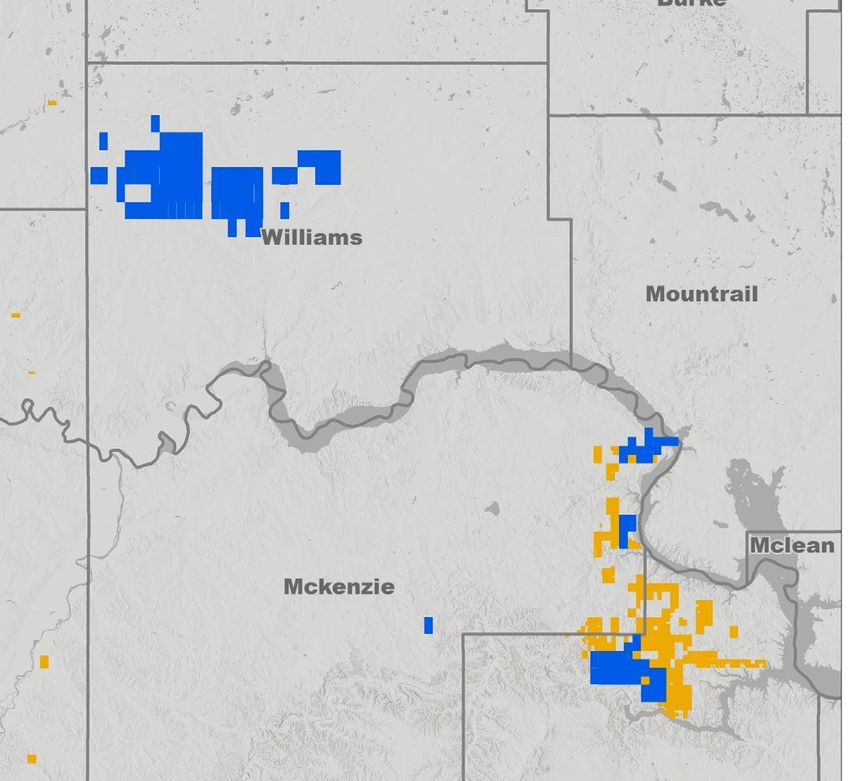
Core area acquisition improves scale
2021 total production (1) WILLISTON BASIN OVERVIEW
Complimentary to ERF’s tier 1 position MBOE/d
106
86
>150,000 net acres from Bruin
− 30,000 net acres around Fort Berthold
Enerplus Pro forma Williams County Fort
− 135 (101 net) undrilled locations, 14 (10 net) DUCs standalone Bruin net acreage: 67,000 Berthold
Bruin net locations & DUCs: 60
− Additional drilling inventory upside 2021 liquids production (1)
Area
Mbbl/d 65
Current Bruin production ~24 MBOE/d 48
− Lower base decline than ERF’s FBIR position
Drives cost synergies Enerplus
standalone
Pro forma Fort Berthold
Bruin net acreage: 30,000
− Capital and opex synergies expected 2021 liquids mix(1)
Bruin net locations & DUCs: 51
− No incremental G&A with the acquisition (% of production)
61%
56%
Enerplus Pro forma
standalone 4
1) Pro forma assumes a ten-month contribution from Bruin in 2021. Based on guidance midpoints.Acquisition is highly accretive in first year
ATTRACTIVE VALUE SHAREHOLDER ACCRETION FREE CASH FLOW ACCELERATION
$200 MILLION
Purchase price as a portion of Accretive to Accretive to Expected free cash flow generation
Bruin’s forecast 2021 EBITDA(1) adjusted funds free cash flow in 2021(3)
flow per share(2) per share(2)
1) Based on US$50/bbl WTI, US$2.75/Mcf NYMEX. 2) Based on 12-month period following closing of the acquisition. 3) Based on US$50/bbl WTI, US$2.75/Mcf NYMEX and 10-
month contribution from Bruin.
5Maintaining strong balance sheet and liquidity
Significant liquidity Balance sheet strength
Expected liquidity position upon acquisition closing (US$ million)(1) Net debt to 2021e adjusted funds flow ratio(3)
US$600 2.5x
At or below 1.3x
2.2x at YE 2021 at US$50/bbl WTI
2.0x Targeting less than 1.0x
long term
US$600MM
credit facility 1.5x 1.3x
expected to TERM LOAN
be undrawn $400Strong well performance in FBIR & Williams Co. Acreage
Enerplus and Bruin North Dakota well performance ENERPLUS & BRUIN NORTH DAKOTA ACREAGE
Average cumulative oil production per well since 2019
250
62 WELLS
30 WELLS
Cumulative oil production (mbbl)
200 12 WELLS
150
Line of sight to lower cost structures in
Williams Co. acreage due to shallower FBIR
depths and lower ancillary costs
100
50
0 ENERPLUS
0 50 100 150 200 250 300 350
BRUIN
Producing days
Enerplus - FBIR Bruin - FBIR Bruin - Williams Co.
7ENERPLUS NORTH DAKOTA WELL COST PERFORMANCE
Solid execution delivering capital efficiency gains
Drilling efficiency - continuing to drill faster
Drilling days vs. depth (spud to rig release)(1)
Days
0 2 4 6 8 10 12 14 16 18 20 Total well costs
0 (US$MM)(1)(2)
3,000 2017 Average
2018 Average
6,000
2019 Average 38% IMPROVEMENT TARGETING CONTINUED
Depth (ft)
9,000 SINCE 2017 IMPROVEMENT IN 2021
2020 Average
12,000
Pacesetter $8.1
15,000
18,000
21,000
$6.3
Completion efficiency – more stages per day
Stages per day
15.3
16
11 9.5
$1.8MILLION
6
4.9
6.7 94% IMPROVEMENT
SINCE 2018
WELL COST
REDUCTION
1
-4 2018 2019 2020 Pacesetter 2017 2020
Average Average Average pad
1) Based on two-mile lateral wells. 8
2) Total well cost includes drilling, completion and facilities costs.Bakken egress and oil price differential outlook
Bakken oil production & takeaway capacity(1)
Millions of bbl/d
2.8
~400 mb/d of incremental rail capacity would be
required to clear the basin if DAPL cannot flow BAKKEN DIFFERENTIAL
2.4 − ~300 mb/d can be added in the near term (BELOW WTI)
− ~100 mb/d available per month thereafter up to
2.0 nameplate capacity 2020 GUIDANCE 2021 OUTLOOK
US$5.00/BBL US$3.25 /BBL
1.6 Excess rail loading capacity(3) Production(2)
1.2
DAPL Expected y-o-y differential improvement due
0.8 to declining basin production leading to
Pipelines (ex DAPL)
increased pipeline egress (assumes DAPL is
0.4 operational).
Rail volumes(3)
0.0
Dec-13
Dec-14
Dec-15
Dec-16
Dec-17
Dec-18
Dec-19
Jun-20
Jun-21
Jun-14
Jun-15
Jun-16
Jun-17
Jun-18
Jun-19
Dec-20
Dec-21
1) Source: NDIC, company estimates.
2) Production on chart is shown net of local refining demand.
9
3) Forecast rail volumes assume 175 mb/d are contracted going forward. Excess rail loading capacity is based on NDIC data, although active facilities are currently less than this.Pro forma 2021 outlook
BASED ON A 10-MONTH CONTRIBUTION FROM BRUIN
TOTAL PRODUCTION 103,500 to 108,500 BOE/d
LIQUIDS PRODUCTION 63,000 to 67,000 bbl/d
CAPITAL SPENDING $335 to $385 million
CRUDE OIL HEDGING 70% protected at floor of US$44 WTI
(Based on 2021 forecasted 66% of protected volumes provide
net of royalty production)
upside participation to US$54 WTI
DRILLED UNCOMPLETED
WELL INVENTORY 46 (36 net)(1)
(YE 2020)
10
1) Drilled uncompleted well inventory (operated) includes Enerplus’ 32 gross (26 net) and Bruin’s 14 gross (10 net). Includes Enerplus’ 3 gross (2.6 net) DUCs in the DJ Basin.Investment highlights
Concentrated acreage footprint in the Bakken core
CDN WATERFLOODS
7,700 BOE/d (95% oil)(1)
Large remaining development opportunity
Low financial leverage and strong liquidity
BAKKEN (Pro forma)
70,000 BOE/d (76% oil)(1)
High-quality exposure to improving price environment
MARCELLUS
175 MMcf/d (100% gas)(1)
Disciplined returns-based capital allocation
11
1) Production is Q4 2020. Bakken production is based on Enerplus and Bruin’s Q4 2020 production. Map does not include ~3 MBOE/d from other assets in Canada and Colorado.Advisories
Assumptions
Investor Relations Contacts All amounts are stated in Canadian dollars unless otherwise specified.
Drew Mair Barrels of Oil Equivalent and Cubic Feet of Gas Equivalent
This presentation contains references to “Mcf” (million cubic feet), “Bcf” (billion cubic feet), “bbl” (barrel of oil) and "BOE" (barrels of oil equivalent) in total and on a per day (“/d”) basis. Enerplus has
Manager, Investor Relations & adopted the standard of six thousand cubic feet of gas to one barrel of oil (6 Mcf: 1 bbl) when converting natural gas to BOEs. BOEs may be misleading, particularly if used in isolation. The foregoing
Corporate Planning conversion ratios are based on an energy equivalency conversion method primarily applicable at the burner tip and do not represent a value equivalency at the wellhead. Given that the value ratio
403-298-1707 based on the current price of oil as compared to natural gas is significantly different from the energy equivalent of 6:1, utilizing a conversion on a 6:1 basis may be misleading. “Mbbl” means “thousand
barrels of oil; "MBOE" and "MMBOE" mean "thousand barrels of oil equivalent" and "million barrels of oil equivalent", respectively.
Krista Norlin Non-GAAP Measures
Sr. Investor Relations Analyst In this presentation, Enerplus uses the terms "free cash flow“, "adjusted funds flow" (including per share measures) and “net debt to adjusted funds flow ratio” as measures to analyze operating and
financial performance and leverage. "Free cash flow" is defined as "Adjusted funds flow less exploration and development capital spending". "Adjusted funds flow" is calculated as net cash generated
403-298-4304 from operating activities but before changes in non-cash operating working capital and asset retirement obligation expenditures. “Net debt to adjusted funds flow ratio” is used by Enerplus and is
useful to investors and securities analysts in analyzing leverage and liquidity. The net debt to adjusted funds flow ratio is calculated as total debt net of cash, divided by a trailing 12 months of
Email: adjusted funds flow.
investorrelations@enerplus.com Enerplus believes that, in addition to net earnings and other measures prescribed by U.S. GAAP, the terms "adjusted funds flow“, "free cash flow" and “net debt to adjusted funds flow ratio” are useful
supplemental measures as such provide an indication of the results generated by Enerplus' principal business activities. However, these measures are not recognized by U.S. GAAP and do not have a
standardized meaning prescribed by U.S. GAAP. Therefore, these measures, as defined by Enerplus, may not be comparable to similar measures presented by other issuers.
Presentation of Production and Reserves Information
Under U.S. GAAP oil and gas sales are generally presented net of royalties and U.S. industry protocol is to present production volumes net of royalties. Under Canadian industry protocol oil and gas sales and production volumes are required to be
presented on a gross basis before deduction of royalties. In order to continue to be comparable with its Canadian peer companies, unless otherwise stated, the information contained within this presentation presents Enerplus' production and
BOE measures on a before royalty "company interest" basis. All production volumes presented herein are reported on a "company interest" basis, before deduction of Crown and other royalties, plus Enerplus' royalty interest. This presentation
also contains references to the percentage of the Company's production that is hedged under commodity derivatives contracts, this percentage being based upon the Company's net of royalty production volumes. All reserves volumes in this
presentation (and all information derived therefrom) are based on "gross reserves" using forecast prices and costs. "Gross reserves" (as defined in NI 51-101), are Enerplus' working interest before deduction of any royalties. Information about
reserves on Bruin's properties contained in this press release is derived from a report on Bruin's properties effective as of December 31, 2020 prepared by McDaniel & Associates Ltd., an independent reserves evaluator. The drilling locations
identified in this presentation are comprised of 65 gross (50.0 net) proved plus probable undeveloped reserves locations identified by McDaniel & Associates Ltd., of which 14 gross (9.9 net) are drilled and uncompleted, and 84 gross (60.9 net)
unbooked future drilling locations not associated with any reserves of Bruin, and have been identified by internal qualified reserves evaluators.
12You can also read