Acquisition of Edison E&P & $265 MM Equity Placing - Energean
←
→
Page content transcription
If your browser does not render page correctly, please read the page content below
Acquisition of Edison E&P
           &
$265 MM Equity Placing

1
Disclaimer (1/2)

    THIS PRESENTATION AND ITS CONTENTS ARE CONFIDENTIAL AND ARE NOT FOR RELEASE, PUBLICATION, REPRODUCTION OR DISTRIBUTION, IN WHOLE OR IN PART, DIRECTLY OR INDIRECTLY, IN OR INTO OR FROM THE UNITED
    STATES OF AMERICA, CANADA, AUSTRALIA, NEW ZEALAND, HONG KONG, THE REPUBLIC OF SOUTH AFRICA, SINGAPORE, JAPAN OR ANY JURISDICTION WHERE SUCH DISTRIBUTION WOULD BE UNLAWFUL. BY ATTENDING THE
                                                MEETING WHERE THIS PRESENTATION IS MADE YOU AGREE TO BE BOUND BY THE FOLLOWING TERMS AND CONDITIONS.
   This presentation has been prepared and issued by Energean Oil & Gas plc (the “Company” or "Energean") solely for your information and for use at a presentation in connection with the proposed acquisition of Edison E&P
(“Edison E&P”) by the Company (the “Acquisition”) and the placing of new ordinary shares (the “Placing Shares”) in the capital of the Company (the "Placing") to part fund the consideration for the Acquisition (the Placing, together
   with the Acquisition, the “Transaction”). For the purposes of this notice, “presentation” means this document, any oral presentation, any question and answer session and any written or oral material discussed or distributed
 during the meeting. This presentation may not be copied, distributed, reproduced or passed on, directly or indirectly, in whole or in part, or disclosed by any recipient, to any other person (whether within or outside such person’s
                                                                   organisation or firm) or published in whole or in part, for any purpose or under any circumstances.
         The presentation has not been independently verified and no representation or warranty, express or implied, is made or given by or on behalf of the Company, Morgan Stanley & Co. International plc, Stifel Nicolaus Europe
    Limited, Peel Hunt LLP or RBC Europe Limited (together, the “Banks”), or any of their respective parent or subsidiary undertakings, or the subsidiary undertakings of any such parent undertakings, or any of such person’s respective
     directors, officers, employees, agents, affiliates or advisers, as to, and no reliance should be placed on, the accuracy, completeness or fairness of the information or opinions contained in this presentation and no responsibility or
      liability is assumed by any such persons for any such information or opinions or for any errors from or omissions in the information provided. All information presented or contained in this presentation is subject to verification,
        correction, completion and change without notice. In giving this presentation, none of the Company or the Banks or any of their respective parent or subsidiary undertakings, or the subsidiary undertakings of any such parent
     undertakings, or any of such person’s respective directors, officers, employees, agents, affiliates or advisers, undertakes any obligation to amend, correct or update this presentation or to provide the recipient with access to any
                                                                                              additional information that may arise in connection with it.
     This presentation does not constitute or form part of, and should not be construed as, any offer, invitation or recommendation to purchase, sell or subscribe for any securities in any jurisdiction and neither the issue of the
information nor anything contained herein shall form the basis of or be relied upon in connection with, or act as an inducement to enter into, any contract, commitment or investment activity. This presentation does not purport to
  contain all of the information that may be required to evaluate the Company, Edison E&P, any investment in the Company or any of its securities and should not be relied upon to form the basis of, or be relied on in connection
  with, any contract or commitment or investment decision whatsoever. This presentation is intended to present background information on the Company, its business and the industry in which it operates and is not intended to
provide complete disclosure upon which an investment decision could be made. The merit and suitability of an investment in the Company should be independently evaluated and any person considering such an investment in the
 Company is advised to obtain independent advice as to the legal, tax, accounting, financial, credit and other related matters prior to making an investment. The Banks are not advisers as to legal, taxation, accounting or regulatory
   matters in any jurisdiction and are not providing any advice as to any such matter. By accepting this presentation, you acknowledge that the Banks are not in the business of providing (and you are not relying on the Banks for)
   legal, tax, accounting, regulatory or other advice. You also acknowledge that there may be legal, tax, accounting, regulatory or other risks associated with any transaction contemplated by this presentation and that you should
                                                                                         receive and rely on separate advice as to such matters.
    To the extent available, the industry and market data contained in this presentation has come from official or third party sources. Third party industry publications, studies and surveys generally state that the data contained
  therein have been obtained from sources believed to be reliable, but that there is no guarantee of the accuracy or completeness of such data. While the Company believes that each of these publications, studies and surveys has
   been prepared by a reputable source, the Company has not independently verified the data contained therein. In addition, certain of the industry and market data contained in this presentation come from the Company’s own
internal research and estimates based on the knowledge and experience of the Company’s management in the market in which the Company operates. While the Company believes that such research and estimates are reasonable
and reliable, they, and their underlying methodology and assumptions, have not been verified by any independent source for accuracy or completeness and are subject to change without notice. Accordingly, undue reliance should
   not be placed on any of the industry or market data contained in this presentation. Further, the Acquisition constitutes a class 1 transaction and a reverse takeover under the Listing Rules of the FCA and the Company intends, in
 due course, to publish: (i) a class 1 circular in accordance with the Listing Rules of the FCA; and (ii) a prospectus in accordance with the Prospectus Regulation (EU) No 2017/1129 for the re-application for admission to Listing of the
 Company's share capital following completion of the Acquisition; and such document(s) will include additional disclosure in relation to Edison E&P, including, without limitation, a competent person's report with respect to Edison
     E&P's assets, audited information on Edison E&P's financial track record and pro forma financial information reflecting the Acquisition, which may be different from and which will update, supplement and/or supersede the
                                                                                                   information included in this presentation.
    This presentation is not a prospectus and no prospectus is required in connection with the placing of the Placing Shares in accordance with Directive 2003/71/EC (as amended, including by Directive 2010/73/EU). Recipients should
     not purchase, subscribe for or otherwise acquire any securities of the Company on the basis of this presentation. A class 1 circular in accordance with the Listing Rules of the Financial Conduct Authority will be made available in
       due course in connection with the approval of the Company's shareholders required for the Acquisition and a prospectus in accordance with the Prospectus Regulation (EU) 2017/1129 will be made available in due course in
     connection with the re-application for admission of the Placing Shares to listing on the premium listing segment of the Official List of the Financial Conduct Authority and to trading on the main market for listed securities of the
                                London Stock Exchange at completion of the Acquisition. The placing and settlement of the Placing Shares will occur prior to the publication of any circular and/or prospectus.

2                                                                                                                                                                                                                                       2
Disclaimer (2/2)

     This presentation is being distributed only to and is directed only at persons in member states of the European Economic Area ("EEA") who are qualified investors within the meaning of Article 2(1)(e) of the Prospectus Directive
    (Directive 2003/71/EC) including any relevant implementing measure in each member state of the EEA which has implemented the Prospectus Directive ("Qualified Investors"). In addition, in the United Kingdom, this presentation
     is addressed to and directed only at (i) persons who have professional experience in matters relating to investments falling within Article 19(5) of the Financial Services and Markets Act 2000 (Financial Promotion) Order 2005, as
       amended (the “Order”), (ii) persons who are high net worth entities falling within Article 49(2)(a) to (d) of the Order, or (iii) other persons to whom this presentation may otherwise lawfully be communicated (all such persons
                                                                                                together being referred to as “relevant persons”).
  This presentation must not be acted on or relied on (i) in the United Kingdom, by persons who are not relevant persons, and (ii) in any member state of the EEA other than the United Kingdom, by persons who are not Qualified
Investors. Any investment or investment activity to which this presentation relates is available only to relevant persons in the United Kingdom and Qualified Investors in any member state of the EEA other than the United Kingdom,
   and will be engaged in only with such persons. Subject to certain limited exceptions, the Placing Shares are being offered and sold exclusively outside the United States in accordance with Regulation S under the Securities Act.
This presentation and the information contained herein is not intended for publication or distribution in, and does not constitute an offer of securities in, the United States, Canada, Australia, New Zealand, Hong Kong, the Republic
of South Africa, Singapore, Japan or any other jurisdiction where such distribution or offer would be unlawful. The Company has not registered and does not intend to register the Placing Shares in the United States or to conduct a
  public offering of any securities in the United States. Securities may not be offered or sold within the United States without registration, except pursuant to an exemption from, or in a transaction not subject to, the registration
    requirements of the U.S. Securities Act. Subject to certain limited exceptions, neither this presentation nor any copy of it may be taken, transmitted or distributed, directly or indirectly, into the United States, its territories or
                                                            possessions. Any failure to comply with the foregoing restrictions may constitute a violation of U.S. securities laws.
    This presentation includes forward-looking statements. The words “expect”, “anticipate”, “intends”, “plan”, “estimate”, “aim”, “forecast”, “project” and similar expressions (or their negative) identify certain of these forward-
 looking statements. These forward-looking statements are statements regarding the Company’s intentions, beliefs or current expectations concerning, among other things, the Company’s results of operations, financial condition,
liquidity, prospects, growth, strategies and the industry in which the Company operates. The forward-looking statements in this presentation are based on numerous assumptions regarding the Company’s and Edison E&P's present
     and future business strategies and the environment in which the Company and Edison E&P will operate in the future. Forward-looking statements involve inherent known and unknown risks, uncertainties and contingencies
 because they relate to events and depend on circumstances that may or may not occur in the future and may cause the actual results, performance or achievements of the Company and Edison E&P to be materially different from
  those expressed or implied by such forward looking statements. Many of these risks and uncertainties relate to factors that are beyond the Company’s or Edison E&P's ability to control or estimate precisely, such as future market
    conditions, currency fluctuations, the behaviour of other market participants, the actions of regulators and other factors such as the Company’s ability to continue to obtain financing to meet its liquidity needs, changes in the
  political, social and regulatory framework in which the Company or Edison E&P operates or in economic or technological trends or conditions. Past performance should not be taken as an indication or guarantee of future results,
    and no representation or warranty, express or implied, is made regarding future performance. Some of the information is still in draft form and will only be finalised, if legally verifiable, at the time of any final prospectus. The
  Company and each of the Banks expressly disclaims any obligation or undertaking to release any updates or revisions to these forward-looking statements to reflect any change in the Company’s expectations with regard thereto
   or any change in events, conditions or circumstances on which any statement is based after the date of this presentation or to update or to keep current any other information contained in this presentation. Accordingly, undue
                                                          reliance should not be placed on the forward-looking statements, which speak only as of the date of this presentation.
  Morgan Stanley & Co. International plc and RBC Europe Limited are authorised by the Prudential Regulation Authority (“PRA”) and regulated by the Financial Conduct Authority (“FCA”) and the PRA in the United Kingdom. Stifel
 Nicolaus Europe Limited and Peel Hunt LLP are authorised and regulated by the FCA in the United Kingdom. We acknowledge that each Bank is acting as agent in respect of the Placing and is acting solely for the Company and no-
one else in connection with the Placing and, in particular, is not providing any service to us, making any investment or other recommendations to us, advising us regarding the suitability of any transactions we may enter into to buy
   or subscribe for any Shares, nor providing any investment or other advice to us in relation to the Shares, the Placing, the Company, the Group, Edison E&P or the Acquisition. Neither of the Banks will regard any other person
 (whether or not a recipient of this presentation) as a client in relation to the Transaction and will not be responsible to anyone other than the Company for providing the protections afforded to their respective clients nor for the
                                                         giving of advice in relation to the Transaction or any transaction, matter or arrangement referred to in this presentation.
   By attending the meeting where this presentation is made or by accepting a copy of this presentation, you will be deemed to have represented, warranted and undertaken that (i) you have read and agree to be bound by the
foregoing limitations and conditions and to maintain absolute confidentiality regarding the information disclosed in this presentation; and (ii) you will not at any time have any discussion, correspondence or contact concerning the
     presentation or the information contained herein with any of the directors, officers, employees, agents or affiliates of the Company, its parent or subsidiary undertakings, or the subsidiary undertakings of any such parent
  undertakings, nor with any of their suppliers or customers, nor any governmental or regulatory body, without the prior written consent of the Company and (iii) you understand the legal and regulatory sanctions attached to the
                                                                                    misuse, disclosure or improper circulation of the presentation.

3                                                                                                                                                                                                                                     3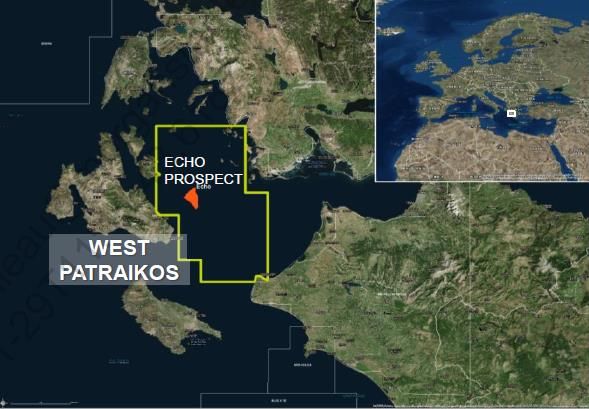
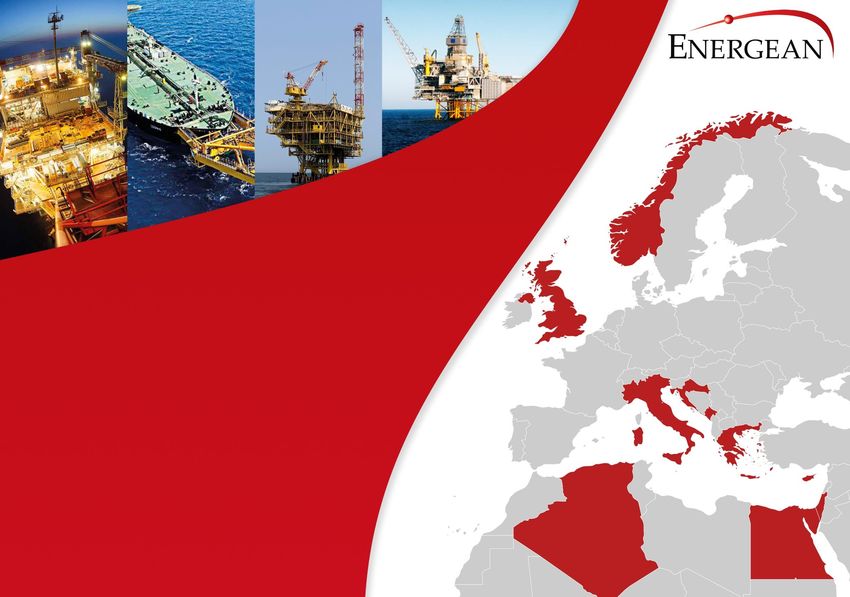
Creating Value Through the Acquisition of a Complementary Portfolio

    Mediterranean-Focused                            Gas-Weighted                       Diversified        Scale   Attractive Metrics

          Energean is acquiring EDF’s E&P portfolio held under Edison SPA

       2018 Key         •       2P Reserves:                                      292 mmboe (76% gas)
      Operational       •       Production:                                       69 kboe/d (80% gas)(2)
     and Financial      •       EBITDAX:                                          $434 MM
       Metrics (1)      •       Operating Cash Flow:                              $302 MM

                            •   $750 MM up front
                            •   $100 MM contingent on Cassiopea first gas
    Consideration
                            •   8% profit oil royalty on discoveries made by upcoming drilling on
                                North Thekah Offshore and North East Hap'y

                        •       Material acquisition at attractive deal metrics
                        •       Complementary portfolios, adding immediate cash flows and
                                EBITDAX
                        •       Building a full-cycle, Mediterranean-focused E&P
      Rationale         •       Gas weighted supporting Energean’s strategic commitment to
                                transition fuels
                        •       Enhances scale and diversification with extended regional footprint
                        •       Transfer of asset ownership from European utility to E&P-focused
                                management team

                     Source: Company information, CPR
                     1.    Working Interest
4                    2.    49 kboe/d (78% gas) on a net entitlement basis                                                           4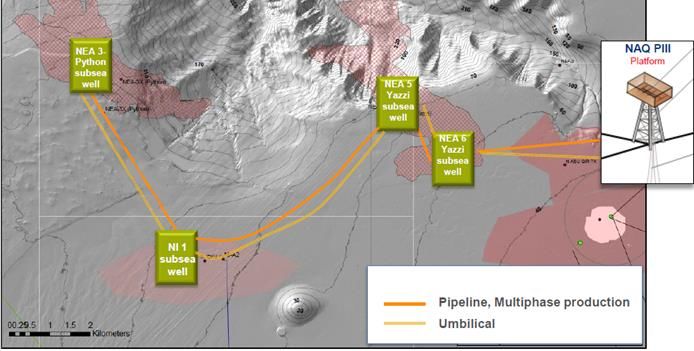
Edison E&P Portfolio Overview
    292 mmboe W.I. 2P                                             More than 75%
                                          c. 100 E&P Licenses                         c. 280 Employees         $434 MM 2018 EBITDA
        Reserves                                                Operated Production

UK                                                                                                 Norway
• 7 non-operated licenses (both producing                                                          • 2 recently FID approved development
  and exploration)                                                                                   projects in Norway (first production in
• 4 mmboe W.I. 2P reserves                                                                           2020 from Dvalin)
• Glengorm discovery in January 2019                                                               • Further exploration licenses in Norway
  (estimated >250 mmboe(1))                                                                          26 mmboe W.I. 2P reserves

Italy
                                                                                                   Croatia
• 59 licenses including 47 producing, 1
                                                                                                   • 1 operated license
    development and 11 exploration
                                                                                                   • 1 exploration / development project
• Key development project Cassiopea
                                                                                                   • 2 mmboe W.I. 2P reserves
• 85 mmboe W.I. 2P reserves

Algeria
• 1 non-operated producing license                                                                 Greece
   (Reggane Nord)                                                                                  • 2 non-operated exploration licenses
• 24 mmboe W.I. 2P reserves

Egypt
• 1 key operated producing gas field (Abu
  Qir)
                                                                                                   Israel
• 1 key operated development (NEA)
                                                                                                   • 1 operated exploration license
• 4 exploration licenses, with 2 in the
  Eastern Mediterranean Sea
• 152 mmboe W.I. 2P reserves

                    Source: Company information, CPR
                    1.    On a gross basis
5                                                                                                                                          5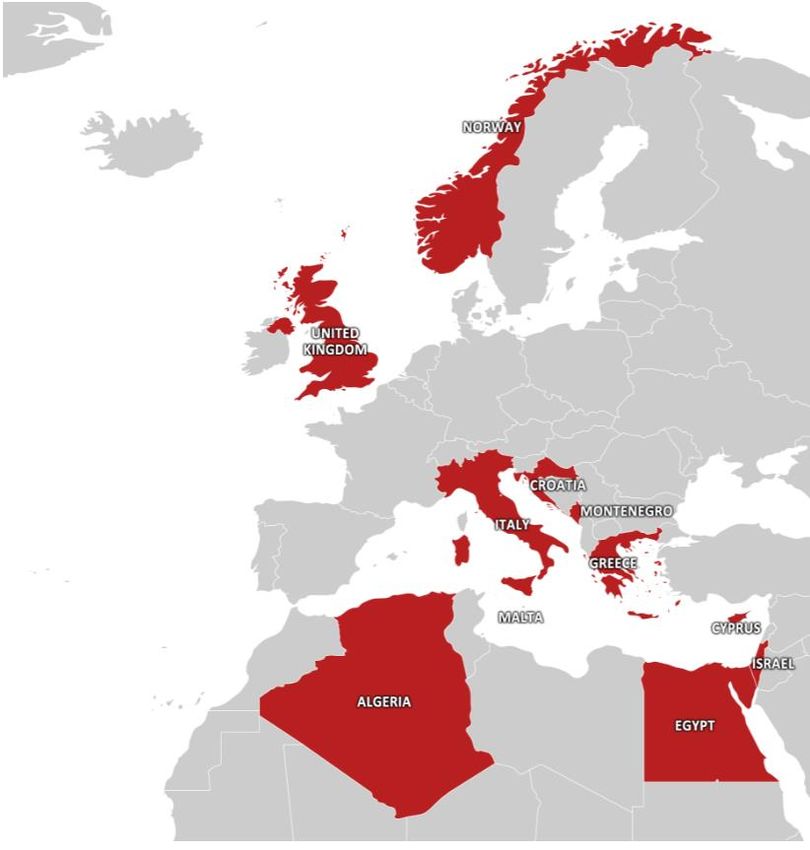
Creating a Material Mediterranean-Focused Player… (1)

                                  Growth story, focused on developing                                   Immediate cash flows & EBITDAX with
                                             new reserves                                                 incremental growth opportunities
    Reserves
    (mmboe)
     W.I. 2P

                                                                  347                                                  292
      Production
       (kboe/d)

                   4                                                                   69
      Revenue
       ($ MM)

                       90                                                                   621
      EBITDAX
       ($ MM)

                       52                                                                   434
      ($ MM)
       OCF

                            63                                                                    302
      ($ MM)
      Capex

                                                                              (2)
                                                                        495                                                       160

                                             Full-Cycle, Low Cost, Growth Oriented but with a Diverse Underlying Cash Flow Base

                        Source: Company information, CPR
                        1.    Metrics presented on a 2018 basis
6                       2.    Cash Capex of $294 MM                                                                                           6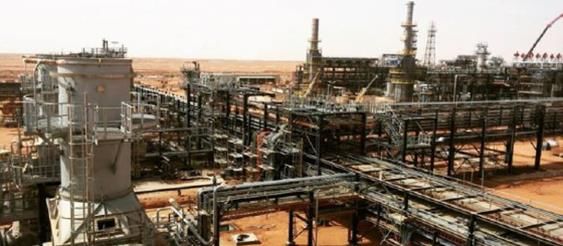
...With a Material, More Balanced and Sizeable Portfolio
                            Standalone 2P Reserves Breakdown                                                                                                                           Combined 2P Reserves Breakdown

                                                                                                                         Greece 14%
                                                                                                                         (50 mmboe)
                                                     Israel 86%
                                                                                                                                                                                                                                                                          Italy 13%
                                                   (297 mmboe)
                                                                                                                                                                                                                                                                        (85 mmboe)

                                                                                                                                                Combined
                                                                                                                                                                                         Israel 46%                               Egypt 24%
                                                                                                                                                                                       (297 mmboe)                               (152 mmboe)

                                                                                                                                                                                                                                                                               North Sea 5%
                                                                                                    Italy 29%

                                                                                                                                                                                                                                                                                (30 mmboe)

                                                                                                                                                                                                                                                                                                            Croatia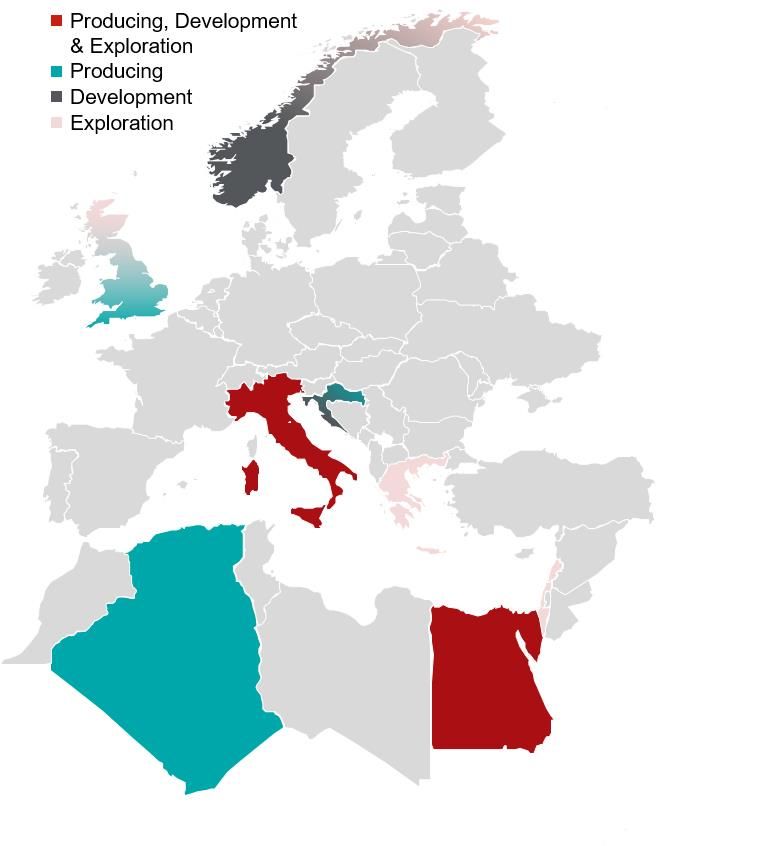
Enhancing Scale and Diversification of Combined Group
                                                                                   Clear Trajectory to 200 kboe/d(1) (2)
                     Enhancing Scale and Diversification of Combined Group
Combined 2019 - 2025 Production Profile by Country
(kboe/d)
                                                                                                                                    Edison E&P Investment Profile (2)
250
                                                                                                                                   ($ MM)             2019-22       2023-25    2026-Expiry

                                                                                                                                   Capex              c. 1,250        c. 150        c. 470

                                                                                                                                   Expl. (3)           c. 100           N/A           N/A

                                                                                                                                   Decom.                c. 75         c. 25        c. 715
200

150

100

    50

     0
         2019                   20202020                         2021 2021                 2022 2022        2023 2023           2024 2024                        2025 2025

                                                                 Assuming Karish & Tanin
                Greece               Israel                                                        Egypt    Italy          UK               Algeria               Norway             Croatia
                                                                 FPSO at Full Capacity

                         Sources: Company Information, CPR, Management Estimates
                         1.    Metrics presented on a net working interest basis
8                        2.    As per Management Estimates                                                                                                                                   8
                         3.    Represents committed exploration spend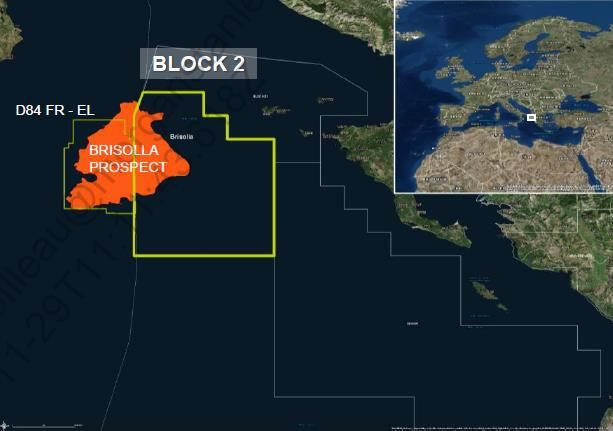
Karish & Tanin Update: On Track to Deliver First Gas in Q1 2021
 FID        (Q1 2018)

                                                                                                                                                  First Gas     On Track
FPSO Workstream

                 2018                                                          2019                               2020                        2021
                                                                              Hull and       Hull Sailaway         Hull and          FPSO
                             Topsides First                  Hull Keel                                                                                        Hookup of
 Hull First Steel Cut                                                         Topsides        from Cosco           Topsides      Sailaway from
                               Steel Cut                      Laying                                                                                           Risers
         Q4                                                                  Construction         Yard            Integration     Singapore
                                      Q4                        Q2                                                                                               Q1
                                                                               Q1 – Q4              Q4             Q1 – Q4             Q1

   Achieved                  Achieved
 November 2018             November 2018

 Drilling Workstream
                                                                               2019
                                                        Mobilise Stena       Drill Karish   Three Karish
                                                          DrillMAX              North        Main Wells
                                                               Q1             Q1 – Q2          Q1 – Q4

                                                        Rig Mobilised       Completed       Topholes Drilled
                                                        February 2019        April 30th       March 2019

Subsea and Onshore Workstreams
                                                                              2019                                2020
                                                                                               Pipeline          Onshore        Installation of
                                                                         Pipeline Beach
                                                                                             Installation        Facilities        Subsea
                                                                         Crossing at Dor
                                                                                            Karish to Dor      Commissioning    Infrastructure
                                                                            Q1 – Q2
                                                                                              Q3 – Q4            Q2 – Q4          Q1 – Q4

                        Source:   Company information

 9                                                                                                                                                                    9
Enhanced Free Cash Flow Generation Potential in the 2020s
                                                   Combined 2019E – 2025E Unlevered Free Cash Flow Profile (1)

       2019E                            2020E                                 2021E                                 2022E                                2023E                             2024E                     2025E

     Energean OCF                  Energean Capex                        Edison OCF                        Edison Capex                    Cumulative Unlevered FCF                      Cumulative Energean Standalone Unlevered FCF

               Sources: Company Information, CPR, Management Estimates
               1.    Energean operational and price assumptions as per latest disclosed CPRs (as of August 2018). Edison operational and price assumptions as per Management Estimates
10                                                                                                                                                                                                                               10
Consideration and Financing Structure
Consideration and Funding Equity Placing
• Total consideration − $850 MM
‒ $750 MM up front cash consideration • Equity placing of $265 MM
‒ $100 MM contingent cash consideration on Cassiopea first gas
• ABB announced 4 July 2019
(expected 2022, funded through free cash flow, potential asset
sales and / or incremental RBL / corporate debt capacity) • Settlement and admission of new shares expected to be on
‒ 8% profit oil royalty on discoveries made by upcoming drilling 8 July 2019 (T+2)
on NTO and NE Hap’y, funded through free cash flow from
these assets
• Funding − Consideration fully funded
Other Financing
‒ To be financed with a mix of new equity and bridge financing
• $600 MM Bridge Facility
Sources and Uses
‒ Refinancing H2 2019 using a combination of a Reserve
Up front Cash Consideration $750 MM Based Facility and Corporate Debt
Ongoing Funding Requirements $115 MM ‒ Expected Debt : EBITDAX expected not to exceed 2x for
more than 1 year (excl. Israel non-recourse project
Total Funding Requirements $865 MM
financing)
‒ Strong combined cash flow expected to support
Bridge Loan $600 MM deleveraging thereafter
Equity Placing $265 MM • Energean will evaluate the potential sale of non-core
assets
Total Funding Sources $865 MM
‒ Attractive, highly marketable North Sea portfolio
11 11Attractive Valuation with Significant Upside Potential
Material Potential Upside to Headline Figures
2.6 1.7x c.3 yrs. 18%
2018 Payback on 10yr estimated
AV/2P unlevered IRR (1)
AV/EBITDAX Production (1)
Accretive Acquisition Metrics
AV / 2018 EBITDAX (3) AV / 2P
(x) ($/boe)
40.0 30,0
12,0 Significantly accretive to current
15.0
EBITDAX multiple trading position 20,0
8,0 Accretive to current reserve
multiple trading position
4,0 10,0
0,0 0,0
Edison E&P Acquisition Excluding North Sea (2)
2.1 1.3x c.3 yrs. 21%
2018 Payback on 10yr estimated
AV/2P unlevered IRR (1)
AV/EBITDAX Production (1)
Sources: Company Information, CPR, Management Estimates, Capital IQ
1. As per Management Estimates
12 2. Assumes disposal of North Sea (UK and Norway) assets for $200 million 12
3. Ratio Oil excluded since not meaningfulEnhancing Newsflow Potential
Development and Exploration Timeline (1)
Country Asset Activity H2 2019E H1 2020E H2 2020E 2021E/22E
Exploration
1 – 1.5 Tcf GIIP (Karish North)
Additional Israeli Wells
6.3 Tcf and 101 mmbbls
(gross prospective resources)
Exploration targeting
Gal (Royee) (2)
71 mmboe (CoS: 19%)
Karish First Gas
Exploration targeting
Ameeq (NTO)
617 mmboe (CoS: 29%)
NEA Final Investment Decision FID
Exploration targeting
South Idku
8 mmboe (CoS: 22-26%)
Exploration targeting
Volans (NE Hap’y)
221 mmboe (CoS: 21%)
Abu Qir Infill Drilling
NEA First Gas
Rospo Sidetracks
Cassiopea First Gas
Gemini & Centauro Prospect Drilling
Epsilon First Oil
Exploration targeting
Echo (W. Patraikos)
71 mmboe (CoS: 21%)
Sources: Company Information
1. Excludes North Sea
13 2. As per Management Estimates 13Creating Value Through Application of our Core Principles
Mediterranean-Focused Gas-Weighted Diversified Scale Attractive Metrics
Acquisition of highly complementary full cycle Energean W.I. 2P Reserves Growth
portfolio enhances and diversifies Energean’s mmboe
639
existing assets
Maintains strategic East Mediterranean focus, while
materially enhancing production, reserves and
cash flow
Significant cost and expertise synergies, including
leveraging Prinos experience to create value from
mature assets 347
Replicate Karish & Epsilon development expertise to
improve returns from Edison’s growth projects
Disciplined capital allocation, reducing costs and
optimising returns and the portfolio through sale of
non-core assets
Focus on balanced-risk, infrastructure-led 41
51
30 30
exploration 2 5 7 11 17 24
Transfer of asset ownership from European utility to 2008A 2009A 2010A 2011A 2012A 2013A 2014A 2015A 2016A 2017A 2018A 2019E
E&P-focused management team
Energean Energean + Edison
Sources: Company Information, CPR
14 14Transaction Timing and Next Steps
4 July 19 Transaction Signing and Announcement
8 July 19 Admission of New Shares
H2 19 Regulatory Approvals and Partner Consents
H2 19 Reserve Based Facility and Corporate Debt Takeout of Bridge Loan
H2 19 Planned Disposal of Non-Core Assets
Q4 19 Publication of Circular and EGM
Q4 19 Publication of Enlarged Group Prospectus and Technical Readmission
Completion expected Q4 2019
15 15Asset Overview
Egypt: Optimising Cash Flow Generation at Abu Qir

                                            Transaction Drivers

                 • 100% operated position in one of Egypt’s largest producing gas
                   condensate fields
                 • Shallow water, low unit opex
                 • Long-term, well understood production with material reserves position                                                          NORTH ABU QIR

                                                                                                                                        NAQ-PI    NAQ-PIII
                 • Stable commercial terms, limiting volatility and exposure to commodity
                                                                                                                                                  NAQ-PII
                   price fluctuations
                      ― Gas sold at Brent linked gas price (2)
Description of        ― $3.50/mmbtu when Brent between $40/bbl and $72/bbl                                                               WAQ-PI        ABU QIR
  the Asset
                 • Identified infill drilling plus additional exploration opportunities that can                                                             AQ-PI

                   be developed quickly and cost effectively using existing infrastructure                                                         AQ-PII

                 • Team with 20+ years’ experience operating in Egypt with material
                   investments over the period and established relationship with Egyptian
                   authorities and regulators                                                                                      Meadia
                                                                                                                                 GasTerminal
                 • Improving receivables position and agreements in place to accelerate
                   recovery of overdue receivables through direct / independent marketing
                   of condensate and service cost offset

                 • W.I. 2P Reserves: 131 mmboe (86% gas)
     Key
  Operational    • 2019E W.I. Production: 50 kboe/d (86% gas)
 and Financial   • 2018 realised price: c.$26/boe
   Metrics
                 • 2019E unit opex: $3.0/boe (1)

                 Sources: Company Information, CPR
                 1.    $3.3/boe total unit production costs (including net opex, net tariffs, net royalties and net asset G&A)
17               2.    Price floor ($1.29/mmbtu) in place                                                                                                            17
Egypt: Developing Reserves at NEA
A Platform for Growth
NORTH IDKU
• 100% operated position
• Gas-condensate development generating possible synergies through NORTH EL AMYRIA
leveraging existing infrastructure at Abu Qir
• FID expected late 2019 (Edison’s control, first gas expected in 2021) NORTH IDKU
• Gas price: $4.60/mmbtu flat
Description of • Development plan is 4 shallow water subsea wells integrated with the
the Asset Abu Qir facilities
― Topside facilities to be hosted onboard North Abu Qir PIII Platform
and operated remotely from there Meadia
GasTerminal
― No expansion of existing onshore gas processing plant required
• Leverage Energean development expertise gained through Epsilon and
Karish + Tanin to further enhance returns
• W.I. 2P Reserves: 20 mmboe (88% gas)
Key • Expected 2022 unit opex: $1.5/boe
Operational
• Cumulative capex to start-up: c.$110 MM (1)
and Financial
Metrics • Development capex: $5.6/boe (1) (2)
• Asset IRR: 20% (1)
Sources: Company Information, CPR, Management Estimates
1. As per Management Estimates
18 2. Defined as development capex over W.I. 2P Reserves 18Egypt: Potential Exploration Upside
Near Term Drilling Targets
• North Thekah Offshore
― Edison E&P 85%, Ratio Oil 15% (subject to finalisation of farm down)
― Exploration well expected to spud Q4 2019
2.9
Billion boe net un-risked
― Primary target the Ameeq prospect, P50 7.4 Tcf GIIP (gross), a 4-way dip resources (1)
closure with a geological chance of success of 29%
• North East Hap’y
― ENI 70% (op.), Edison E&P 30%
― Exploration well expected to spud Q4 2019
― Target expected to be the Volans prospect, which has a currently estimated
P50 GIIP of 10 Tcf and a geological chance of success of 21% (2)
North
East
Hap’y North Thekah
Offshore
• South Idku
― Onshore Nile Delta
― Drilling expected Q3 2019
― Expected target is the Tucana prospect. P50 GIIP 130 Bcf for the Miocene
target and 48 mmboe for the Cretaceous with a geological chance of success
of 22% and 26%, respectively
― Possibilities of synergies with Abu Qir operations managed by personnel of
the operating company and Abu Qir onshore facilities
Sources: Company Information
1. On a net entitlement basis, excluding gross-up, as of 31 December 2018, considering 30% NEHO Edison share (post farm-out)
19 2. Preliminary assessment for Volans East 19Egypt: Why Invest Now?
Outstanding Arrears Owed to IOCs in Egypt Edison E&P Overdue Receivables in Egypt
$ Bn $ MM
4,7
4,2
4,0
324
2,4
221
200
144 147
1,2
0
2014 2015 2016 2017 2018 2019E 2014 2015 2016 2017 2018
Ministry Pledge to Fully Repay Receivables by YE 2019
IOCs’ arrears had totalled $6.3 billion before 2014. Since then it has decreased as the sector has repaid part of it to reach the current $1.2 billion
The Egyptian Ministry of Petroleum plans to settle total arrears for international oil companies (IOCs), which has reached $1.2 billion, by the end of
2019
Edison had $240 MM of outstanding receivables (of which $147 MM were overdue) at YE 2018
Edison has a number of contractual solutions with EGPC to ensure an effective collection policy, including:
Condensate proceeds
Lump-sum payments
Abu Qir payables offsetting
Local currency collection
Sources: Company Information, Bloomberg, Amwal Al Ghad
20 20Italy: Stable, Low-Cost Production
Transaction Drivers
CLARA NORTH WEST
W.I. (%) 49
• Second largest operator of oil and gas assets in
Operator ENI
Italy
’19 Prod (kboe/d) 3
• Stable, low-cost production
Reserves (mmboe) 6
• Material reserves
• Long-life country portfolio
SARAGO
― 13-year reserve life (1)
Description of W.I. (%) 85
the Asset • Marketing agreements in place with key long
term buyers (2) Operator Edison
’19 Prod (kboe/d) 1
― Vega: BP
Reserves (mmboe) 5
― Rospo Mare: Total
― Sarago: API
― Cassiopea / Clara: GSPA with Edison SpA CLUSTER ASSETS ROSPO MARE
(expected to remain in place) W.I. (%) Various W.I. (%) 62
Operator Various Operator Edison
’19 Prod (kboe/d) 4 Prod (kboe/d) 2
Reserves (mmboe) 21 Reserves (mmboe) 14
• W.I. 2P Reserves: 85 mmboe (57% gas)
Key • W.I. 2P Reserves (excl. Cassiopea): 54 mmboe VEGA CASSIOPEA
Operational (32% gas) W.I. (%) 60 W.I. (%) 40
and Financial • 2019E Production: 11 kboe/d (59% gas) Operator Edison Operator ENI
Metrics • 2018 realised price: c.$51/boe
’19 Prod (kboe/d) 1 ’22 Prod (kboe/d) (4) 13
• 2019E unit opex: $13.4/boe (3)
Reserves (mmboe) 8 Reserves (mmboe) 31
Sources: Company Information, CPR, Management Estimates
1. Excluding Cassiopea
21 2.
3.
Expected to be terminated but with scope to extend
$15.3/boe total unit production costs (including net opex, net tariffs, net royalties and net asset G&A)
21
4. First gas expected in 2022 as per Management EstimatesItaly: Developing Cassiopea
Transaction Drivers Sicilia
Licata
Gela
• One of the largest greenfield developments in Italy, medium-to-long
term growth 45 – 50m WD Export sealine
14” – 60 km RaGe
Cassiopea wells 1 & 2
• 40% W.I. (ENI 60%, Op.) 586m WD
Condotta
Description • FID early 2019 Cassiopea well 3
Description of
625m WD
of CROP
• First gas expected in 2022 (1)
Argo well 2 PREZIOSO
8th – 2,5 km 548m WD
the
the Asset
Asset
• 4 subsea well development (2 x new wells, 2 x re-completions), 8th – 1,5 km
8th – 3 km
optimised SPS sealine using existing facilities for shore approach, CASSIOPEA
MANIFOLD
wells control system & chemical injection from an existing ENI 660m WD
platform, onshore gas treatment, in synergy with RaGe operations Umbilical Canale di Sicila
New Pipeline
Existing Pipeline
• W.I. 2P Reserves: 31 mmboe (100% gas)
Key • Peak production: 14 kboe/d 3D seismic
Operational • Average 2022E-2028E unit opex: $3.2/boe
and Financial • Cumulative capex to start-up: c.$240 MM (1) Panda 1
Prezioso
oil field
Metrics • Development capex: $7.7/boe (1) (2) Panda W1
100
• Asset IRR: 23% (1)
Cassiopea 1dir
200
Argo 2
300
• 2 key gas prospects – Gemini & Centauro (expected in 2021 at a cost
Argo 1
Prospect Centauro 400
of c.$30 MM in that year) Vela 1
Prospect Gemini 500
Water depth
(m)
• Strong geological and geophysical similarity with Argo & Cassiopea G.R14.AG
600
Upside Lince 1
• Expected Pmean net resources: 9.7 mmboe
Potential PRODUCTION 700
• 90% geological chance of success LEASE
750
• Drilling expected 2021
• Low cost tie-back development G.R13.AG
Sources: Company Information, CPR, Management Estimates
1. As per Management Estimates
22 2. Defined as development capex over W.I. 2P Reserves 22Italy: Decommissioning
Total Italy undiscounted decommissioning spend through life-of-field of c. $540 MM
(of which c. $100 MM due over the next 10 years)(1)
Committed to optimising decommissioning activities and spend
1
• Proactive interaction with local government and regulation bodies to jointly design/review decommissioning
Regulations
regulations
2
• Scale achievement through grouping of assets in adjacent areas also promoting increased negotiation leverage in
Scale Effects
contracting activities
3
• Potential creation of solid partnerships for decommissioning activities (e.g ENI) further increasing scale potential
Potential Partnerships
and promoting transfer of decommissioning solutions
4
• Adoption of new technologies promoting innovative solutions to further optimise costs and maximise
New Technologies
operational excellence
5
• Continued effort in identifying potential alternative uses for existing platforms prioritising assets with higher cost
Re-use and Alternative Use
base
Sources: Company Information, Management Estimates
1. As per Management Estimates. Decommissioning provision of c. €390 MM in place as of year-end 2018
23 23Rest of the Portfolio – Algeria and Croatia
Reggane, Algeria Izabela, Croatia
Transaction Drivers Transaction Drivers
• 11% W.I. (Repsol 29%, Operator) • 70% W.I. (Edina 30%, Operator)
• Large, long-life asset operated by a reputable • Offshore gas asset located in the Croatian Adriatic Sea,
international oil and gas company, with stable cash flows with strategic new development optionality
• Self-funded asset with only infill drilling and maintenance • Strong partnership with the Croatian State company (INA)
Description of capex requirements Description of
• Commercial flexibility with existing export links to Italian
the Asset the Asset
• Significant infrastructure connected by pipeline to the and Croatian markets
existing national gas evacuation system
• Gas offtake agreement in place with Sonatrach
• Potential resource upside in the deeper Ordovician play
Key • W.I. 2P Reserves: 24 mmboe (100% gas) Key • W.I. 2P Reserves: 2 mmboe (100% gas)
Operational • 2019E W.I. Production: 5 kboe/d (100% gas) Operational
• 2019E W.I. Production:Rest of the Portfolio – UK North Sea and Norway
UK North Sea Norway
Transaction Drivers Transaction Drivers
• Portfolio of mature producing assets managed by • Attractive FID approved development projects in a strong
experienced operators, with balanced mix of oil and gas market, with established infrastructure
Description of
production • First oil expected in 2021 and 2020 (1) at Nova and Dvalin
the Asset
• Tie-back potential at Scott and Telford with respectively
Description of decommissioning optimisation • Partners: Wintershall DEA, Cairn, Spirit Energy and Petoro
the Asset • Decommissioning provision of c. €165 MM in place as of Nova Dvalin
year-end 2018
• W.I. 2P Reserves: 14 • W.I. 2P Reserves: 12
• CNOOC announced the largest UKNS gas discovery in 10
mmboe (34% gas) mmboe (96% gas)
years on the Glengorm prospect in January 2019 –
Key • Expected peak • Expected peak
potentially > 250 mmboe (Edison 25% non-operated)
Operational production: c.8 kboe/d production: c.5 kboe/d
and Financial • Expected 2022 unit opex: • Expected 2022 unit opex:
Key • W.I. 2P Reserves: 4 mmboe (18% gas)
Metrics $4.6/boe (3) $12.5/boe (3)
Operational • 2019E W.I. Production: 3 kboe/d (24% gas)
• Cumulative capex to start- • Cumulative capex to start-
and Financial • 2018 realised price: c.$79/boe up: c.$170 MM (1) up: c.$70 MM (1)
Metrics • 2019E expected average unit opex: $19.7/boe (2) • Asset IRR: 30% (1) • Asset IRR: 46% (1)
Sources: Company Information, CPR, Management Estimates
1. As per Management Estimates
25 2. $24.1/boe total unit production costs (including net opex, net tariffs, net royalties and net asset G&A) 25
3. $10.8/boe 2022 total unit production costs (including net opex, net tariffs, net royalties and net asset G&A) in NorwayRest of the Portfolio – Greece and Israel
Greece Israel
Transaction Drivers Transaction Drivers
• West Patraikos • Working interest: 20% (op.) (Ratio Oil 70%, Israel
- Working interest: 50% (Hellenic Petroleum 50% (op.)) Opportunity Energy Resources 10%)
- Shallow water block located in the Patraikos Gulf with • Deepwater block (1,100 – 1,600m) in prolific, world-class
identified oil prospectivity Levantine Basin located along the Egypt-Israel economic
border adjacent to North Thekah Offshore
- Mature prospect with potential recoverable resources
of 71 mmboe (CoS: 21%) - Expected synergies with North Thekah Offshore in the
West case of discovery
- Exploration drilling expected in H2 2020
Patraikos • Primary hydrocarbon play is Oligo-Miocene – Tamar sands
• Block 2
& along the Leviathan NE-SW trend
Block 2 - Working interest: 25% (Total 50% (op.), Hellenic
• Gal prospect is split into upper / middle and lower systems
Petroleum 25%)
with P50 GIIP of 3.5 Tcf (CoS: 19%)
- Deepwater block (800 – 1,200m) located 30km west of
• Exploration drilling expected in H2 2019(1)
Corfu island with high impact exploration target
- Brisolla prospect is a sizeable oil prospect with potential Royee
recoverable resources of 162 mmboe (CoS: 17%)
- Exploration drilling expected in H2 2020 Royee
GAL Prospect
Lower System
Sources: Company Information
1. As per Management Estimates
26 26Appendix
Edison Portfolio Overview – Egypt

Abu Qir                                                                                          NEA

                                                                                                                            NORTH IDKU

                                            NORTH ABU QIR
                                      NAQ-PI NAQ-PIII                                                                                 NORTH EL AMYRIA
                                             NAQ-PII

                                                                                                                         NORTH IDKU

                                      WAQ-PI     ABU QIR

                                                        AQ-PI

                                               AQ-PII

                                Meadia                                                                                         Meadia
                              GasTerminal                                                                                    GasTerminal

Abu Qir Overview                                                                                 NEA Overview
                •   Gas and condensate field located in the shallow water of Abu Qir Bay in
                    the Nile Delta
                                                                                                                 •   Gas and condensate concession located offshore the Western Nile Delta
 Description    •   One of the largest gas producing hubs in Egypt comprising 3 fields (Abu      Description
                    Qir, North Abu Qir and West Abu Qir)                                                         •   The two fields Python and Yazzi will be developed based on existing
 of the Asset                                                                                    of the Asset        Abu Qir gas infrastructure, generating significant synergies
                •   Efficient operating network of 6 interconnected platforms, linked to local
                    market via pipeline

                •   Working Interest: 100% (via Abu Qir Petroleum Co.)                                           •   Working Interest: 100% (via Petro Amriya Co.)
    Key         •   Operator: Abu Qir Petroleum Co.                                                  Key         •   Operator: Petro Amriya Co.
 Operational    •   WI 2P Reserves: 131 mmboe (86% gas) (3)                                       Operational    •   WI 2P Reserves: 20 mmboe (88% gas) (3)
and Financial   •   2019E Production: 50 kboe/d                                                  and Financial   •   Expected start-up year: 2022 (2)
                •   Cumulative Capex over 5 years: c.$350 MM (2)                                                 •   Cumulative capex to start-up: c.$110 MM (2)
  Metrics (1)                                                                                      Metrics (1)
                •   2018 year-end receivables balance: $240 MM                                                   •   Asset IRR: 20% (2)

                    Source: Company information, CPR, Management Estimates
                    Notes:
                    1.     Metrics presented on a net working interest basis
28                  2.     As per Management estimates                                                                                                                                 28
                    3.     Reserves computed as sum of production from 1 January 2019
Edison Portfolio Overview – Italy
Cassiopea Other Key Italy Assets (1)
CLARA NW
CASSIOPEA
SARAGO
CASSIOPEA_1DIR
ARGO_2
ARGO_1
ROSPO MARE
Cassiopea Overview Other Key Italy Assets Overview
• High growth offshore gas development asset located in the Strait of Assets Vega Rospo Mare Clara NW Sarago
Description Sicily
• Offshore oil field • Offshore oil field • Offshore oil field
• Asset developed with long-term strategic partner ENI Description • Gas field located
of the Asset located in the located in the
in the Adriatic Sea
located in the
of the Asset Sicilian Channel Adriatic Sea Adriatic Sea
• Optimised gas export sealine using existing facilities for shore approach
• WI: 60% • WI: 62% • WI: 49% • WI: 85%
• Working Interest: 40% • Partners: ENI • Partners: ENI • Partners: ENI • Partners: GasPlus
Key • Partners: ENI (60%) Key (40%) (38%) (51%) (15%)
• Operator: ENI Operational • Operator: Edison • Operator: Edison • Operator: ENI • Operator: Edison
Operational • WI 2P Reserves: • WI 2P Reserves: • WI 2P Reserves: • WI 2P Reserves:
• WI 2P Reserves: 31 mmboe (100% gas) (4) and Financial
and Financial • Expected start-up year: 2022 (3)
8 mmboe (100% 14 mmboe (100% 6 mmboe (100% 5 mmboe (4%
Metrics (2) • Cumulative capex to start-up: c.$240 MM (3) Metrics (2) oil) (4) oil) (4) gas) (4) gas) (4)
• 19’E Prod: 1 • 19’E Prod: 2 • 19’E Prod: 3 • 19’E Prod: 1
• Asset IRR: 23% (3) kboe/d kboe/d kboe/d kboe/d
Source: Company information, CPR, Management Estimates
Notes:
1. Vega located in the Southern coast of Sicily
29 2. Metrics presented on a net working interest basis 29
3. As per management estimates
4. Reserves computed as sum of production from 1 January 2019Edison Portfolio Overview – Norway
Nova Dvalin
NOVA DVALIN
PL 880
PL 796
Nova Overview Dvalin Overview
• Gas weighted offshore development asset with condensate and NGL
• Robust oil development project, with gas and NGL production
production, located on the margin between Halten and Donna terraces
Description • Balanced mix of oil and gas reserves Description
• Asset tied back to existing Heidrun platform (tie-in agreement in place)
of the Asset • Development supported by existing infrastructure (pipeline from Gjoa to of the Asset
• Available infrastructure capacity with multiple delivery options (export
Mongstad Terminal)
transportation agreements)
• Working Interest: 15% • Working Interest: 10%
Key • Partners: Wintershall DEA (45%), Cairn (20%) Spirit Energy (20%) Key • Partners: Wintershall DEA (55%), Petoro (35%)
• Operator: Wintershall DEA • Operator: Wintershall DEA
Operational Operational
• WI 2P Reserves: 14 mmboe (34% gas) (3) • WI 2P Reserves: 12 mmboe (96% gas) (3)
and Financial • Expected start-up year: 2021 (2) and Financial • Expected start-up year: 2020 (2)
Metrics (1) • Cumulative Capex to start-up: c. $170 MM (2) Metrics (1) • Cumulative Capex to start-up: c. $70 MM (2)
• Asset IRR: 30%(2) • Asset IRR: 46%(2)
Source: Company information, CPR, Management Estimates
Notes:
30 1.
2.
Metrics presented on a net working interest basis
As per management estimates
30
3. Reserves computed as sum of production from 1 January 2019Edison Portfolio Overview – UK
Scott & Telford Glengorm
GANNET D
GANNET G
GANNET A
CULZEAN
SCOTT &
TELFORD
SCOTT
PLATFORM GLENGORM
GANNET C
GANNET F
WEST
FRANKLIN
FRANKLIN
UK
Scott & Telford Overview Glengorm Overview
Assets Scott Telford
• CNOOC announced the largest UKNS gas discovery in 10 years on the
Glengorm prospect in January 2019
• Optimised assets with Telford strategically developed as a subsea Description
Description • Light oil prospect located in West Central Graben
tieback to Scott of the Asset • Alternatives being explored for potential tie-back to Culzean or Elgin-
of the Asset • Assets managed by experienced operator committed to the UK North Sea Franklin, amongst others
• Working Interest: 10% • Working Interest: 16%
Key • Partners: Nexen (42%), Total • Partners: Nexen (80%), Total (4%) Key • Working Interest: 25%
Operational (27%), Dana (21%) • Operator: Nexen Operational • Partners: Nexen (50%), Total (25%)
and Financial • Operator: Nexen • WI 2P Res.: 1 mmboe • Operator: Nexen
and Financial
• WI 2P Res.: 2 mmboe (10% gas) (3) (15% gas) (3) • Announced reserves by CNOOC at discovery: 250 mmboe (2)
Metrics (1) Metrics (1)
• 2019E Production: 2 kboe/d • 2019E Production: 1 kboe/d
Source: Company information, CPR, Management Estimates
Notes:
31 1.
2.
Metrics presented on a net working interest basis
Gross reserves
31
3. Reserves computed as sum of production from 1 January 2019Edison Portfolio Overview – Other Assets
Reggane Izabela
IZABELA
REGGANE
Reggane Overview Izabela Overview
• Offshore gas asset located in the Croatian Adriatic Sea, an established
• Large, long life gas development operated by a reputable international OECD hydrocarbon basin with favorable fiscal terms
Description oil and gas integrated company Description
• Strong partnership with the Croatian state-participated company (INA)
of the Asset • Self-funded asset with only infill drilling and maintenance capex of the Asset
requirements • Commercial flexibility with existing export links to Italian and Croatian
markets
• Working Interest: 11%
Key Key • Working Interest: 70%
• Partners: Sonatrach (40%), Repsol (29%), Wintershall DEA (20%)
• Partners: INA (30%)
Operational • Operator: Repsol Operational
• Operator: Edina
and Financial • WI 2P Reserves: 24 mmboe (100% gas) (3) and Financial • WI 2P Reserves: 2 mmboe (100% gas) (3)
• 2019E Production: 5 kboe/d
Metrics (1) Metrics (1) • 2019E Production:Edison 2019E-2025E Production Profile (1)
By Country
(kboe/d)
86% Gas 71% Gas 18% Gas
80 80 12
Egypt Italy UK
60 60 9
40 40 6
20 20 3
0 0 0
2019E 2020E 2021E 2022E 2023E 2024E 2025E 2019E 2020E 2021E 2022E 2023E 2024E 2025E 2019E 2020E 2021E 2022E 2023E 2024E 2025E
100% Gas 58% Gas (2) 100% Gas
40 40 4
Algeria Norway Croatia
30 30 3
20 20 2
10 10 1
0 0 0
2019E 2020E 2021E 2022E 2023E 2024E 2025E 2019E 2020E 2021E 2022E 2023E 2024E 2025E 2019E 2020E 2021E 2022E 2023E 2024E 2025E
Average % gas based on 2019E-2030E W.I. Production
Sources: CPR
1. Metrics presented on a net working interest basis
33 2. Based on average 2021E-2025E W.I. Production 33Edison 2019E-2025E Operating Cost Profile(1)
By Country
($ MM)
80 80 80
Egypt Italy UK
60 60 60
40 40 40
20 20 20
0 0 0
2019E 2020E 2021E 2022E 2023E 2024E 2025E 2019E 2020E 2021E 2022E 2023E 2024E 2025E 2019E 2020E 2021E 2022E 2023E 2024E 2025E
Vega Rospo Cluster Assets Scott Telford Other Assets Country-Level Items (2)
(2)
Abu Qir NEA Country-Level Items Other Assets Country-Level Items (2)
20 80
Algeria Norway Croatia
18
15 60
13
10 40
8
5 20
3
0 0
2019E 2020E 2021E 2022E 2023E 2024E 2025E 2019E 2020E 2021E 2022E 2023E 2024E 2025E 2019E 2020E 2021E 2022E 2023E 2024E 2025E
(2) (2) (2)
Reggane Country-Level Items Nova Dvalin Country-Level Items (2)
Izabela Country-Level Items
Corporate G&A (2) expected at c. $25 MM p.a. until termination of service contract (assumed in 2021) and c. $15 MM p.a. thereafter
Sources: Company Information, CPR, Management Estimates
1. Metrics presented on a net working interest basis
34 2. As per Management Estimates, includes net tariffs, net royalties and net asset G&A 34Edison 2019E-2025E Unit Operating Cost Profile (1)
By Country
($/boe)
20 40 100
Egypt Italy UK
15 30 75
Not meaningful
due to portfolio
10 20 50 ramp-down
5 10 25
N/M N/M N/M
0 0 0
2019E 2020E 2021E 2022E 2023E 2024E 2025E 2019E 2020E 2021E 2022E 2023E 2024E 2025E 2019E 2020E 2021E 2022E 2023E 2024E 2025E
20 80 100
Algeria Norway Croatia
15 60 75
Not meaningful Not meaningful
due to portfolio due to portfolio
10 40 50
ramp-up ramp-up
5 20 25
N/M N/M
0 0 0
2019E 2020E 2021E 2022E 2023E 2024E 2025E 2019E 2020E 2021E 2022E 2023E 2024E 2025E 2019E 2020E 2021E 2022E 2023E 2024E 2025E
Sources: Company Information, CPR, Management Estimates
1. Metrics presented on a net working interest basis
35 35Egypt: Key Fiscal Terms
Summary Illustrative Egyptian Concession Structure
A percentage of total production will be available to the contractor for reimbursement of
expenditures including exploration development and operating costs incurred (“Cost
recovery pool”)
Development and exploration expenditures are recoverable at 20% p.a.
Opex are recoverable in the year incurred and paid Oil & Gas Production
If recoverable costs exceed the amount of the Cost Recovery pool, the excess amount will
be carried forward to the next period and added to the recoverable costs until fully
recovered
If the cost recovery pool exceeds the amount of unrecovered recoverable cost, the excess
shall be either added to EGPC/EGAS’s share of production or split between the Contractor 35% 65%
and EGPC/EGAS
The cost recovery caps and excess cost splits between EGPC/EGAS and the Contractor for
each concession are as follows: Cost Recovery
Cost Pool
Profit Oil / Gas
Recovery
Concession Cost Recovery Cap State Share of Excess Cost
Abu Qir 70%
North El Amriya 100%
35% [30]% [70]%
North Idku 100%
Rosetta According to Concession Eligible Costs
Excess Cost
North East Hapy 30% 75% Contractor (2) EGPC
Recovery Pool
North Thekah Offshore 100% Cost Oil/Gas (1)
25%
North West Gindi 100%
South Idku 20% 100%
30% 70%
Taxes
Remaining production after cost recovery is shared between EGPC/EGAS and the Contractor Contractor EGPC (40.55%)
contractor according to a fixed split or on a sliding scale basis (driven by production and/or
Profit Brent price) as per the concession terms
Oil/Gas
Royalty & Paid by EGPC/EGAS on the Contractor’s behalf if applicable
Taxes
Sources: Company Information
1. Only eligible costs (according to PSA and approved by EGPC) can constitute cost oil/gas
36 2. The share of profits that accrues to the Contractor is shared amongst participating operators based on their relative share. Given that Edison owns 100% of Contractor rights in Abu Qir, it is entitled to 100% 36
of the profits accruing to the ContractorItaly: Key Fiscal Terms
Italy Concession Regime
A federal corporation tax (IRES) is levied at a rate of 24% Revenues
Deductible expenses to calculate the IRES taxable income include 10% of IRAP
Corporation paid Royalties
Tax (IRES) Losses may be carried forward to offset up to 80% of IRES taxable income,
and may be carried forward indefinitely IRES tax losses cannot be carried Operating Expenses
back
Operating Profit
Other Deductions
IRAP is a regional tax on productive activities
3.9% rate is generally applicable across mainland Italy and 5.12% rate is Depreciation Overhead
Regional applicable in Sicily(1)
Tax (IRAP) Labour costs are not deductible when calculating the taxable income for IRAP Net Financial Costs Losses Carried Forward
IRAP tax losses cannot be carried forward
10% of IRAP Deductible (Excluding) Labour Costs
Depreciation Unit of production methodology capped at fiscal D&A
Taxable Income IRES Taxable Income IRAP
Royalties are levied on the value of gross production according to the table 27.9% Marginal Tax
Royalties below IRES (24%) IRAP (3.9%)
After Tax Cash Flow
Italian Royalties
Mainland Sicily
Gas Liquids Gas Liquids
Onshore Offshore Onshore Offshore Onshore Offshore Onshore Offshore
Production threshold 25 MMsmc 80 MMsmc 20,000 tons 50,000 tons No Exemption No Exemption No Exemption No Exemption
Royalty Rate 10% 10% 10% 7% 20.06% 10% 20.06% 7%
Sources: Company Information
1. Average rate of 4.5% assumed for Edison given operations in different regions
37 37Algeria: Key Fiscal Terms
Reggane SPA
Share of Pi = K*a – b where K = 0.939
Investors
Total Production
Stepped calculation based on the daily production:
Pi= 0.939*a-b 1-Pi
Daily Production (boepd) a
Investor(1) Sonatrach
20,0000 and 40,0000 and 60,000 54% 100%
Exploration Costs Sonatrach is responsible for
the transportation cost of all
hydrocarbons produced from
40% the PRA area
Exploration Costs
Based on the R factor = V / I Reimbursement
Sonatrach is also responsible
V = cumulative indexed revenues 60% 40% for paying all taxes due on
Development Capex behalf of the Contractor
I = cumulative indexed expenditure
60% 40% The Contractor is responsible
Opex for financing all exploration
R factor b
and appraisal activities
B factor 100% undertaken in the PSA area
6 and < 8 0.17 * R – 1.02 start of production – share
associated with its original 25%
interest to be reimbursed over
>=8 34% 5 years while share associated
Cash flow Cash flow with its new 15% interest to be
Contractor Sonatrach reimbursed in the first year
Sources: Company Information
1. Edison’s share is 11.25%
38 38Greece / Israel: Key Fiscal Terms
Greece Israel
25% tax rate (20% income tax and 5% regional tax) Corporate Ordinary corporate income tax rate of 23% applies
(reduced from 24% in 2018)
Tax rate is fixed during the term of the contract (2013 Income
Parliament ratification) Tax
Corporate
Contractor is exempted from any general or special
Tax
taxes, dues, stamp duties, royalties, ordinary or New Taxation of Petroleum Profits Law in 2011 imposed
extraordinary contributions a progressive levy (Sheshinski levy) on profits derived
from petroleum reserves
The levy is determined by the ratio between the
Royalties will be based on Contractor’s annual gross cumulative revenues after deduction of the project
income, prior to the deduction of any expenses, expenses, royalties and a levy that was paid in previous
according to a sliding scale of average daily production years, and the overall investment in the exploration and
Oil Profits initial development of the deposit
Tax The levy is imposed once the levy coefficient reaches
Average Daily
Royalties 1.5 (repayment of the full investment plus 50%, before
Production
tax)
Up to 2,500 bbls 0% Initial levy rate is 20% of profits and rises gradually to a
Royalties
maximum of 46.8% of profits
From 2,501 to 5,000 bbls 3%
From 5,001 to 10,000 bbls 6%
Per the Petroleum Law 1952, a leaseholder is required
to pay royalties of 12.5% of the volume of petroleum
>10,0001 bbls 10% Royalties produced to the State
Sources: Company Information
39 39Summary of Certain Key Risks
This Appendix highlights certain key risks and uncertainties associated with the Acquisition, Edison E&P and the Enlarged Group. The risks and uncertainties described in this Appendix are neither exhaustive nor listed in order of
importance or likelihood. There may be additional risks and uncertainties not currently known or not currently considered material that may also have a material adverse effect on the Acquisition, the businesses of Edison E&P or the
Enlarged Group and may cause the price of the shares to decline.
Energean published its 2018 Annual Report on 18 April 2019 in which Energean has set forth, at pages 58-62 under the section titled “Principal risks and uncertainties”, the material existing and emerging risks it has identified to its
business and an investment in the Energean Shares. This Appendix should be read in conjunction with the information included in Energean’s 2018 Annual Report and Energean’s other public disclosures.
Summary of certain key risks associated with the Acquisition:
1. Failure to satisfy conditions precedent or obtain regulatory approvals could delay or prevent completion of the Acquisition: The Acquisition may not complete in a timely manner or at all due to delays in satisfying, or
failure to satisfy, relevant conditions precedent. These include necessary regulatory approvals in various jurisdictions (including the UK, Norway, Algeria, Egypt, Israel, France, Greece and Italy) in relation to change of control and
asset transfers. Even if regulatory approvals are received, such approvals may be delayed or subject to onerous terms and conditions. If any such approval is not obtained, then the Acquisition will not proceed.
2. Energean may fail to successfully integrate Edison E&P and to realise the expected benefits of the Acquisition: The Acquisition constitutes the largest acquisition Energean has undertaken to date. Risks to the
successful integration of Edison E&P with Energean’s existing business and the realisation of the expected benefits of the Acquisition include, among others, potential delays and additional costs in implementing changes to the
businesses, acquisition-related and integration costs exceeding Energean management’s expectations, exposure to unforeseen liabilities in connection with the Acquisition, disruptions to the ongoing operations of the businesses,
and failure to effectively execute post-Acquisition strategies. Successful integration of Edison E&P with Energean’s existing business will also depend on the ability of Energean management to bring together the cultures and
capabilities of both organisations in an effective manner, which will require the cooperation of Edison E&P's existing workforce. Edison E&P has also been part of the larger Edison corporate structure prior to the Acquisition and
will no longer be able to rely on intra-group arrangements after the expiration of an anticipated transitional services agreement and certain guarantees will need to be replaced after the completion of the Acquisition.
3. The contingent consideration is expected to be funded via free cash flow generated post 2021 and/or headroom under Energean’s proposed RBL / Corporate Debt Takeout of the Committed Bridge Loan Facility:
Energean has agreed to pay $100 million of contingent consideration following first gas production at Cassiopea, which is expected in 2022. Energean intends to fund this contingent consideration through free cash flow or via
headroom on the RBL /Corporate Debt Takeout of the Committed Bridge Loan Facility. There can be no assurance that there will be sufficient free cash flow generated to make such payment or indeed headroom available under
the Corporate Debt takeout of the Committed Bridge Loan Facility. In the event that Energean cannot fund the consideration, Energean may need to raise additional funding. There can be no assurance as to whether any such
additional funding could be raised in a timely manner or on commercially reasonable terms. Any such additional equity raise could result in dilution of shareholders.
4. The Acquisition has been part of a competitive process and there have been limitations on the amount of information provided to Energean: There can be no assurance that the due diligence conducted will have
revealed all relevant facts and financial information, including with respect to potential liabilities, necessary to evaluate the Acquisition.
5. The Acquisition is classified as a reverse takeover and will be subject to shareholder approval and re-admission of the Enlarged Group: Pursuant to LR 10 of the Listing Rules, the Acquisition is classified as a reverse
takeover and therefore is subject to the approval by Energean’s shareholders with the associated Circular expected to be published in Q4 2019. In addition, Energean will need to re-apply for admission of the Enlarged Group’s
shares to listing on the Official List of the FCA and to trading on the LSE and there is a risk that the FCA and LSE will not grant such re-admission.
6. The Acquisition will result in the enlarged group operating in countries in which Energean currently has less significant or no previous experience: A number of the jurisdictions in which Edison E&P operates
(including Egypt and Algeria) have significant social, economic and political risks. The Enlarged Group will thus be further exposed to the inherent risks of operating internationally, particularly in emerging markets. Edison E&P’s
operations, particularly in Egypt, have not been operated on Energean’s Health, Safety and Environment policy and other policies relating to operational integrity; adapting them to Energean’s policies may require additional
expenses and/or investment or result in operational disruption through the integration period. In addition, potential regulatory developments may substantially limit the further development of hydrocarbon-producing assets in
Italy.
7. Edison E&P’s planned capital expenditure profile on development projects is scheduled to take place concurrently with Energean’s proposed expenditure over 2019 – 2020: The Acquisition will result in a significant
increase in capital expenditure of the Enlarged Group since proposed expenditures by each of Energean and Edison E&P are scheduled concurrently. Edison E&P’s development spend on the Cassiopea and NEA assets will
take place as Energean increases capex on its Karish-Tanin development project ahead of first gas. Karish–Tanin is funded via project finance at the Energean Israel level and this facility is non-recourse to Energean. Funding of
Karish-Tanin is therefore separate from that of the Edison E&P portfolio. However, in the event of cost overruns on either Karish–Tanin or the Edison E&P portfolio assets, Energean may experience difficulties in financing these
increased amounts, which may result in additional funding requirements.
8. Energean will incur substantial increases in its indebtedness in connection with the Acquisition which it may fail to refinance or limit its financial flexibility: The Acquisition is to be financed with at least $600 million
of new debt financing. Although it is intended that the Acquisition debt financing will be refinanced in due course with a reserve based facility and / or corporate debt takeout, there can be no assurance whether and on what terms
Energean will be able to do so.
9. Proceeds: The Placing is not conditional on completion of the Acquisition and if the Acquisition does not complete Energean is under no obligation to return the proceeds of the placing to investors.
40 40You can also read