Action potential generation requires a high sodium channel density in the axon initial segment

Page created by Christian Clarke
 
CONTINUE READING
Action potential generation requires a high sodium channel density in the axon initial segment
ARTICLES

                                                                          Action potential generation requires a high sodium
© 2008 Nature Publishing Group http://www.nature.com/natureneuroscience

                                                                          channel density in the axon initial segment
                                                                          Maarten H P Kole1, Susanne U Ilschner1, Björn M Kampa1,4, Stephen R Williams1,2, Peter C Ruben1,3 &
                                                                          Greg J Stuart1

                                                                          The axon initial segment (AIS) is a specialized region in neurons where action potentials are initiated. It is commonly assumed
                                                                          that this process requires a high density of voltage-gated sodium (Na1) channels. Paradoxically, the results of patch-clamp studies
                                                                          suggest that the Na1 channel density at the AIS is similar to that at the soma and proximal dendrites. Here we provide data
                                                                          obtained by antibody staining, whole-cell voltage-clamp and Na1 imaging, together with modeling, which indicate that the Na1
                                                                          channel density at the AIS of cortical pyramidal neurons is ~50 times that in the proximal dendrites. Anchoring of Na1 channels
                                                                          to the cytoskeleton can explain this discrepancy, as disruption of the actin cytoskeleton increased the Na1 current measured in
                                                                          patches from the AIS. Computational models required a high Na1 channel density (~2,500 pS lm–2) at the AIS to account for
                                                                          observations on action potential generation and backpropagation. In conclusion, action potential generation requires a high Na1
                                                                          channel density at the AIS, which is maintained by tight anchoring to the actin cytoskeleton.

                                                                          Action potentials are the primary means of fast communication                            Here we describe studies of the distribution and properties of
                                                                          between neurons. Work dating back to the mid-1950s, using sharp                       Na+ channels in the AIS of cortical layer 5 pyramidal neurons.
                                                                          microelectrode recordings from the somata of cat spinal motoneurons,                  We conclude that the density of Na+ channels in the AIS is high
                                                                          indicated that action potentials are initiated in the initial segment of the          (on average B50-fold higher than the density at the soma and
                                                                          axon1–3. Similar conclusions were subsequently drawn from studies of                  proximal dendrites), and that it has been underestimated in patch
                                                                          other neuronal cell types in the CNS4. Experiments using simultaneous                 studies owing to tight anchoring of Na+ channels to the actin
                                                                          recordings from the soma and axon have provided direct evidence for                   cytoskeleton. In addition, using morphologically realistic models
                                                                          this proposal5–11, with recent studies in cortical layer 5 pyramidal                  we find that a high AIS Na+ channel density (B2,500 pS mm–2) is
                                                                          neurons indicating that the site of action potential initiation lies at the           required to account for experimental observations on the rate of rise
                                                                          distal end of the axon initial segment (AIS)12,13.                                    of axonal action potentials, as well as on action potential initiation
                                                                             Why action potentials are initiated in the axon is still unclear. Early            and backpropagation.
                                                                          theoretical studies proposed that this is the case because the density of
                                                                          Na+ channels in the AIS is high14,15. Consistent with this idea,                      RESULTS
                                                                          simulations using morphologically realistic models of cortical pyrami-                Patch experiments
                                                                          dal neurons required a high Na+ channel density in the AIS to replicate               We first attempted directly to assess the density of voltage-activated
                                                                          experimental findings from cortical neurons16,17. In addition to these                Na+ channels in the AIS of cortical layer 5 pyramidal neurons using
                                                                          theoretical studies, antibody staining for Na+ channels and associated                cell-attached patch-clamp recordings (Fig. 1a). We recorded fast,
                                                                          proteins indicates that the Na+ channel density in the AIS is high in                 transient inward Na+ currents in patches from the AIS (n ¼ 43 from
                                                                          many neuronal types11,18–24. By contrast, cell-attached and outside-out               35 neurons) up to the onset of myelination (B50 mm from the axon
                                                                          patch-clamp studies indicate that there are similar densities of                      hillock; range: 35–52 mm) and compared these to Na+ currents
                                                                          Na+ channels in the AIS and soma7,25. These electrophysiological                      recorded at the soma (n ¼ 19) under similar conditions (Fig. 1b).
                                                                          estimates led to the idea that rather than Na+ channel density, unique                The Na+ peak current in the AIS was similar to that observed at the
                                                                          gating properties of Na+ channels could underlie action potential                     soma, although there was a slight trend for larger Na+ currents at more
                                                                          generation. Consistent with this, it has been proposed that action                    distal locations in the AIS (Fig. 1b; slope of linear fit 0.08 pA mm–1,
                                                                          potential generation in the axon can be explained by the more                         n ¼ 62). Similar observations were made using outside-out patch-
                                                                          hyperpolarized voltage-dependence of activation of Na+ channels                       clamp recordings (data not shown). These data are consistent with
                                                                          in the AIS25.                                                                         previous observations in hippocampal subicular neurons using

                                                                          1Division of Neuroscience, John Curtin School of Medical Research, Australian National University, Garran Road, Canberra ACT 0200, Australia. 2Medical Research Council,

                                                                          Laboratory of Molecular Biology, Hills Road, Cambridge CB2 0QH, UK. 3School of Kinesiology, Simon Fraser University, 8888 University Drive, Vancouver, British Columbia
                                                                          V5A 1S6, Canada. 4Present address: Brain Research Institute, University of Zürich, Winterthurerstrasse 190, CH-8057 Zürich, Switzerland. Correspondence should be
                                                                          addressed to G.J.S. (greg.stuart@anu.edu.au).

                                                                          Received 15 October 2007; accepted 17 December 2007; published online 20 January 2008; doi:10.1038/nn2040

                                                                          178                                                                                     VOLUME 11      [   NUMBER 2    [   FEBRUARY 2008 NATURE NEUROSCIENCE
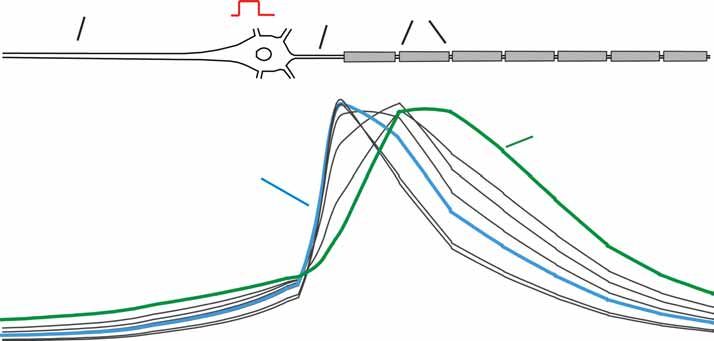
Action potential generation requires a high sodium channel density in the axon initial segment
ARTICLES

                                                                            a     Layer 5 neuron                b                                        Soma             AIS, 42 µm          Figure 1 Divergence of AIS Na+ channel density estimates using cell-
                                                                                                                                                                                              attached recording and Na+ channel antibody staining. (a) Schematic of the
                                                                                                                                               150
                                                                                                                                                                                              cell-attached recording configuration showing the location of somatic (black)
                                                                                                     Soma                                                                                     and AIS recording pipettes (red). (b) Plot of peak Na+ current in cell-attached

                                                                                                                Peak Na+ current (pA)
                                                                                                                                                                                              patches from the soma (black) and in the AIS (red; n ¼ 62, 46 neurons) at
                                                                                                                                               100                                5 pA        different distances from the axon hillock. Red line, linear fit to the data
                                                                                                                                                                              1 ms
                                                                                                      AIS                                                                                     (slope, 0.08 pA mm–1). Inset, examples of Na+ currents at the soma and
                                                                                                                                                                                              distal AIS activated by step depolarizations to B0 mV (75 mV positive to the
                                                                                                                                                50                                            resting potential) preceded by pre-pulses (100 ms duration) to B–100 mV
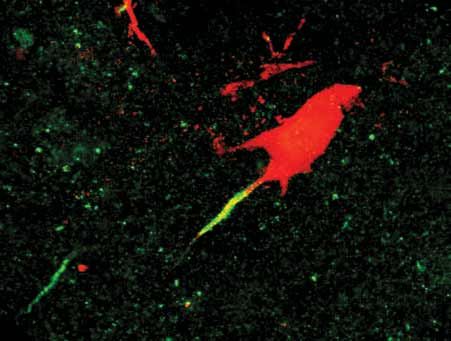
                                                                                                                                                                                              (25 mV negative to the resting potential). (c) Confocal image of a layer
                                                                                                                                                                                              5 pyramidal neuron filled with a red dye (Sulforhodamine 101) using a
© 2008 Nature Publishing Group http://www.nature.com/natureneuroscience

                                                                                                                                                    0
                                                                                                                                                                                              whole-cell recording pipette and subsequently stained using a pan-alpha Na+
                                                                                                     25 µm
                                                                                                                                                         Soma       20        40         60   channel antibody labeled with a green fluorescent tag (Alexa 488). (d) Plot of
                                                                                                                                                           Distance from hillock (µm)         optical density of sodium channel antibody staining against distance from the
                                                                            c                                   d                                                                             axon hillock (n ¼ 4). Optical density (green line) was base-lined at the axon
                                                                                                                                                                                              hillock, normalized to the maximum in the AIS, and averaged (± s.e.m.)
                                                                                                                                               1.0
                                                                            Sulforhodamine
                                                                                                                                                                                              between different neurons.
                                                                                                                      Optical density (norm)

                                                                            Pan-Na v

                                                                                                                                                                                              staining them with a pan-alpha antibody against Na+ channels
                                                                                                                                               0.5
                                                                                                                                                                                              (Fig. 1c). These experiments indicated that there was intense Na+
                                                                                                                                                                                              channel antibody labeling in the AIS region of layer 5 pyramidal
                                                                                                       10 µm                                                                                  neurons, with no observable staining of the somatic or proximal
                                                                                                                                               0.0
                                                                                                                                                                                              dendritic membrane. Na+ channel staining in the AIS reached a
                                                                                                                                                        Soma    5        10   15        20
                                                                                                                                                                                              maximum within 10 mm from the axon hillock, and was then constant
                                                                                                                                                           Distance from hillock (µm)
                                                                                                                                                                                              over the region of the AIS examined (Fig. 1d).

                                                                                                                                                                                              Can slow inactivation of Na+ channels explain the paradox?
                                                                          cell-attached patch-clamp     recordings7,
                                                                                                                  and with recent outside-out                                                 These data indicate a discrepancy between the patch experiments and
                                                                          recordings from cortical layer 5 pyramidal neurons25.                                                               the antibody staining. One possible explanation for this is that the Na+
                                                                                                                                                                                              channel density in the AIS is high, as observed in the antibody
                                                                          Antibody experiments                                                                                                experiments, but that these channels are not available owing to slow
                                                                          The finding that the Na+ channel density in the AIS is only marginally                                              inactivation26. To determine whether this was the case, we tested the
                                                                          higher than at the soma is puzzling. Modeling studies indicate that to                                              impact of increasing the pre-pulse duration on the peak Na+ current
                                                                          replicate experimental observations on axonal action potential initia-                                              observed in patches from the AIS (Supplementary Fig. 1 online).
                                                                          tion the density of Na+ channels in the AIS needs to be at least an order                                           Increasing the pre-pulse duration did not lead to an increase in peak
                                                                          of magnitude higher than at the soma14–17 (but see ref. 25). Further-                                               Na+ current, indicating that slow inactivation cannot explain the
                                                                          more, a number of immunocytochemical studies have shown that the                                                    observed difference in AIS Na+ channel density between the results
                                                                          intensity of Na+ channel staining in the AIS in many neuronal cell types                                            of patch and antibody experiments.
                                                                          is significantly higher than at the soma or in internodal regions11,18–24.
                                                                          To assess and localize Na+ channel staining in cortical layer 5 pyramidal                                           Whole-cell voltage-clamp experiments
                                                                          neurons, we filled individual neurons with a red fluorescent dye                                                    Although the patch experiments described above provide arguably the
                                                                          (Sulforhodamine 101) through the whole-cell recording pipette before                                                best available quantitative method for assessing functional Na+ channel

                                                                          Figure 2 Comparison of AIS and proximal apical dendritic whole-cell Na+
                                                                          current indicates a high Na+ channel density in the AIS. (a) Left, schematic
                                                                                                                                                                                              a                  ACSF
                                                                                                                                                                                                                                                                   b                                                 10

                                                                          diagram of the recording configuration in Na+-free ACSF showing the location                                         WC                                                  Apical
                                                                                                                                                                                                                                                                                           Amplitude (axon/apical)

                                                                                                                                                                                                                                                                                                                         8
                                                                          of the two ACSF application pipettes for applying Na+-rich ACSF to the apical
                                                                          dendrite (blue) and AIS (red), and the somatic whole-cell recording pipette.                                                                     50 pA
                                                                                                                                                                                                                                                                                                                         6
                                                                          Right, examples of whole-cell Na+ current evoked by voltage steps (middle),                                                                              5 ms
                                                                          which were preceded by brief (5 ms) applications (bottom) of Na+-rich ACSF                                              ACSF
                                                                                                                                                                                                                                                   Axon
                                                                                                                                                                                                                                                                                                                         4
                                                                          to the AIS (‘axon’, red) or the proximal apical dendrite (‘apical’, blue).
                                                                          (b) Average (± s.e.m.) ratio of AIS to proximal dendritic Na+ current                                                                                                      –10 mV
                                                                                                                                                                                                             25 µm            –70 mV                                                                                     2
                                                                                                                                                                                              Na+ free
                                                                          measured using somatic whole-cell recording. (c) Morphology used in                                                   ACSF
                                                                          simulations for selective activation of Na+ channels in the proximal apical                                                                         ACSF puff                                                                                  0
                                                                          dendrites (blue) or AIS, including some basal dendrites (red). (d) Examples
                                                                          of somatic whole-cell Na+ current obtained from the indicated membrane                                              c                    d                                             e
                                                                                                                                                                                                    Simulation       gNa, AIS = 45 pS      gNa, AIS = 1,500 pS
                                                                          regions using an AIS Na+ channel density (gNa, AIS) of 45 pS mm–2 (left) or
                                                                                                                                                                                                                                                                 Amplitude (axon/apical)

                                                                                                                                                                                                                                                                                           10
                                                                          1,500 pS mm–2 (right). (e) Ratio of AIS to proximal dendritic somatic Na+                                                                          Apical
                                                                          current versus the ratio of axonal to dendritic Na+ channel density in                                                                          Axon
                                                                          simulations with different AIS Na+ channel densities. Mean from three                                                                                                                                            5
                                                                                                                                                                                                                                   10 nA
                                                                          models with different morphologies (± s.e.m.). Data fitted with a linear
                                                                                                                                                                                                                              1 ms
                                                                          function y ¼ 0.12x + 1.4. The experimentally determined ratio (6.9) requires
                                                                          an axonal Na+ channel density B45 times greater than in the proximal                                                                                                                                              0
                                                                          dendrites (red dotted line).                                                                                                                                                                                                               0     40     80
                                                                                                                                                                                                           25 µm                                                                                                         Density
                                                                                                                                                                                                                                                                                                                     (axon/dendrite)

                                                                          NATURE NEUROSCIENCE VOLUME 11                                         [   NUMBER 2         [   FEBRUARY 2008                                                                                                                                          179
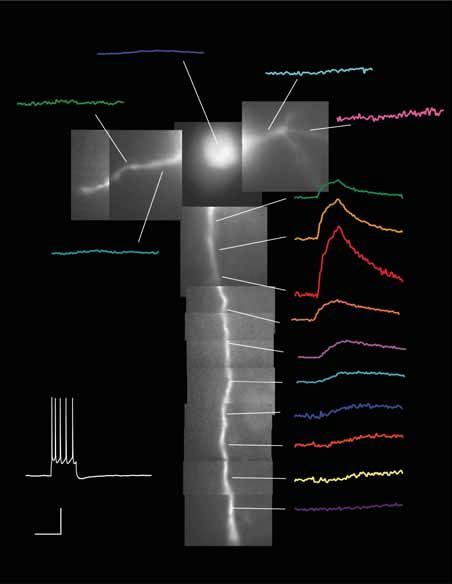
Action potential generation requires a high sodium channel density in the axon initial segment
ARTICLES

                                                                           a            Soma                     b                                            c                   20                                           e

                                                                                                                                                                  Peak ∆F/F (%)
                                                                                                 Basal
                                                                            Basal                                                     AIS, 25 µm
                                                                                                         Basal
                                                                                                                                                                                  10                                                                                                  5 µm
                                                                                                                                                                                                                                                                                     35 µm
                                                                                                                                 15                5% ∆F /F
                                                                                                         Axon                                                                                                                                                                        55 µm

                                                                                                                             5                                                          0     20    40    60     80 100
                                                                                    Basal                                                                                                   Distance from hillock (µm)
                                                                                                                        55                                                                                                                                     Myelin                2 mM
                                                                                                                                                                                                                                    +
                                                                                                                                                                                                                               ∆ [Na ]
                                                                                                                                 Soma
                                                                                                                                                              d                                                                                                      Soma

                                                                                                                                                              Rise ∆F/F (%) s–1
                                                                                                                                                                                  100
© 2008 Nature Publishing Group http://www.nature.com/natureneuroscience

                                                                                                                                                   200 ms
                                                                                                                                                   20 mV                           50                                                                                       500 ms   20 mV
                                                                                                                 Soma                                                                                                               V
                                                                                 10% ∆F/F                                                           400 pA
                                                                                 10 µm                           I                                                                  0
                                                                            0.5 s                                                                                                                                                    I
                                                                                                                                                                                        0     20    40    60     80 100
                                                                                                                                                                                            Distance from hillock (µm)

                                                                          Figure 3 Changes in intracellular Na+ during action potentials are                                                   +
                                                                                                                                                                                           [Na ]i (mM)
                                                                          largest in the AIS. (a) Fluorescent image (montage) of a layer 5                                            10
                                                                                                                                                                                        f     15       20              100/100      75/75   g
                                                                          pyramidal neuron filled with the Na+-sensitive dye SBFI (1 mM), with                                                                         200/45       135/45
                                                                          examples of the change in SBFI fluorescence at the indicated                                                                          25

                                                                                                                                                                                                                                         Na+ influx (AIS/dendrite)
                                                                                                                                                                  Soma
                                                                          locations (colored traces) during action potentials (bottom, left).                                       0
                                                                                                                                                                                                                20

                                                                                                                                                                                                         Distance (µm)
                                                                          (b) Expanded and aligned changes in SBFI fluorescence at the
                                                                                                                                                                                                                15
                                                                          indicated locations (top) during action potentials (middle) evoked                                       20
                                                                                                                                                                    AIS                                         10
                                                                          by somatic current injection (bottom). (c) Peak change in SBFI
                                                                          fluorescence (DF/F) in the axon versus distance of the recording site                                    40                            5
                                                                          from the axon hillock. (d) Initial rate of rise in SBFI fluorescence in                 Myelin                                         0
                                                                          the axon versus distance of the recording site from the axon hillock.                                       0      1       2    3         0 20 40 60 80 100
                                                                                                            +
                                                                          (e) Simulation of changes in Na concentration at the indicated                                                     Time (s)
                                                                                                                                                                                                                       +
                                                                                                                                                                                                                     Na density (AIS/dendrite)
                                                                          locations (top) during action potentials (middle) evoked by somatic
                                                                          current injection (bottom). Note the similarity with b. (f) Na+ concentration (color coded) in the AIS versus both distance from hillock and time. (g) Ratio of the
                                                                          change in Na+ concentration (normalized to baseline) in the AIS divided by that in the proximal basal dendrites in models with different AIS-to-proximal basal
                                                                          Na+ channel densities. Models with the indicated somatic-to-dendritic Na+ channel density (in pS mm–2) were used (different symbols). The experimentally
                                                                          determined AIS-to-basal dendrite (DF/F) ratio (B12) requires an axonal Na+ channel density B30 times that in the proximal dendrites (dotted line).

                                                                          density, given the contrasting results from the antibody studies we were                                currents had similar amplitudes (Fig. 2d, left; AIS/apical ¼ 1.1). We
                                                                          concerned they might have underestimated the Na+ channel density.                                       obtained larger somatic Na+ currents during simulation of local
                                                                          We therefore designed a method for assessing Na+ channel density in                                     applications of Na+-rich ACSF to the AIS only if the Na+ channel
                                                                          different regions of the neuron while recording in the whole-cell                                       density in the AIS was substantially increased. For example, an AIS Na+
                                                                          configuration (Fig. 2a). In these experiments, we bathed neurons in                                     channel density of 1,500 pS mm–2, with a uniform somato-dendritic
                                                                          a Na+-free solution and then puffed normal Na+-rich extracellular                                       dendritic density of 45 pS mm–2, led to 8.3-fold larger somatic Na+
                                                                          solution (ACSF) alternatively onto the AIS and the proximal apical                                      currents (Fig. 2c,d, right). To rule out bias we averaged the
                                                                          dendrites (B50 mm from the soma). Depolarizing voltage steps from                                       relative increase in AIS compared to proximal apical Na+ current
                                                                          –70 mV to –10 mV, administered through the somatic whole-cell                                           (AIS/apical) in models with three different morphologies and plotted
                                                                          recording pipette, were used to activate voltage-gated Na+ channels. To                                 this against the AIS Na+ channel density (Fig. 2e, n ¼ 3). Using the
                                                                          minimize diffusion of ACSF away from the location of the puffer                                         experimentally obtained peak amplitude ratio of 6.9, we estimate that
                                                                          pipette, we applied Na+-rich ACSF for brief periods (5 ms) just before                                  the Na+ channel density in the AIS is approximately 45 times that in the
                                                                          the onset of voltage steps (Fig. 2a). These experiments revealed that the                               proximal dendrites (Fig. 2e, red line).
                                                                          somatic whole-cell Na+ current was significantly larger during applica-
                                                                          tion of Na+-rich ACSF to the AIS than during similar applications to                                    Sodium imaging experiments
                                                                          the proximal apical dendrites. Within individual cells, the application                                 We next used Na+ imaging to investigate Na+ channel activation in the
                                                                          of Na+-rich ACSF to the AIS led to somatic Na+ currents that were on                                    AIS. We filled layer 5 neurons with the Na+-sensitive dye SBFI (1 mM)
                                                                          average 6.9 ± 1.6 times those observed after the application of Na+-rich                                and imaged changes in intracellular Na+ during action potential trains
                                                                          ACSF to the proximal apical dendrites of the same neurons (Fig. 2b;                                     evoked by somatic current injection (Fig. 3a). Consistent with earlier
                                                                          n ¼ 7; P o 0.01).                                                                                       work in cerebellar Purkinje neurons27, changes in SBFI fluorescence
                                                                             We used computer simulations to determine whether these data can                                     during action potentials were largest in the axon (Fig. 3a–c), with the
                                                                          be explained by a difference in Na+ channel density in the dendrites and                                greatest change occurring in the middle of the AIS, approximately
                                                                          the AIS. These simulations included Na+ channel models based on                                         25 mm from the soma (Fig. 3c). This site also corresponds to the
                                                                          experimentally determined gating properties of somatic and AIS Na+                                      location where changes in fluorescence had the fastest initial rate of rise
                                                                          channels (Supplementary Fig. 2 online). We simulated local applica-                                     (Fig. 3d), indicating that the AIS represents the primary site of Na+
                                                                          tion of Na+-rich ACSF by including Na+ channels in all segments (both                                   influx during action potential trains, and that changes in fluorescence
                                                                          axonal and dendritic) within a circular area (diameter B30 mm)                                          at more proximal and distal axonal locations are due to diffusion of
                                                                          centered on the AIS or proximal apical dendrite (Fig. 2c; red and                                       Na+ from this site. We found little if any fluorescence change at the
                                                                          blue segments, respectively). When the Na+ channel density was uni-                                     soma or in apical or basal dendrites (Fig. 3a,b). Comparison of the
                                                                          form (45 pS mm–2) at both locations, the somatic whole-cell Na+                                         SBFI signal in the AIS 25 mm from the soma with that in basal dendrites

                                                                          180                                                                                                      VOLUME 11         [   NUMBER 2        [   FEBRUARY 2008 NATURE NEUROSCIENCE
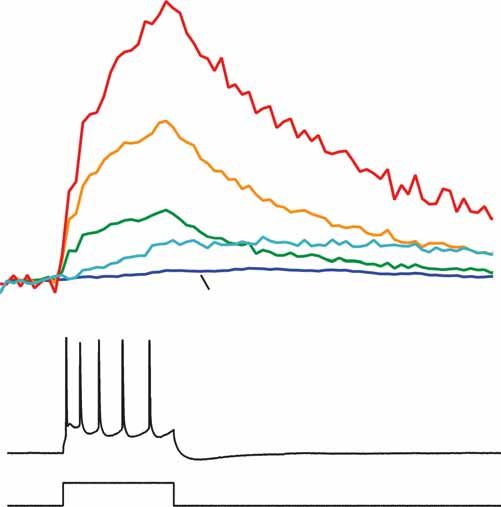
Action potential generation requires a high sodium channel density in the axon initial segment
ARTICLES

                                                                                                                                                      Soma                                                                                                           Figure 4 The actin cytoskeleton influences
                                                                           a                                   Control                  ***                                         b                                      Cyt B
                                                                                                                                                                                                                           Cyt B                                     AIS Na+ channel density and action potential
                                                                                                               Cyt B                                             Control
                                                                                                               Cyt B
                                                                                                                                                                                                                           + phalloidin                              properties. (a) Left, peak Na+ current evoked by
                                                                                                       80

                                                                                                                                                                                        Soma AP threshold (∆mV)
                                                                                                                                                                Cyt B                                                                                                steps to 0 mV in cell-attached recordings from the
                                                                                                               + phalloidin                                                                                           **
                                                                               Peak Na+ current (pA)

                                                                                                                                                                                                                  4
                                                                                                                                                          AIS                                                                                   Cyt B                distal AIS (430 mm from the soma), soma and
                                                                                                       60
                                                                                                                                                                                                                                                                     apical dendrite (5–140 mm from the soma) under
                                                                                                                                                                                                                            n.s.
                                                                                                                                                                  Control                                                                                            control conditions (open bars), 25 min after
                                                                                                       40                                                                                                                                                            intracellular application of cytochalasin B (Cyt B;
                                                                                                                                                                  Cyt B                                           2
                                                                                                                                                                  + phalloidin                                                                                       20 mM, gray bars), and 25 min after co-application
                                                                                                       20                                                                                                                                                            of Cyt B and phalloidin (50 mM, dark gray bars).
                                                                                                                                                                                                                                                Cyt B + phalloidin
                                                                                                                                                                Cyt B                                                                                                Right, example Na+ currents recorded at the soma
© 2008 Nature Publishing Group http://www.nature.com/natureneuroscience

                                                                                                        0                                                                   10 pA                                 0                                        20 mV
                                                                                                            Dendrite    Soma              AIS                                                                                                         0.5 ms
                                                                                                                                                                                                                                                                     (top) or AIS in the indicated conditions (average of
                                                                                                                                                                        1 ms
                                                                                                                                                                                                                                                                     8–20 sweeps). (b) Left, bar plot of the change in
                                                                           c                                                                                                                                               d                                         somatic action potential threshold after application
                                                                                                                                                                                                                                                1.0
                                                                                                                                                                                                                                                                     of Cyt B (20 mM, gray) and after application of

                                                                                                                                                                                                                               dV/dt (kV s–1)
                                                                                                            Soma                Cyt B
                                                                                                                                                                                                                                                                     Cyt B with phalloidin (50 mM, dark gray). Right,
                                                                                                                                                                                                                                                           **        examples of action potentials recorded at the soma
                                                                                                                                                                                                                                                0.5                  under the indicated conditions. (c) Left, somatic
                                                                                       –75 mV                                                                                                                                                                        (top) and axonal action potentials (bottom;
                                                                                                                                                                                                                                                                     100 mm from the hillock) recorded before (black)
                                                                                          l                                                                                                                                                     0.0                  and after (blue) perfusion with Cyt B (30 mM).
                                                                                                                                                                                                                           e                                         Action potentials evoked by a 2 nA current
                                                                                                                                                                                                                                                                     injection at the soma (middle). Right, first
                                                                                                                                                                                                                                                1.0

                                                                                                                                                                                                                               dV/dt (kV s–1)
                                                                                                                                                                                                                                                           **        derivative of the somatic (top) and axonal (bottom)
                                                                                                            Axon              Cyt B
                                                                                                            100 µm                                                           *                                                                                       action potential in control (black) and Cyt B (blue).
                                                                                                                                              10 mV                                 0.1 kV s–1                                                                       Note the significant reduction in rate-of-rise
                                                                                                                                              1 ms                                                                                              0.5
                                                                                                                                                                                    0.5 ms
                                                                                                                                                                                                                                                                     of axonal action potential in Cyt B (asterisk).
                                                                                      –74 mV                                                                                                                                                                         (d,e) Bar plots of somatic (d) and axonal (e)
                                                                                                                                                                                                                                                0.0                  action potential rate-of-rise in control (open)
                                                                                                                                                                                                                                                                     and after Cyt B (filled; P o 0.001, n ¼ 7).

                                                                          at a similar distance from the soma indicated that the change in                                                                                 density of Na+ channels in all dendritic compartments, and determined
                                                                          fluorescence in the AIS was approximately 12-fold larger than in                                                                                 the relationship between the change in Na+ concentration (divided by
                                                                          proximal basal dendrites (axon: 18.5 ± 4.7% DF/F, n ¼ 3, compared                                                                                the baseline) in the AIS and that in the proximal basal dendrites
                                                                          to basal dendrites: 1.5 ± 0.8% DF/F, n ¼ 4). This difference cannot be                                                                           (Fig. 3g). To obtain repetitive firing in these models we needed to
                                                                          accounted for by differences in surface to volume ratio, as the diameter                                                                         increase the somatic and/or dendritic Na+ channel density above
                                                                          of proximal basal dendrites is similar to that of the AIS (Supplemen-                                                                            previous estimates5. Similar to the simulations used to mimic
                                                                          tary Fig. 3 online). Identical results to those described above with SBFI                                                                        the whole-cell voltage-clamp data (Fig. 2e), we found that the
                                                                          were obtained using the Na+-sensitive fluorescent dye sodium green                                                                               experimentally observed 12-fold larger DF/F in the AIS compared
                                                                          (n ¼ 8; data not shown).                                                                                                                         to that seen in the proximal basal dendrites required an AIS Na+
                                                                             We performed computer simulations of the Na+ influx to determine                                                                              channel density that was approximately 30-fold higher than that
                                                                          whether the observed changes in Na+ concentration were consistent                                                                                in the proximal basal dendrites (Fig. 3g). This conclusion was
                                                                          with a high density of Na+ channels in the AIS. Similar to experimental                                                                          robust for a range of somatic and dendritic Na+ channel density
                                                                          data, models with a high Na+ channel density in the AIS (3,000 pS mm–2)                                                                          combinations (Fig. 3g).
                                                                          had the largest Na+ influx in the middle of the AIS, with smaller and
                                                                          slower rises in Na+ at more proximal and distal axonal sites (Fig. 3e;                                                                           Role of the cytoskeleton
                                                                          compare with Fig. 3b). We observed only very small increases in Na+ at                                                                           The antibody, whole-cell voltage-clamp and Na+ imaging experiments
                                                                          the soma and myelinated axonal regions (Fig. 3e). To obtain more                                                                                 described above provide evidence that patch-clamp recordings
                                                                          detailed insights into the space- and time-dependent changes in Na+                                                                              significantly underestimate the Na+ channel density in the AIS (by
                                                                          influx we plotted Na+ concentration during a train of action potentials                                                                          30–45-fold). As voltage-activated Na+ channels are known to interact
                                                                          against both time and space in the AIS (Fig. 3f). This analysis shows                                                                            with the actin cytoskeleton by binding to Ankyrin G19, which is
                                                                          that the largest Na+ influx occurs in the AIS 20–40 mm from the axon                                                                             localized to the AIS20, we hypothesized that this discrepancy can be
                                                                          hillock. These simulations (Fig. 3e,f) using a high AIS Na+ channel                                                                              explained if anchoring of Na+ channels to the cytoskeleton prevents
                                                                          density closely mimicked the experimentally observed changes in SBFI                                                                             them being drawn into the tip of the patch pipette. To test this theory
                                                                          fluorescence (Fig. 3a–d).                                                                                                                        we depolymerized actin filaments using either latrunculin B or
                                                                             We next quantified the Na+ channel density that was required to                                                                               cytochalasin B, which increase Na+ channel mobility in the AIS28.
                                                                          mimic the observed 12-fold larger DF/F in the AIS compared to the                                                                                We made whole-cell recordings from the soma of layer 5 neurons using
                                                                          proximal basal dendrites. As the dendritic Na+ channel density in the                                                                            a pipette solution that included latrunculin B or cytochalasin B (20 mM;
                                                                          basal dendrites is unknown, we used cell-attached recordings to assess                                                                           Sigma-Aldrich). After allowing B25 min for diffusion into the neuron,
                                                                          the Na+ channel density in the proximal basal dendrites (6–35 mm from                                                                            we began cell-attached recordings. In some cases we obtained cell-
                                                                          the soma; n ¼ 5). These experiments indicated that the apparent Na+                                                                              attached recordings from the same axonal site (±5 mm) before and after
                                                                          channel density in the proximal basal dendrites is low and similar to                                                                            depolymerization of actin filaments. Internal perfusion of layer 5
                                                                          that observed at the soma (Supplementary Fig. 3). We next varied the                                                                             pyramidal neuron somata with actin depolymerizing agents signifi-
                                                                          density of Na+ channels in the AIS while maintaining a constant low                                                                              cantly increased the amplitude of Na+ currents recorded in the AIS

                                                                          NATURE NEUROSCIENCE VOLUME 11                                               [   NUMBER 2       [   FEBRUARY 2008                                                                                                                            181
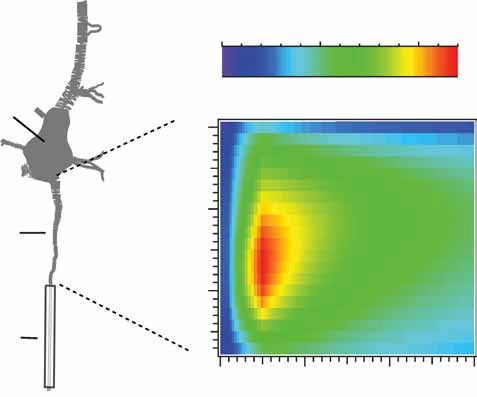
Action potential generation requires a high sodium channel density in the axon initial segment
ARTICLES

                                                                                                                                                                                          somatic action potential threshold indicated
                                                                             a                                                           b

                                                                                                                                             Max. rate-of-rise (kV s–1)
                                                                                                                                                                          1.5             that depolymerization of the actin cytoskele-
                                                                                    Whole-cell
                                                                                  AIS, 45 µm                                                                                              ton significantly depolarized the action poten-
                                                                                                                                                    1.0
                                                                                                                                                                                          tial threshold by 4.3 ± 0.6 mV (Fig. 4b; n ¼ 7;
                                                                                                      10 mV
                                                                                                                               0.5 kV s
                                                                                                                                        –1
                                                                                                                                                    0.5                                   P o 0.016), and this effect was blocked by
                                                                                                                               1 ms
                                                                                                                                                                                          inclusion of the actin stabilizer phalloidin
                                                                                    –76 mV                                                          0.0
                                                                                                                                                                                          (50 mM) with cytochalasin B in the whole-
                                                                                                2 nA                                                     0        20         40        60
                                                                                      l                                                                    Distance from hillock (µm)     cell recording solution (Fig. 4b; n ¼ 8;
                                                                                                                                                                                          P 4 0.08). The rheobase current threshold
                                                                              c                                      4,000 pS µm
                                                                                                                                  –2       d
© 2008 Nature Publishing Group http://www.nature.com/natureneuroscience

                                                                                                                                                                                          for  action potentials was also increased from

                                                                                                                                              Max. rate-of-rise (kV s )
                                                                                                                                                                     –1
                                                                                                                                                    2.0
                                                                                                                           3,000                                                          325 ± 42 pA to 533 ± 66 pA (n ¼ 6;
                                                                                                                                                    1.5
                                                                                 Simulation                                                                                               P o 0.001). Similar results were obtained
                                                                                AIS, 45 µm                                                          1.0
                                                                                                                             2,000                                                        with latrunculin B (n ¼ 8; data not shown).
                                                                                                                                                    0.5                                   These findings are analogous to those
                                                                                                                                                    0.0                                   obtained in mice lacking cerebellar Ankyrin-
                                                                                –75 mV
                                                                                               2 nA                                                      0      2,000      4,000    6,000 G, where loss of Na+ channel clustering at the
                                                                                  l                                                                                           –2
                                                                                                                                                               gNa, AIS (pS µm )          AIS of Purkinje neurons leads to an increase
                                                                                                                                                                                          in the rheobase current needed to initiate
                                                                          Figure 5 Simulation of axonal action potential rate-of-rise requires a high Na+ channel density in the          action potentials19, and are consistent with
                                                                          AIS. (a) Left, example of an axonal action potential recorded in the AIS (45 mm from the hillock, blue),        the idea that disruption of the actin cyto-
                                                                          evoked by a 2-nA current injected into the soma (bottom). Right, first derivative of action potential
                                                                                                                                                                                          skeleton causes Na+ channels to move away
                                                                          voltage. (b) Axonal action potential rate-of-rise versus distance from the axon hillock. Data fitted with a
                                                                          logarithmic function. (c) Axonal action potentials (left) and the first derivative of action potential voltage  from the AIS, thereby raising the action
                                                                          (right) recorded in the AIS (45 mm from the axon hillock) in models with the indicated AIS Na+ channel          potential threshold.
                                                                          densities. (d) Plot of AIS Na+ channel density (gNa, AIS) versus axonal action potential rate-of-rise (45 mm       To investigate the effect of disruption of the
                                                                          from the axon hillock). Average from three models with different morphologies (± s.e.m.). Data fitted           actin cytoskeleton on axonal action potential
                                                                          with a linear regression (y ¼ 0.0003x + 0.23). Dotted line (red) shows the AIS Na+ channel density              properties, we made simultaneous whole-cell
                                                                          (B3,000 pS mm–2) required to reproduce an action potential rate-of-rise of 1.13 kV s–1 (the
                                                                                                                                                                                          recordings from the soma and proximal axon
                                                                          experimental average in the distal AIS).
                                                                                                                                                                                          blebs13 (110 ± 9 mm from the hillock; n ¼ 7).
                                                                                                                                                                                          In these experiments, both whole-cell record-
                                                                          (Fig. 4a). On average, the peak Na+ current recorded in cell-attached ing pipettes contained 30–60 mM cytochalasin B and action potentials
                                                                          patches from the distal AIS increased threefold (Fig. 4a; control: 19 ± were triggered by 2-nA step current injections at the soma. These
                                                                          2.5 pA (n ¼ 20) versus depolymerization: 57 ± 8.6 pA (n ¼ 14); experiments revealed that disruption of the actin cytoskeleton leads to a
                                                                          P o 0.001). This increase in peak Na+ current in the AIS was not due to small B9% change in somatic action potential rate-of-rise (Fig. 4c,d;
                                                                          a change in the voltage-dependence of activation or inactivation control: 686 ± 11 V s–1 versus cytochalasin B: 607 ± 14 V s–1) but a
                                                                          (Supplementary Table 1 online), and was blocked when the actin much larger B33% reduction in the rate-of-rise of axonal action
                                                                          stabilizer phalloidin (50 mM) was applied with cytochalasin B in the potentials (Fig. 4c,e; control: 1,186 ± 83 V s–1 versus cytochalasin B:
                                                                          whole-cell recording solution (Fig. 4a; n ¼ 12; P o 0.05). Actin 783 ± 76 V s–1; P o 0.05). As the action potential rate-of-rise (dV/dt) is
                                                                          depolymerization did not change the amplitude of Na+ currents in cell- directly related to the local Na+ channel density (dV/dt ¼ INa/Clocal;
                                                                          attached patches from either the soma (n ¼ 5) or proximal apical where INa is the current flowing through Na+ channels and Clocal is the
                                                                          dendrites (Fig. 4a; 5–140 mm from the soma, n ¼ 4; P 4 0.05). ‘local’ membrane capacitance), these data provide additional evidence
                                                                          Together, these results show that disruption of the actin cytoskeleton that disruption of the actin cytoskeleton leads to the movement of Na+
                                                                          leads to larger Na+ currents in patch recordings selectively from channels away from the AIS.
                                                                          the AIS. We interpret these data as indicating that anchoring of
                                                                          voltage-activated Na+ channels to the actin cytoskeleton inhibits Simulating axonal action potential rate-of-rise
                                                                          their detection in patch-clamp recordings from the AIS. Presumably What Na+ channel density is required in the AIS to reproduce experi-
                                                                          this is because Na+ channels are physically prevented from being mental observations on axonal action potential rate-of-rise? We quanti-
                                                                          drawn into the tip of the patch pipette during formation of the fied axonal action potential rate-of-rise in whole-cell recordings at
                                                                          membrane seal, analogous to the findings of Milton and Caldwell at different sites along the AIS (Fig. 5a,b). These experiments indicated
                                                                          the neuromuscular junction29.                                                          that axonal action potential rate-of-rise increases logarithmically with
                                                                              Previous work indicates that disruption of the actin cytoskeleton distance from the axon hillock (Fig. 5b). On average, the axonal action
                                                                          increases the mobility of Na+ channels in the AIS28, which is likely to potential rate-of-rise was 791 ± 67 V s–1 in the proximal AIS (1–15 mm
                                                                          lead to redistribution of Na+ channels to sites distant from the AIS. from the hillock; n ¼ 10) compared to 1,131 ± 32 V s–1 in the distal AIS
                                                                          Given that the AIS is the site of action potential initiation in layer 5 (35–52 mm from the hillock, n ¼ 17). We next generated models with
                                                                          pyramidal neurons12,13, Na+ channel redistribution away from this site different AIS Na+ channel densities to see what AIS density is required to
                                                                          would be expected to alter action potential properties. We therefore best fit the experimental data on axonal action potential rate-of-rise
                                                                          analyzed action potentials evoked by brief somatic current injections (Fig. 5c). Action potentials in these simulations were evoked by somatic
                                                                          (3 ms; 2–3 nA) immediately after establishing the whole-cell recording current injections and were recorded in the distal AIS, 45 mm from the
                                                                          configuration using pipettes with cytochalasin B, and compared them soma. These results, based on models with three different morphologies,
                                                                          with those recorded after 25 min (Fig. 4b). Disruption of the actin show that the rate-of-rise of action potentials in the distal AIS scales
                                                                          cytoskeleton did not influence somatic action potential peak amplitude approximately linearly with the AIS Na+ channel density, with an AIS
                                                                          or half-width (P 4 0.05; data not shown; n ¼ 7). However, analysis of Na+ channel density of B3,000 pS mm–2 required to generate action

                                                                          182                                                                                                   VOLUME 11   [   NUMBER 2   [   FEBRUARY 2008 NATURE NEUROSCIENCE
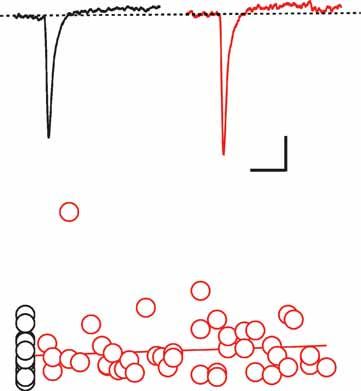
Action potential generation requires a high sodium channel density in the axon initial segment
ARTICLES

                                                                           a              Dendrite
                                                                                                        2 nA
                                                                                                                AIS    Node
                                                                                                                                                      b                                                           c
                                                                                                                                                                                                                                                                     3,000 pS µm–2
                                                                                                                                                                                                                                                                          2,000
                                                                                                                                                                                                   100 pS µm–2
                                                                                      0                                                                                       150
                                                                                                                                     500 pS µm   –2                                                 45 pS µm–2

                                                                                                                                                       Initiation site (µm)
                                                                                                                                                                                                                                                             10 mV            1,000
                                                                                                3,000 pS µm–2
                                                                                    –20
                                                                           V (mV)

                                                                                                                                                                                                                          Vm
                                                                                                                                                                              100
                                                                                    –40

                                                                                                                                                                                                                                                                                      500
                                                                                    –60
                                                                                                                                                                              50                                                                          –72 mV
© 2008 Nature Publishing Group http://www.nature.com/natureneuroscience

                                                                                               –200           0              200           400                                      0   1,000 2,000 3,000 4,000             2 nA                                                      1 ms
                                                                                                       Distance from hillock (µm)                                                        gNa, AIS (pS µm–2)

                                                                                                                                                                                                                        d                            60

                                                                                                                                                                                                                               Peak amplitude (mV)
                                                                          Figure 6 Simulation of action potential initiation and backpropagation requires a high Na+ channel density
                                                                          in the AIS. (a) Top, schematic of the model of a layer 5 pyramidal neuron including the reconstructed AIS              40
                                                                          and attached axon with myelinated regions (gray). The locations of the first nodes of Ranvier and AIS are
                                                                          indicated. Bottom, space-voltage relationships taken at the time voltage first crosses 0 mV for models with
                                                                                                                                                                                                 20
                                                                          different AIS Na+ channel densities (gNa, AIS) ranging from 500 to 5,000 pS mm–2. (b) Site of action
                                                                          potential initiation (distance from axon hillock) versus AIS Na+ channel density (gNa, AIS) in models with
                                                                          two different dendritic Na+ channel densities (45 and 100 pS mm–2). To obtain action potential initiation                   0    1,000 2,000 3,000 4,000
                                                                          in the AIS (50 mm from the axon hillock) required an AIS Na+ channel density of at least 2,500 pS mm–2                            gNa, AIS (pS µm–2)
                                                                          in both models. (c) Left, morphology of the model neuron with dendritic recording location indicated
                                                                          (Vm, 495 mm from the soma). Right, examples of action potentials recorded in the apical dendrite 495 mm from the soma in models with the indicated AIS
                                                                          Na+ channel densities. (d) Dendritic action potential amplitude (495 mm from the soma) versus AIS Na+ channel density (gNa, AIS). Data fit with a sigmoid
                                                                          function with half-maximum density B1,000 pS mm–2.

                                                                          potentials with a rate-of-rise similar to that observed experimentally                                          initiation, and dendritic backpropagation of action potentials can be
                                                                          (Fig. 5d, red line; compare with Fig. 5b). This is B60 times the somato-                                        observed only in models where the density of Na+ channels in the AIS is
                                                                          dendritic Na+ channel density in pyramidal neurons (B50 pS mm–2)5,30.                                           substantially higher than that found in the soma and proximal
                                                                                                                                                                                          dendrites of layer 5 pyramidal neurons. Taking the estimates from
                                                                          Simulating action potential initiation and backpropagation                                                      the experiments and modeling together, we conclude that the Na+
                                                                          We next performed simulations to investigate the dependence of the                                              channel density in the AIS is on average B50 times that observed in
                                                                          site of action potential initiation on the Na+ channel density in the AIS.                                      the soma and proximal dendrites. Assuming a somato-dendritic Na+
                                                                          Recent studies in layer 5 pyramidal neurons indicate that action                                                channel density of 50 pS mm–2 in pyramidal neurons5,30, in absolute
                                                                          potentials in these neurons are initiated in the distal AIS12,13.                                               terms this equates to an AIS Na+ channel density of B2,500 pS mm–2.
                                                                          Figure 6a shows overlayed space-voltage plots in simulations in
                                                                          which the AIS Na+ channel density was increased from 500 to                                                     DISCUSSION
                                                                          5,000 pS mm–2, while maintaining a fixed somato-dendritic Na+ density                                           In this paper we provide new evidence in support of the long-held view
                                                                          of 45 pS mm–2 and a nodal density of 2,500 pS mm–2. We defined the site                                         that the density of voltage-activated Na+ channels in the AIS is
                                                                          of action potential initiation as the location where the voltage first                                          significantly higher than that found at the soma and proximal den-
                                                                          crossed 0 mV and plotted this against the Na+ channel density in the                                            drites. This prediction has been questioned by patch-clamp recordings
                                                                          AIS (Fig. 6b). Action potentials in these models were initiated at the                                          from the AIS, which have suggested that the density of Na+ channels in
                                                                          first or second nodes of Ranvier when the AIS Na+ channel density was                                           the AIS is similar to7 or only slightly higher than that found at the
                                                                          low (100–1,500 pS mm–2), with action potential initiation only occur-                                           soma25. However, evidence from immunocytochemistry, whole-cell
                                                                          ring in the distal AIS (as observed experimentally) when the density of                                         voltage-clamp and Na+ imaging studies contradicted this observation.
                                                                          Na+ channels in the AIS was greater than B2,500 pS mm–2 (Fig. 6b); a                                            This paradox can be accounted for by anchoring of Na+ channels in the
                                                                          value B50 times the somato-dendritic Na+ channel density in                                                     AIS to the actin cytoskeleton, restricting their ability to be drawn into
                                                                          pyramidal neurons (B50 pS mm–2)5,30. This finding was robust for                                                the patch-pipette tip during cell-attached and outside-out recordings.
                                                                          the two somato-dendritic Na+ channel densities investigated in these                                            Consistent with this idea we observed an increase in the apparent
                                                                          simulations (Fig. 6b).                                                                                          density of Na+ channels selectively in patches from the AIS following
                                                                             Finally, we investigated the dependence of action potential back-                                            disruption of the actin cytoskeleton (Fig. 4). Finally, we show in
                                                                          propagation on the density of Na+ channels in the AIS (Fig. 6c).                                                morphologically realistic models that experimental observations on
                                                                          Dendritic action potential amplitude depended steeply on the                                                    axonal action potential rate-of-rise, as well as initiation and back-
                                                                          density of Na+ channels in the AIS, with a clear threshold around                                               propagation, require high AIS Na+ channel densities (on the order
                                                                          1,000 pS mm–2 (Fig. 6d). Dendritic action potential amplitude did not                                           of B2,500 pS mm–2).
                                                                          approach experimentally observed values of 55 mV5 until the density
                                                                          of Na+ channels in the AIS was greater than B2,000 pS mm–2 (Fig. 6d),                                           Comparisons with previous studies
                                                                          40 times the somato-dendritic Na+ channel density in pyramidal                                                  The notion that the density of Na+ channels in the AIS is significantly
                                                                          neurons (B50 pS mm–2)5,30.                                                                                      higher than in the soma and dendrites dates back to the original work
                                                                             These simulations support the results of the experiments using                                               on action potential initiation in spinal motoneurons, where it was
                                                                          antibody staining, whole-cell voltage-clamp and Na+ imaging by                                                  observed that the threshold for the so-called ‘initial segment’ spike
                                                                          showing that experimental observations on the axonal properties,                                                was significantly more hyperpolarized than the threshold for the

                                                                          NATURE NEUROSCIENCE VOLUME 11                       [   NUMBER 2   [    FEBRUARY 2008                                                                                                                         183
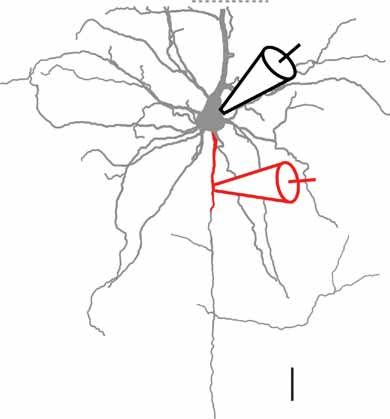
Action potential generation requires a high sodium channel density in the axon initial segment
ARTICLES

                                                                          ‘somato-dendritic’ spike1–3. Theoretical studies have suggested that this    tethering them to the actin cytoskeleton28,37. Voltage-activated Na+
                                                                          difference in threshold is best explained by a high density of Na+           channels interact with the membrane-bound protein Ankyrin G19 as
                                                                          channels in the AIS14–17, consistent with our experimental observations      well as with IV spectrin21, and targeting of Na+ channels to the AIS is
                                                                          using immunocytochemistry (Fig. 1c,d), whole-cell voltage-clamp              thought to involve an Ankyrin G-binding motif located in the
                                                                          (Fig. 2) and Na+ imaging (Fig. 3), and also with our simulations             cytoplasmic linker between domains II and III of the a-subunit of
                                                                          (Figs. 5 and 6).                                                             voltage-activated Na+ channels38. This molecular interaction is impor-
                                                                             Previous patch estimates of the Na+ channel density in AIS have           tant for anchoring Na+ channels to the actin cytoskeleton in the AIS39.
                                                                          concluded that it is similar to that at the soma7,25 (Fig. 1b), and it has   Consistent with the idea that Na+ channels in the AIS are bound tightly
                                                                          been argued that a negative shift in the voltage-dependence of activation    to the actin cytoskeleton, the apparent Na+ channel density in cell-
© 2008 Nature Publishing Group http://www.nature.com/natureneuroscience

                                                                          of AIS Na+ channels in the absence of a high AIS Na+ channel density         attached recordings from the AIS, but not the soma or dendrites, was
                                                                          can explain axonal action potential initiation in cortical pyramidal         significantly increased following disruption of the actin cytoskeleton
                                                                          neurons25. This notion was not supported by our simulations (Fig. 6).        (Fig. 4a). These data support the hypothesis that patch-clamp estimates
                                                                          Experimental observations on the site of action potential initiation in      of AIS Na+ channel density7,25 (Fig. 1b) underestimate the true density
                                                                          layer 5 pyramidal neurons12,13 could only be accounted for in models         as Na+ channels anchored to the actin cytoskeleton are prevented from
                                                                          where the AIS Na+ channel density was significantly (B50 times) higher       being drawn into the patch membrane during seal formation, as has
                                                                          than the somato-dendritic Na+ channel density, despite using Na+             been described at the neuromuscular junction29. The tight physical
                                                                          channel models in the AIS and nodes of Ranvier with the observed             coupling between the cytoskeleton and voltage-gated Na+ channels
                                                                          more negative voltage-dependence (Supplementary Fig. 2 online). A            observed here might be unique to Na+ channels, as recent findings
                                                                          similar conclusion was drawn from an earlier simulation study17.             indicate that the high density of Kv1 channels in the distal AIS seen with
                                                                             Our model-based estimates of the difference in channel density            immunocytchemisty23 is also observed in cell-attached recordings13.
                                                                          between the AIS and the somato-dendritic compartment line up well               Following disruption of the actin cytoskeleton, patch estimates of
                                                                          with our experimental estimates. Our comparison of whole-cell Na+            Na+ channel density in the AIS were only three- to fourfold higher than
                                                                          currents during local application of Na+-rich solution to the AIS and        in the soma and proximal dendrites (Fig. 4a). These new estimates
                                                                          the proximal apical dendrites could only be explained if the Na+             based on patch-clamp recordings are substantially lower than the
                                                                          channel density at the AIS was B45 times that at proximal apical             estimates of the Na+ channel density in the AIS from antibody staining
                                                                          dendritic sites (Fig. 2e), whereas the change in local Na+ concentration     (Fig. 1c,d), whole-cell recording (Fig. 2), Na+ imaging (Fig. 3) and
                                                                          in the AIS compared to that in the proximal basal dendrites during           modeling (Figs. 5 and 6). This is likely to be the case for two reasons.
                                                                          action potential trains required the Na+ channel density at the AIS to be    First, after disruption of the actin cytoskeleton, lateral diffusion of Na+
                                                                          B30 times that in the proximal basal dendrites (Fig. 3g). Together with      channels away from the AIS28,37 will reduce the AIS Na+ channel
                                                                          the estimates from our simulations (Figs. 5 and 6), these results lead us    density. Indeed, breakdown of the actin cytoskeleton was associated
                                                                          to conclude that the AIS Na+ channel density is B50-fold greater than        with a reduction in axonal action potential rate-of-rise (Fig. 4e),
                                                                          that observed in the soma and proximal dendrites of cortical layer 5         consistent with loss of approximately one-third of the Na+ channels
                                                                          pyramidal neurons. Interestingly, this difference is similar to previous     from the AIS (Fig. 5d). Second, it is likely that disruption of the actin
                                                                          estimates of the high Na+ channel density in nodal compared to inter-        cytoskeleton in our experiments is incomplete, such that a significant
                                                                          nodal regions of mammalian axons31.                                          proportion of the Na+ channels in the AIS are still tightly anchored to
                                                                                                                                                       the cytoskeleton after treatment with latrunculin or cytochalasin.
                                                                          Molecular identity of Na+ channels in the AIS
                                                                          Consistent with a previous study25, we observed a hyperpolarized shift       Role of Na+ channels in the AIS
                                                                          (B10 mV) in the voltage-dependence of activation of AIS Na+                  One of the advantages of a high AIS Na+ channel density is that it forces
                                                                          channels, although in our experiments this was found throughout              action potential initiation to occur in a localized region of the neuron,
                                                                          the entire AIS (not shown), and was associated with a similar shift          the distal AIS (Fig. 6), providing a single site where inputs can influence
                                                                          (B6 mV) in the voltage-dependence of inactivation (Supplementary             action potential output. If the AIS Na+ channel density is reduced,
                                                                          Fig. 2 and Supplementary Table 1). Recent work indicates that in the         action potential initiation shifts to the nodes of Ranvier, the next
                                                                          mature nervous system the Na+ channel isoform Nav1.6 is localized to         available site with high Na+ channel density (Fig. 6a,b). Our simula-
                                                                          the AIS and nodes of Ranvier, whereas Nav1.2 is found primarily in           tions indicate that the first node of Ranvier is electrotonically too far
                                                                          unmyelinated axons22,32,33. Electrophysiological characterization of         from the soma to support invasion by backpropagating action poten-
                                                                          these two Na+ channel isoforms indicates that the voltage-dependence         tials when the AIS Na+ channel density is low (Fig. 6c,d). Thus, an
                                                                          of activation and inactivation of Nav1.6 is shifted by 10–15 mV to more      important functional role of the high AIS Na+ channel density is to
                                                                          negative potentials compared to that of Nav1.2 (ref. 34). This finding       compensate for the large electrical load imposed by the soma, enabling
                                                                          agrees with our observed negative shift in the voltage-dependence of         axonal action potentials to invade the soma and backpropagate into the
                                                                          activation and inactivation of Na+ channels in the AIS compared to the       dendritic tree. In addition, reducing the AIS Na+ channel density
                                                                          soma, and suggests that the molecular identity of AIS Na+ channels in        moves the site of action potential initiation away from the known locus
                                                                          layer 5 pyramidal neurons is likely to be Nav1.6, whereas somato-            of inhibitory input that specifically targets the AIS40, which presumably
                                                                          dendritic Na+ channels are likely to include Nav1.2, possibly with           exerts a powerful influence on the initiation and backpropagation of
                                                                          Nav1.1 and 1.3 (ref. 35).                                                    action potentials. The high AIS Na+ channel density is also likely to be
                                                                                                                                                       important for the precise timing of action potentials in response to
                                                                          Anchoring of sodium channels to the AIS                                      synaptic input41. In conclusion, we show that a high Na+ channel
                                                                          The first electron micrographs of the AIS of pyramidal neurons in the        density in the AIS, maintained by tight anchoring to the actin
                                                                          cortex indicated that it contains an electron-dense coating similar to       cytoskeleton, provides neurons with a unique site for the integration
                                                                          that observed at nodes of Ranvier36. More recent studies show that the       of synaptic input as well as a mechanism for signaling neuronal output
                                                                          AIS can act as a diffusion barrier for certain membrane proteins, by         back to the synapse.

                                                                          184                                                                           VOLUME 11     [   NUMBER 2   [   FEBRUARY 2008 NATURE NEUROSCIENCE
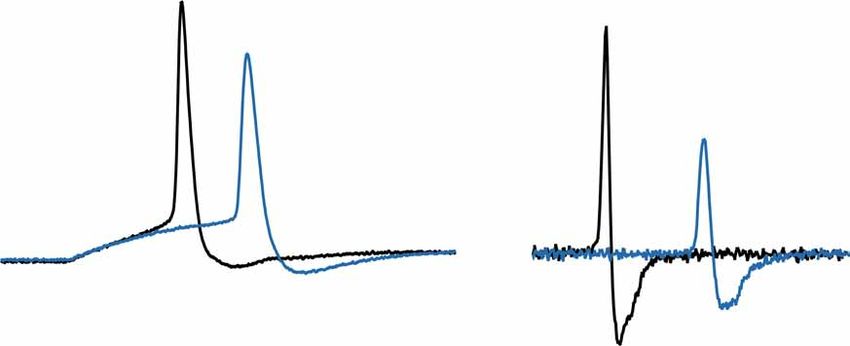
Action potential generation requires a high sodium channel density in the axon initial segment
ARTICLES

                                                                          METHODS                                                                            ACSF-filled application pipettes (5 MO) were positioned within 5 mm of
                                                                          General. Wistar rats (2–4 weeks old) were anesthetized by inhalation of            the AIS (30 mm from the soma) and proximal apical dendrite (B50 mm from
                                                                          isoflurane and decapitated, and sagittal brain slices (300 mm) of somatosensory    the soma), and ACSF was applied 10 ms before somatic voltage steps to ensure
                                                                          cortex were prepared according to guidelines approved by the Animal Ethics         evoked Na+ current was generated close to the pipette tip. Applications of ACSF
                                                                          Committee of the Australian National University and the University of Freiburg     were bracketed by somatic voltage steps alone, and the Na+ current evoked
                                                                          (Germany). During recording, slices were superfused with oxygenated (95%           during application of Na+-containing extracellular solution to each location
                                                                          O2, 5% CO2) extracellular solution (ACSF) containing (in mM): 125 NaCl,            was determined by subtraction of the response to somatic voltage steps alone.
                                                                          3 KCl, 1.25 NaH2PO4, 25 NaHCO3, 25 glucose, 2 CaCl2, 1 MgCl2 (pH 7.4) at           To improve the temporal fidelity of somatic voltage-clamp these experiments
                                                                          32–34 1C, unless otherwise stated. Patch-pipette recordings were obtained from     were performed at room temperature (B23 1C).
                                                                          the soma, the proximal dendrites or the first B50 mm of unmyelinated AIS of
© 2008 Nature Publishing Group http://www.nature.com/natureneuroscience

                                                                          large cortical layer 5 pyramidal neurons using standard methods42. In some         Sodium imaging. During experiments using sodium-sensitive fluorescent dyes,
                                                                          cases recordings were made from axon blebs13. Current and voltage were low-        pipettes (B5 MO) were tip filled with K-Gluconate whole-cell pipette solution
                                                                          pass filtered at 2 kHz and 10 kHz, respectively, and sampled at 20–50 kHz using    without dye and back filled with the same K-Gluconate solution containing
                                                                          an ITC-18 interface (Instrutech) controlled by an Apple PowerPC running            1 mM SBFI (Invitrogen), or 1 mM Sodium Green (Invitrogen) dissolved in
                                                                          Axograph software (Molecular Devices). Data are presented as mean ± s.e.m.         150 mM KCl. Changes in fluorescence were acquired using a back-illuminated
                                                                          Statistical analysis between two independent datasets was performed using a        CCD camera (Red Shirt Imaging), analyzed with Neuroplex software (Red Shirt
                                                                          two-tailed unpaired Student’s t-test. For multiple group comparisons we used a     Imaging), and expressed as the change in fluorescence from baseline (F)
                                                                          one-way analysis of variance (ANOVA) followed by Bonferroni post-test using        divided by the baseline fluorescence (F) after subtraction of background
                                                                          Prism 4.0 (GraphPad Software). The level of significance for rejecting the null    fluorescence from a nearby region. Changes in fluorescence were investigated
                                                                          hypothesis was set to 0.05.                                                        in small regions of interest (B10 mm in length). Imaging experiments were
                                                                                                                                                             performed at room temperature (B23 1C).
                                                                          Patch recordings. Cell-attached recordings were made using pipettes of similar
                                                                          resistance (11–15 MO) with a patch-clamp amplifier (Axopatch 200B, Mole-           Current clamp. Somatic and axonal whole-cell current-clamp recordings were
                                                                          cular Devices). No differences in the degree or time of suction applied to the     made with current clamp amplifiers (BVC-700, Dagan Corp.) using pipettes
                                                                          back of pipettes was required to form high resistance (3–10 GO) seals at           (B5 MO) filled with a solution containing (in mM): 140 K-Gluconate,
                                                                          somatic or axonal sites, suggesting that similar membrane areas were sampled.      2 MgCl2, 2 Na2ATP, 0.3 NaGTP, 10 HEPES (pH 7.2 with KOH). Action
                                                                          For cell-attached recordings, we filled pipettes with the following solution (in   potentials were evoked by somatic current injection and membrane potential
                                                                          mM): 125 NaCl; 30 TEA; 5 4-AP; 2 CaCl2; 1 MgCl2; 0.2 CdCl2; 10 HEPES               corrected for an estimated junction potential of approximately +12 mV. Action
                                                                          (290 mOsm, pH 7.2 with NaOH). Steady-state inactivation was assessed using         potential rate-of-rise was determined from the derivative of the membrane
                                                                          100-ms prepulses between –100 mV and –10 mV before stepping to a test pulse        potential (dV/dt), with threshold defined as the membrane potential at which
                                                                          of 0 mV. Steady-state activation was assessed using 100-ms prepulses to            dV/dt equals 50 V s–1.
                                                                          –100 mV followed by test pulses to voltages between –80 mV and +10 mV.
                                                                          Peak current was converted to conductance assuming a reversal potential of         Modeling. Computer simulations used Neurolucida reconstructions of layer 5
                                                                          +55 mV, normalized to the maximum, and data fitted with a single Bolzmann          pyramidal neurons (Fig. 6c) imported into NEURON (v5.8)43. The morpho-
                                                                          function. The resting membrane potential of the soma and AIS were assumed          logy included the reconstructed AIS. At the end of the AIS we attached
                                                                          to be –75 mV after junction potential correction13. Currents were leak             cylindrical sections of alternating length and diameter representing myelinated
                                                                          subtracted on-line (P/5) with Axograph software.                                   internodes (length: 60 mm; diameter: 1.6 mm) and nodes of Ranvier (length:
                                                                                                                                                             1 mm; diameter: 1.1 mm) with a total axonal length of 2.7 mm. On average, the
                                                                          Immunocytochemistry. Immunohistological identification of Na+ channels             location of the first node was B110 mm from the axon hillock, consistent with
                                                                          was performed with a pan-alpha anti-sodium channel antibody (SP20; pro-            previous studies12,44. The passive electrical properties Rm, Cm and Ri were set to
                                                                          vided by W. Catterall, University of Washington). Layer 5 pyramidal neurons        15,000 O cm2, 0.9 mF cm–2 and 100 O cm, respectively, uniformly throughout
                                                                          were labeled intracellularly during somatic whole-cell recordings using patch-     all compartments. Myelination was simulated by reducing Cm to 0.02 mF cm–2,
                                                                          pipettes containing the red fluorescent dye Sulforhodamine (101; Invitrogen).      which provided an axonal conduction velocity of 2.9 ms–1, similar to that
                                                                          Slices were fixed with PLP (4% paraformaldehyde, 0.2% periodate and 1.2%           observed experimentally13. Nodal sections possessed a 400-fold increased
                                                                          lysine in 0.1 M in phosphate buffer), re-sliced at 8–30 mm thickness using a       resting conductance. Spines were modeled by doubling Cm and halving Rm
                                                                          cryostat, and incubated with the pan-alpha anti-sodium channel antibody for        in spiny dendritic sections. The resting membrane potential at the soma was set
                                                                          48–72 h before detection with an Alexa-coupled anti-rabbit antibody (Alexa         to –75 mV. All simulations were run with 5-ms time steps (unless otherwise
                                                                          Fluor 488; Invitrogen) using confocal microscopy. As an alternative to labeling    noted) and the nominal temperature of simulations was 37 1C.
                                                                          with Sulforhodamine, in some cases slices were counterstained with propidium           The voltage-dependence of activation and inactivation of a Hodgkin-Huxley
                                                                          iodide to stain the nuclei of layer 5 pyramidal neurons before incubation with     based Na+ channel model16 was set to the experimentally observed values
                                                                          anti-sodium channel antibody.                                                      (Supplementary Table 1 and Supplementary Fig. 2). The Na+ equilibrium
                                                                                                                                                             potential was set to +55 mV. The action potential threshold at the soma was set
                                                                          Somatic voltage-clamp. Somatic whole-cell voltage-clamp recordings                 to –60 mV. Unless otherwise stated the Na+ channel density was 45 pS mm–2 in
                                                                          were made with a patch-clamp amplifier (Axopatch 200B) using pipettes              the dendrites and soma, 2,500 pS mm–2 in nodes of Ranvier, and 80 pS mm–2 in
                                                                          (3–5 MO) filled with the following solution (in mM): 135 mM CsCl, 4 mM             internodal myelinated sections45. The density of Na+ channels in the AIS was
                                                                          MgCl2, 10 mM EGTA, 4 mM Na2ATP, 10 mM Na2-phophosphocreatine,                      varied from 45 to 5,000 pS mm–2, was uniform over the first 45 mm, and then
                                                                          10 mM HEPES (pH 7.2 with CsOH). During whole-cell voltage-clamp                    decreased linearly in the distal AIS24. Na+ channel models based on allosteric
                                                                          experiments, series resistance (5–10 MO) was compensated by greater than           gating or non-sigmoid activation kinetics46,47 were tested but did not ade-
                                                                          85% (o5 mS lag). Brief voltage steps (–70 to –10 mV) were used to evoke Na+        quately reproduce action potential kinetics.
                                                                          currents, and the external solution switched to one with zero Na+ of the               For Fig. 3 the internal Na+ concentration was modeled with a previously
                                                                          following composition (in mM): 140 NMDG, 3 mM KCl, 10 HEPES,                       described mechanism for Na+ diffusion and a Na+/K+ exchanging pump48.
                                                                          25 glucose, 2 CaCl2, 1 MgCl2 (pH 7.4 with HCl, oxygenated with 95% O2/             Pump distribution was 12 mA cm–2 and Na+ diffusion was set to 0.6 mm2 ms–1
                                                                          5% CO2). In some cases this solution also included TTX (1 mM). Following           in all compartments. The resting Na+ concentration was set to 10 mM.
                                                                          almost complete block of inward Na+ current (reduced to less than 5%), brief       Simulation time steps were increased to 100 ms and data were analyzed using
                                                                          applications (10 ms) of standard Na+-rich ACSF were applied alternatively to       IGOR 4.08 (Wavemetrics).
                                                                          the AIS or proximal apical dendrite using standard patch pipettes filled               The model included a high-voltage-activated K+ channel (Kv)16, a faster
                                                                          with ASCF and controlled by two independent Picospritzers (General Valve).         low-voltage activated Kv1-like K+ channel (‘Kv1’), as described49, and a

                                                                          NATURE NEUROSCIENCE VOLUME 11                [   NUMBER 2   [   FEBRUARY 2008                                                                                    185
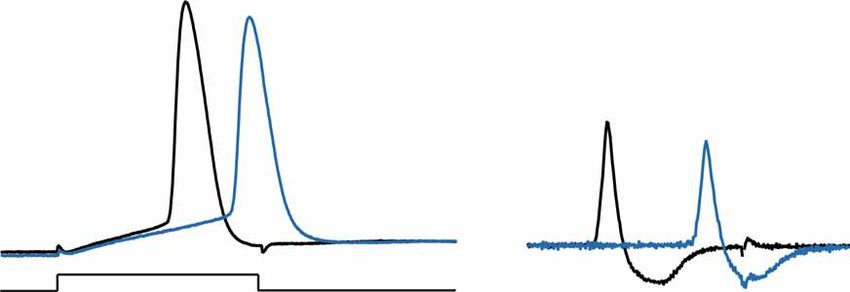
Action potential generation requires a high sodium channel density in the axon initial segment
ARTICLES

                                                                          slowly-activating and non-inactivating M-type K+ channel (‘Km’)16. Potassium                      20. Kordeli, E., Lambert, S. & Bennett, V. AnkyrinG. A new ankyrin gene with neural-specific
                                                                          channel densities were adjusted to obtain fast action potential repolarization                        isoforms localized at the axonal initial segment and node of Ranvier. J. Biol. Chem. 270,
                                                                          and large amplitude afterhyperpolarizations in the distal AIS13. The density of                       2352–2359 (1995).
                                                                                                                                                                            21. Komada, M. & Soriano, P. IV-spectrin regulates sodium channel clustering through
                                                                          Kv, Kv1 and Km were set to 20, 100 and 5 pS mm–2, respectively, in the soma,                          ankyrin-G at axon initial segments and nodes of Ranvier. J. Cell Biol. 156, 337–348
                                                                          dendrites and inter-nodal sections, and increased linearly with distance from                         (2002).
                                                                          the axon hillock in the AIS to 2,000 pS mm–2 in the distal AIS and nodes for                      22. Boiko, T. et al. Functional specialization of the axon initial segment by isoform-specific
                                                                          Kv and Kv1, and to 50 pS mm–2 for Km. The K+ reversal potential was set                               sodium channel targeting. J. Neurosci. 23, 2306–2313 (2003).
                                                                                                                                                                            23. Inda, M.C., DeFelipe, J. & Munoz, A. Voltage-gated ion channels in the axon initial
                                                                          to –85 mV. Ih channels were included in the soma and dendrites with an                                segment of human cortical pyramidal cells and their relationship with chandelier cells.
                                                                          exponential increase in density with distance from the soma, and kinetics and                         Proc. Natl. Acad. Sci. USA 103, 2920–2925 (2006).
                                                                          voltage dependence as described previously50. Ih channels were not included in                    24. Van Wart, A., Trimmer, J.S. & Matthews, G. Polarized distribution of ion channels
© 2008 Nature Publishing Group http://www.nature.com/natureneuroscience

                                                                          the axon.                                                                                             within microdomains of the axon initial segment. J. Comp. Neurol. 500, 339–352
                                                                                                                                                                                (2007).
                                                                                                                                                                            25. Colbert, C.M. & Pan, E. Ion channel properties underlying axonal action potential
                                                                          Note: Supplementary information is available on the Nature Neuroscience website.                      initiation in pyramidal neurons. Nat. Neurosci. 5, 533–538 (2002).
                                                                                                                                                                            26. Ulbricht, W. Sodium channel inactivation: molecular determinants and modulation.
                                                                          ACKNOWLEDGMENTS                                                                                       Physiol. Rev. 85, 1271–1301 (2005).
                                                                          We thank W. Catterall for the gift of the pan-alpha sodium channel antibody.                      27. Lasser-Ross, N. & Ross, W.N. Imaging voltage and synaptically activated sodium
                                                                          This work was supported by the Alexander von Humboldt Foundation (G.J.S.)                             transients in cerebellar Purkinje cells. Proc. Biol. Sci. 247, 35–39 (1992).
                                                                          and a NRSA Senior Fellowship (P.C.R.).                                                            28. Nakada, C. et al. Accumulation of anchored proteins forms membrane diffusion barriers
                                                                                                                                                                                during neuronal polarization. Nat. Cell Biol. 5, 626–632 (2003).
                                                                                                                                                                            29. Milton, R.L. & Caldwell, J.H. Na current in membrane blebs: implications for channel
                                                                          AUTHOR CONTRIBUTIONS                                                                                  mobility and patch clamp recording. J. Neurosci. 10, 885–893 (1990).
                                                                          M.H.P.K. performed the patch and whole-cell current-clamp experiments, as well                    30. Magee, J.C. & Johnston, D. Characterization of single voltage-gated Na+ and Ca2+
                                                                          as simulations, and wrote the paper; S.U.I. performed the antibody experiments;                       channels in apical dendrites of rat CA1 pyramidal neurons. J. Physiol. (Lond.) 487,
                                                                          B.M.K. helped with the sodium imaging experiments and performed the                                   67–90 (1995).
                                                                          associated simulations; S.R.W. and P.C.R. helped with the patch experiments; and                  31. Shrager, P. Sodium channels in single demyelinated mammalian axons. Brain Res. 483,
                                                                          G.J.S. performed the whole-cell voltage-clamp and sodium imaging experiments                          149–154 (1989).
                                                                          and wrote the paper.                                                                              32. Boiko, T. et al. Compact myelin dictates the differential targeting of two sodium channel
                                                                                                                                                                                isoforms in the same axon. Neuron 30, 91–104 (2001).
                                                                                                                                                                            33. Kaplan, M.R. et al. Differential control of clustering of the sodium channels
                                                                          Published online at http://www.nature.com/natureneuroscience
                                                                                                                                                                                Na(v)1.2 and Na(v)1.6 at developing CNS nodes of Ranvier. Neuron 30, 105–119
                                                                          Reprints and permissions information is available online at http://npg.nature.com/                    (2001).
                                                                          reprintsandpermissions                                                                            34. Rush, A.M., Dib-Hajj, S.D. & Waxman, S.G. Electrophysiological properties of two axonal
                                                                                                                                                                                sodium channels, Nav1.2 and Nav1.6, expressed in mouse spinal sensory neurones.
                                                                          1. Coombs, J.S., Curtis, D.R. & Eccles, J.C. The generation of impulses in motoneurones.              J. Physiol. (Lond.) 564, 803–815 (2005).
                                                                             J. Physiol. (Lond.) 139, 232–249 (1957).                                                       35. Komai, S. et al. Postsynaptic excitability is necessary for strengthening of cortical
                                                                          2. Fatt, P. Sequence of events in synaptic activation of a motoneurone. J. Neurophysiol. 20,          sensory responses during experience-dependent development. Nat. Neurosci. 9,
                                                                             61–80 (1957).                                                                                      1125–1133 (2006).
                                                                          3. Fuortes, M.G.F., Frank, K. & Becker, M.C. Steps in the production of motoneuron spikes.        36. Peters, A., Proskauer, C.C. & Kaiserman-Abramof, I.R. The small pyramidal neuron of
                                                                             J. Gen. Physiol. 40, 735–752 (1957).                                                               the rat cerebral cortex. The axon hillock and initial segment. J. Cell Biol. 39, 604–619
                                                                          4. Eccles, J.C. The Physiology of Synapses (Springer, Berlin, 1964).                                  (1968).
                                                                          5. Stuart, G.J. & Sakmann, B. Active propagation of somatic action potentials into                37. Winckler, B., Forscher, P. & Mellman, I. A diffusion barrier maintains distribution of
                                                                             neocortical pyramidal cell dendrites. Nature 367, 69–72 (1994).                                    membrane proteins in polarized neurons. Nature 397, 698–701 (1999).
                                                                          6. Stuart, G. & Hausser, M. Initiation and spread of sodium action potentials in cerebellar       38. Garrido, J.J. et al. A targeting motif involved in sodium channel clustering at the axonal
                                                                             Purkinje cells. Neuron 13, 703–712 (1994).                                                         initial segment. Science 300, 2091–2094 (2003).
                                                                          7. Colbert, C.M. & Johnston, D. Axonal action-potential initiation and Na+ channel                39. Lai, H.C. & Jan, L.Y. The distribution and targeting of neuronal voltage-gated ion
                                                                             densities in the soma and axon initial segment of subicular pyramidal neurons.                     channels. Nat. Rev. Neurosci. 7, 548–562 (2006).
                                                                             J. Neurosci. 16, 6676–6686 (1996).                                                             40. Howard, A., Tamas, G. & Soltesz, I. Lighting the chandelier: new vistas for axo-axonic
                                                                          8. Stuart, G., Schiller, J. & Sakmann, B. Action potential initiation and propagation in rat          cells. Trends Neurosci. 28, 310–316 (2005).
                                                                             neocortical pyramidal neurons. J. Physiol. (Lond.) 505, 617–632 (1997).                        41. Kuba, H., Ishii, T.M. & Ohmori, H. Axonal site of spike initiation enhances auditory
                                                                          9. Clark, B.A., Monsivais, P., Branco, T., London, M. & Hausser, M. The site of action                coincidence detection. Nature 444, 1069–1072 (2006).
                                                                             potential initiation in cerebellar Purkinje neurons. Nat. Neurosci. 8, 137–139 (2005).         42. Stuart, G.J., Dodt, H.-U. & Sakmann, B. Patch-clamp recordings from the soma and
                                                                          10. Shu, Y., Duque, A., Yu, Y., Haider, B. & McCormick, D.A. Properties of action-potential           dendrites of neurones in brain slices using infrared video microscopy. Pflugers Arch.
                                                                              initiation in neocortical pyramidal cells: evidence from whole-cell axon recordings.              423, 511–518 (1993).
                                                                              J. Neurophysiol. 97, 746–760 (2007).                                                          43. Carnevale, N.T. & Hines, M.L. The Neuron Book (Cambridge University Press,
                                                                          11. Meeks, J.P. & Mennerick, S. Action potential initiation and propagation in CA3                    Cambridge, 2006).
                                                                              pyramidal axons. J. Neurophysiol. 97, 3460–3472 (2007).                                       44. Sloper, J.J. & Powell, T.P. A study of the axon initial segment and proximal axon of
                                                                          12. Palmer, L.M. & Stuart, G.J. Site of action potential initiation in layer 5 pyramidal              neurons in the primate motor and somatic sensory cortices. Phil. Trans. R. Soc. Lond. B
                                                                              neurons. J. Neurosci. 26, 1854–1863 (2006).                                                       285, 173–197 (1979).
                                                                          13. Kole, M.H.P., Letzkus, J.J. & Stuart, G.J. Axon initial segment Kv1 channels control          45. Neumcke, B. & Stämpfli, R. Sodium currents and sodium-current fluctuations in rat
                                                                              axonal action potential waveform and synaptic efficacy. Neuron 55, 633–647 (2007).                myelinated nerve fibres. J. Physiol. (Lond.) 329, 163–184 (1982).
                                                                          14. Dodge, F.A. & Cooley, J.W. Action potential of the motoneuron. IBM J. Res. Develop. 17,       46. Baranauskas, G. & Martina, M. Sodium currents activate without a Hodgkin-and-
                                                                              219–229 (1973).                                                                                   Huxley-type delay in central mammalian neurons. J. Neurosci. 26, 671–684
                                                                          15. Moore, J.W., Stockbridge, N. & Westerfield, M. On the site of impulse initiation in a             (2006).
                                                                              neurone. J. Physiol. (Lond.) 336, 301–311 (1983).                                             47. Taddese, A. & Bean, B.P. Subthreshold sodium current from rapidly inactivating sodium
                                                                          16. Mainen, Z.F., Joerges, J., Huguenard, J.R. & Sejnowski, T.J. A model of spike initiation in       channels drives spontaneous firing of tuberomammillary neurons. Neuron 33, 587–600
                                                                              neocortical pyramidal neurons. Neuron 15, 1427–1439 (1995).                                       (2002).
                                                                          17. Rapp, M., Yarom, Y. & Segev, I. Modeling back propagating action potential in weakly          48. Canavier, C.C. Sodium dynamics underlying burst firing and putative mechanisms for the
                                                                              excitable dendrites of neocortical pyramidal cells. Proc. Natl. Acad. Sci. USA 93,                regulation of the firing pattern in midbrain dopamine neurons: a computational
                                                                              11985–11990 (1996).                                                                               approach. J. Comput. Neurosci. 6, 49–69 (1999).
                                                                          18. Wollner, D.A. & Catterall, W.A. Localization of sodium channels in axon hillocks and          49. Akemann, W. & Knopfel, T. Interaction of Kv3 potassium channels and resurgent sodium
                                                                              initial segments of retinal ganglion cells. Proc. Natl. Acad. Sci. USA 83, 8424–8428              current influences the rate of spontaneous firing of Purkinje neurons. J. Neurosci. 26,
                                                                              (1986).                                                                                           4602–4612 (2006).
                                                                          19. Zhou, D. et al. AnkyrinG is required for clustering of voltage-gated Na channels at axon      50. Kole, M.H.P., Hallermann, S. & Stuart, G.J. Single Ih channels in pyramidal neuron
                                                                              initial segments and for normal action potential firing. J. Cell Biol. 143, 1295–1304             dendrites: properties, distribution, and impact on action potential output. J. Neurosci.
                                                                              (1998).                                                                                           26, 1677–1687 (2006).

                                                                          186                                                                                                VOLUME 11        [   NUMBER 2      [   FEBRUARY 2008 NATURE NEUROSCIENCE
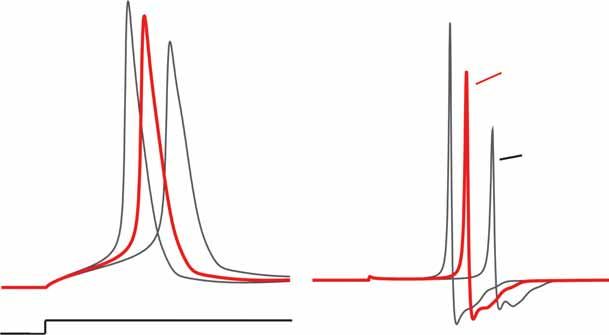
Action potential generation requires a high sodium channel density in the axon initial segment
You can also read