Active Lives Children and Young People Survey Academic year 2019/20 - Published January 2021 - AWS
←
→
Page content transcription
If your browser does not render page correctly, please read the page content below
Active Lives Children and
Young People Survey

Academic year 2019/20
Published January 2021

                            sportengland.org
Contents

                              Key information
    Welcome              03   This report presents data from the Active
                              Lives Children and Young People Survey for
    Levels of activity   04
                              the academic year 2019/20. Data is
    Types of activity    13   presented for children and young people
                              in school Years 1-11 (ages 5-16) in England.
    Volunteering         16
                              This report should be read in conjunction
    Outcomes             20   with our Coronavirus (Covid-19) Report,
    Loneliness           24   which can be accessed here.

    Attitudes            26   Release dates
    Local level data     34   This release: 14 January 2021
    Definitions          35   Next release: 9 December 2021

    Notes                37
                              Find out more
                              For more information on the data
                              presented in this report, please visit the
                              Active Lives section of our website.

                                                                             2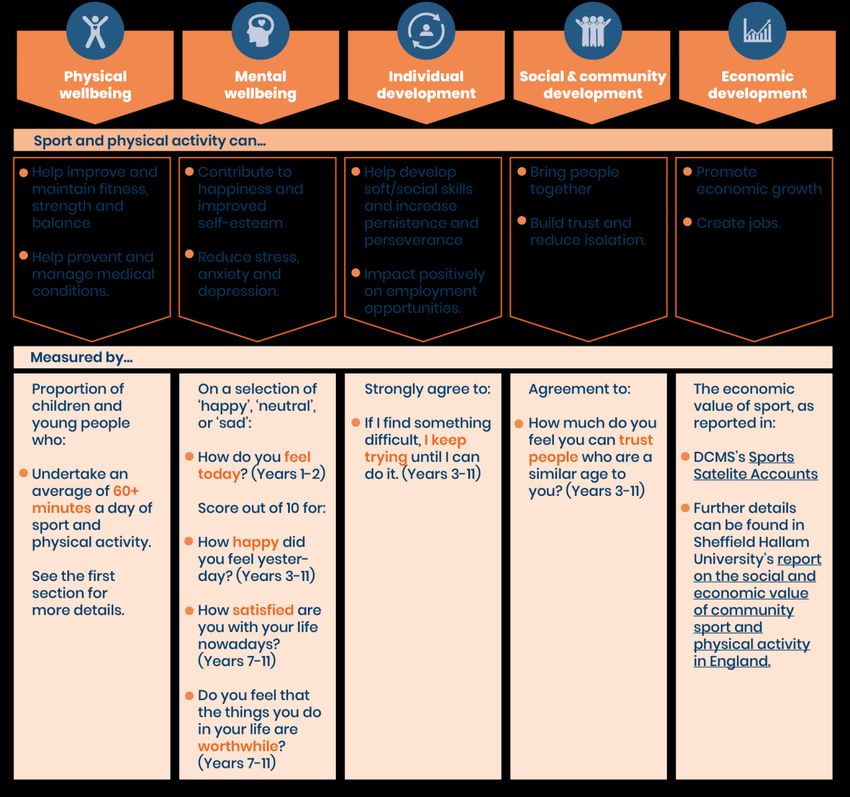
Welcome
          Welcome to the third annual Active Lives Children and Young People Survey report,
          summarising the activity levels of 5 to 16-year olds in England from September 2019
          to July 2020.

          The period covered includes the disruptive storms last February, which resulted in
          school closures and the cancellation of many outdoor activities, and the
          unprecedented disruption caused by the coronavirus (Covid-19) pandemic, which
          primarily impacted the summer term.

          The disruption also impacted the collection of data. We were unable to collect any
          data during the last two weeks of the spring term (late March) when schools were
          closed, while we also had to switch from school to at home completion for the
          summer term.

          As a result, we don’t have data covering the first full lockdown. Our summer term
          data starts from mid-May, when restrictions began to be eased. In this report, we
          reveal the impact of these disruptions, the children and young people most
          affected, and the extent to which children and young people switched into
          alternative or adapted activities over the year.

          As with our most recent adult survey, we’ve taken the decision to publish two
          reports.

          This main report covers the full 2019/20 academic year, and highlights some of the
          changes that occurred during the pandemic. This report should be read in
          conjunction with the standalone Coronavirus Report, which focuses solely upon the
          picture during the summer term.

          As ever, I’d like to thank the schools, children, parents and teachers who took the
          time to complete the survey, and the network of Active Partnerships who’ve once
          again played a key role in working with the schools, particularly during the hugely
          disrupted summer term.

          Lisa O’Keefe Insight Director
                                                                                                3
Levels of activity           Definition

                             What do we mean by sport and physical activity?
This chapter presents
information on three
levels of activity:

•   Active (an average of
    at least 60 minutes a
    day)

•   Fairly active
    (an average of 30-59
    minutes a day)

•   Less active (less than
    an average of 30
    minutes a day).

                                                                               4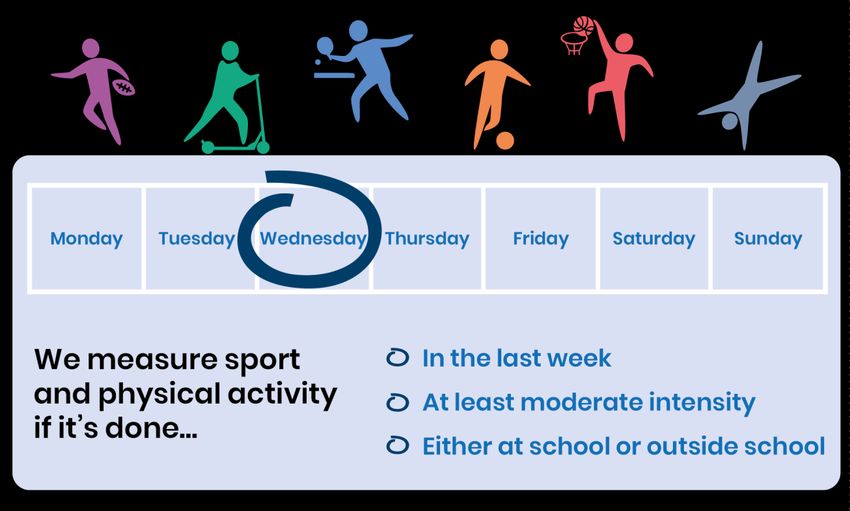
Levels of activity

Headlines
Our data shows that 44.9% of children and young people (3.2 million) are meeting the Chief Medical Officer guidelines of taking
part in sport and physical activity for an average of 60 minutes or more every day. Meanwhile 31.3% (2.3m) do less than an average
of 30 minutes a day.

            Less active                        Fairly active                                    Active

            Less than an                   An average of 30-59                           An average of 60+
            average of 30                     minutes a day                               minutes a day
            minutes a day

            31.3%                              23.8%                                       44.9%
           31.3% of children                  23.8% (1.7m) are                              44.9% (3.2m)
         and young people                     fairly active but                           do an average of
         (2.3m) do less than                   don’t reach an                              60 minutes or
          an average of 30                     average of 60                                more a day
            minutes a day                      minutes a day

Link to data tables
                                                                                                                                     5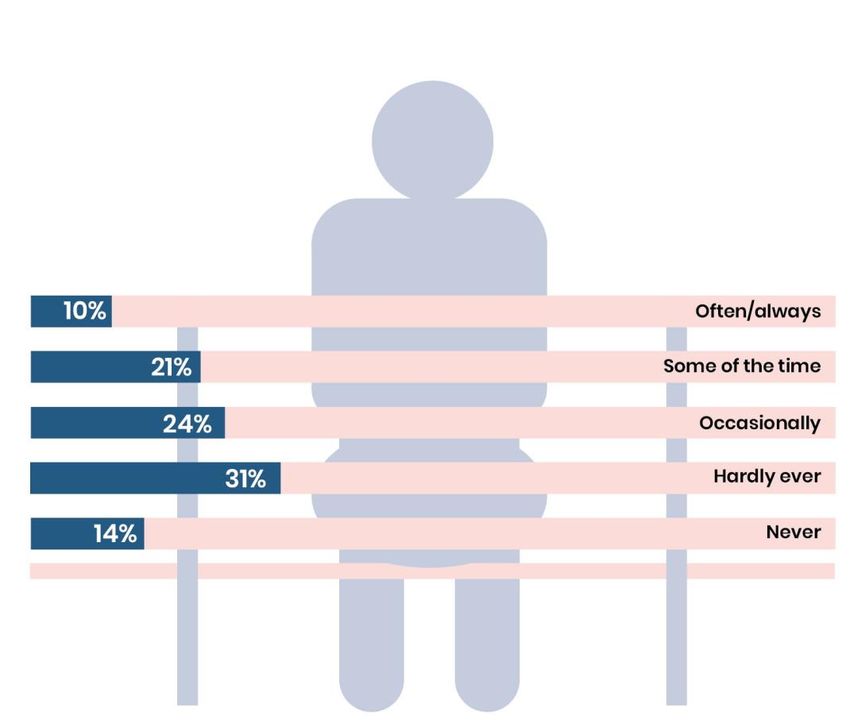
Levels of activity

    Summary of change
    The proportion of children and young people in
    England who are active has decreased by 1.9%
    over the past 12 months (a drop of 86,500).
    Activity levels remain up compared to 2017/18.

    There’s been an increase of 2.4% (201,400) in the
    proportion who are less active over the last year.
    Levels remain down compared to 2017/18.

    The autumn term saw growth in activity levels,
    but reductions came across the spring and
    summer terms (between January and late-July):

    • The spring term saw multiple storms in
      February which caused widespread disruption
      (of a scale last experienced in January 2018).

    • The summer term (covering the period of
      easing restrictions) saw unprecedented
      disruption due to the coronavirus pandemic,
      with school sites closed to most pupils and
      many activities either severely restricted or
      delivered in a different way. See our
      Coronavirus Report for further analysis.

                                                             Note: Due the dates of the school terms, the first phase of full lockdown (mid-March to
                                                             mid-May) is not covered in this data. The summer term (mid-May to late-July) covers
                                                             the period of easing restrictions. See our Coronavirus Report for further details.
   Link to data tables
                                                                                                                                                       6
Click here to read more about the impact of the pandemic in our Coronavirus Report
Note: All data relates
                                                                                      to young people in
    Levels of activity                                                                Years 1-11 (ages 5-16)

                                                                                 3   Year group
    Summary of demographic differences                                               Activity levels are
                                                                                     lowest for school
    Our data shows there are significant inequalities:
                                                                                     Years 3-4 (ages 7-9,
                                                                                     38%) and highest for
                                                                                     those in Years 7-8
                                                                                     (ages 11-13, 51%).

       1   Gender
           Boys (47% or 1.7m) are
           more likely to be
           active than girls (43%                                                4   Disability and long-
           or 1.5m), with a gap of                                                   term health conditions
           213,000 between                                                           Activity levels
           them.                                                                     amongst children and
                                                                                     young people with a
                                                                                     disability or long-term
                                                                                     health condition are the
                                                                                     same as for those
                                                                                     without one.
      2    Family affluence
           Those from low
           affluence families are
           the least likely to be                                                5   Ethnicity
           active (38%).                                                             Black children
                                                                                     and young people
                                                                                     are the least likely
                                                                                     to be active (35%).

                                       * See our definitions page for the full
   Link to data tables                 definition of each demographic group.
                                                                                                                7
Click here to read more about the impact of the pandemic in our Coronavirus Report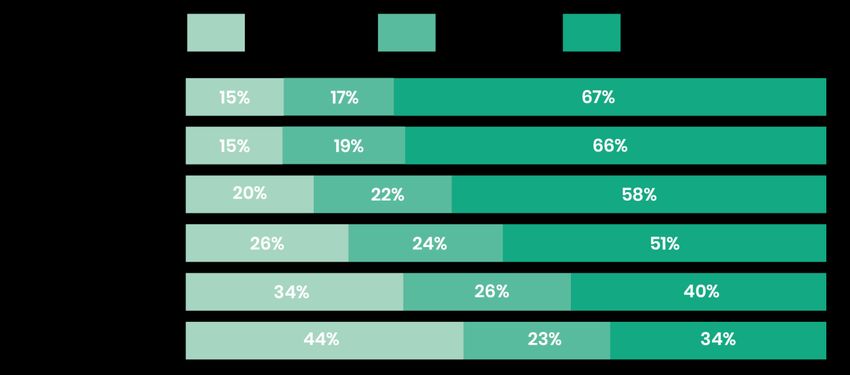
Levels of activity
     School year group
     Activity levels have fallen back for Years 1-2 (ages 5-7) and Years 3-6 (ages 7-11). In contrast, activity levels remain up compared to 2017/18 for
     those in Years 7-8 (ages 11-13), whilst we’ve continued to see increases amongst those in Years 9-11 (ages 13-16).

     During the spring term, activity levels of younger children decreased whilst young people in years 9-11 (ages 13-16) saw an increase. Given the
     poor weather and storms, this reflects the fact that a lot of younger children’s activity takes place outdoors, whereas older young people tend
     to have more choice, with gym or fitness activity more important for this group.

     During the summer term, coronavirus restrictions had the greatest negative impact on activity levels for boys in Years 5-6 and upwards (ages
     9+). See our Coronavirus Report for further details on the impact of the pandemic on children and young people’s activity levels.

     Active (an average of
     60+ minutes a day)

   Link to data tables
                                                                                                                                                           8
Click here to read more about the impact of the pandemic in our Coronavirus Report
Levels of activity

    Gender
    Despite a fall in activity levels compared to 12 months ago, boys (47%) remain more likely to be active than girls (43%). The decreases over
    time in activity levels for boys have been driven by the younger age groups.

    Our Coronavirus Report shows that, whilst boys saw a decrease in activity levels during the summer term compared to 12 months ago, girls
    were generally able to maintain activity levels.

                                                                               With the exception of Years 1-2 (ages 5-7) where there's no
    Active (an average of 60+ minutes a day)                                   reportable gender gap, the gap between boys and girls who are
                                                                               active narrows as children get older.

   Link to data tables
                                                                                                                                                   9
Click here to read more about the impact of the pandemic in our Coronavirus Report
Levels of activity
Family affluence
Children and young people from the most affluent families are generally more active than those from medium affluence families, who in turn
are generally more active than those from the least affluent families.
Activity levels have decreased for children and young people from low affluence groups, whilst they remain unchanged compared to 12
months ago for the two other groups. This has been driven by a decrease during the spring term, which coincided with multiple storms and
floods across the country, indicating the important role school plays in providing opportunities for children and young people from the least
affluent families.
Active
(an average of 60+ minutes a day)
Note: See our definitions
page for more details on
family affluence.
Link to data tables
10
Click here to read more about the impact of the pandemic in our Coronavirus ReportLevels of activity
Disability and long-term health conditions
Around 6%, or just over 440,000, children and young people have a disability or long-term health condition.
There’s little difference in activity levels between those with and without a disability or long-term health condition. Furthermore, there are no
reportable differences regardless of the number of impairments a child has.
Active (an average of 60+ minutes a day)
Note: A new question
was introduced for
2019/20 to capture
consistent disability
and long-term health
condition data across
all year groups. As such,
data is not comparable
with earlier years. See
the notes page for
more detail.
Link to data tables
11
Click here to read more about the impact of the pandemic in our Coronavirus ReportLevels of activity
Ethnicity
Children and young people from White British backgrounds are more likely to be active than all other ethnic groups, except for White Other.
Decreases in activity levels compared to 12 months ago have been driven by children and young people of Mixed and Black ethnicities.
The gender gap in activity levels is widest amongst Asian and Black children and young people, with boys being more likely to be active than
girls.
Active (an average of 60+ minutes a day)
Note: After White British, the largest ethnic groups within the child population are Asian (9%) and
Mixed (7%). White Other (5%), Black (5%) and other ethnic groups (4%) then follow, so caution should
therefore be applied when looking at change for these groups.
Link to data tables
12
Click here to read more about the impact of the pandemic in our Coronavirus ReportTypes of activity Definition
This chapter presents Looking at participation at least once in the last week
data broken down by provides:
activity group and looks • An entry level view of participation overall
at those who’ve • An understanding of which activities contribute to the
participated at least once make-up of an active day.
in the last week.
Data is also provided for
swimming confidence
and capability within this
section.
Link to data tables
13Types of activity
Most activities have seen Ten most prevalent activity groups for Years 1-11 (ages 5-16)
drops in those taking part
Some activities were unavailable in the
summer term, either due to the
majority of children not being in school
or because facilities were closed.
This is reflected in the drops in
swimming, team sports and
gymnastics, trampolining and
cheerleading compared to 12 months
ago.
Active play and running, athletics or
multi-sports also saw a decline in
participation.
Conversely, more children and young
people have been walking, with an
increase of 4.3% going for a walk (up by
more than 340,000) and an increase of
10.0% walking to get to places (up by
more than three-quarters of a million).
Note:
Team sports refers to a
Additionally, amongst young people in
group of activities that
Years 7-11 (ages 11-16) we’ve seen are typically played in
increases in gym or fitness and cycling teams. All participation in
for fun or fitness. these activities is included
regardless of whether it's
team play, training or
individual skills.
Note: Individual activities are
Link to data tables reported in the data table.
14
Click here to read more about the impact of the pandemic in our Coronavirus ReportSwimming confidence
and capability
Among Year 7 children, 77% can swim
25 metres unaided
Guidelines indicate that children should be able to swim
competently, confidently and proficiently over a
distance of at least 25m by the time they leave primary
school. The data shows that 77% of children in Year 7 (first
Can swim 25m unaided
year of secondary school, ages 11-12) can do this. There’s
been no change in this compared to 12 months ago.
Generally, swimming proficiency increase with age
and an average of 64% of all children and young
people in Years 1-11 (ages 5-16) can swim 25m
unaided. This remains the same as 12 months ago.
However, this differs greatly depending on affluence,
with 84% of children and young people from the most
affluent families being able to swim 25m unaided,
compared to 41% of those from the least affluent
families.
Link to data tables
15
Click here to read more about the impact of the pandemic in our Coronavirus ReportVolunteering
At least twice in the
Definition
last 12 months
We count a child or young person as having volunteered if:
Giving your time helping
others to be active is
They’ve taken part in a
amazing, no matter what volunteering role to
age you are. Not only are support sport/physical
they benefitting, but you activity
benefit too; gaining
(A full list of roles can be
experience, making friends found in our definitions at the
and learning new skills. end of this report).
And evidence suggests
that those who give their
time when they’re young
are more likely to continue
to volunteer in later life. A person has volunteered
at least twice in the last
twelve months
Link to data tables 16
Note: The volunteering questions were only asked of children in Years 5-11.Volunteering
1.6 million (36%) children and young people volunteered to support sport and physical activity
Volunteering levels have decreased by 1.8% or 36,300 children and young people over the last 12 months. This has been driven by a drop in the
summer term which coincided with school sites being closed to most pupils due to the coronavirus pandemic and opportunities to volunteer
may have been more limited.
Decreases in volunteering levels have been seen across both Years 5-6 (ages 9-11) and Years 7-8 (ages 11-13). Volunteering levels remain
unchanged for Years 9-11 (ages 13-16) with 30% volunteering to support sport and physical activity.
Volunteered at least twice in the last year
Note: Volunteering is
only asked of children
and young people in
Years 5-11 (ages 9-16),
with Years 5-6 (ages
9-11) having a slightly
different question to
Years 7-11 (ages 11-16),
to ensure the
volunteering roles
asked about are
relevant.
Link to data tables 17Volunteering Volunteer roles vary by age Children in Years 5-6 (ages 9-11) who volunteer are most likely to undertake supporting roles such as setting up and clearing away. Decreases have been driven by drops in the numbers who are a sports leader or ambassador and those undertaking other help. Conversely, half of young people in Years 7-11 (ages 11-16) who volunteer do so in more formal roles like coaching, being a sports ambassador or refereeing/being an official. Decreases have come amongst those who refereed, umpired, stewarded or marshalled. Years 5-6 (ages 9-11) roles undertaken by those who Years 7-11 (ages 11-16) roles undertaken by those who have volunteered at least twice in the last year have volunteered at least twice in the last year Link to data tables 18
Note: All data relates
Volunteering                                to young people in
                                            Years 5-11 (ages 9-16)

Summary of demographic profile

  1                               3
Gender                           Disability and long-term
Boys and girls are               health conditions
fairly equally
                                 The profile of children and
represented
                                 young people with a limiting
amongst
                                 disability or long-term health
volunteers.
                                 condition who volunteer is
                                 roughly representative of the
                                 population.

 2                               4
 Family affluence                Ethnicity
 Children and young              The volunteer profile
 people from the                 generally reflects the
 least affluent                  ethnicity of the
 families are under-             population, with the
 represented. They               exception that Asian
 make up 19% of                  children are under-
 those in Years 5-11             represented as they
 (ages 9 to 16), but             make up 11% of the
 only 14% of                     population but only
 volunteers.                     9% of volunteers.

Link to data tables                                                  19
Wellbeing, individual Outcomes
and community
development
definition
This section presents data
looking at the wider
outcomes for children and
young people, both overall
and linked to their levels of
engagement in sport and
physical activity.
Measures covered are:
• Mental wellbeing
• Individual development
• Social and community
development.
Link to data tables 20Mental wellbeing
There’s a positive association between levels of engagement in sport and physical activity and
levels of mental wellbeing
Mental wellbeing (shown here as happiness) scores are higher for those who are active than those who are fairly active, which in turn are
higher than for those who are less active.
There’s also a positive association between all mental wellbeing measures and volunteering to support sport and physical activity.
How happy did you feel yesterday? Years 3-11 (ages 7-16)
(mean score out of 10, where 10 is very happy and 0 is not happy at all)
Link to data tables
21
Click here to read more about the impact of the pandemic in our Coronavirus ReportIndividual
development
There’s a positive association between levels of sport and physical activity and levels of
individual development
The proportion strongly agreeing with the statement ‘if I find something difficult I keep trying until I can do it’ is higher for those who are
active than those who are fairly active or less active.
There’s also a positive association between individual development and volunteering to support sport and physical activity.
If I find something difficult, I keep trying until I can do it: Years 3-11 (ages 7-16)
(proportion who strongly agree)
Link to data tables
22
Click here to read more about the impact of the pandemic in our Coronavirus ReportCommunity
development
There’s a positive association between levels of sport and physical activity and levels of
community development
Active children and young people are more likely to strongly agree that they can trust people of a similar age to themselves than fairly
active children and young people, who in turn are more likely to strongly agree than those who are less active.
There’s a clear positive association between community development and volunteering to support sport and physical activity.
How much do you feel you can trust people of a similar age to you? Years 3-11 (ages 7-16)
(proportion who say ‘a lot’ when given the choice of ’a lot’, ‘a bit’, ‘not very much’ or ‘not at all’)
Link to data tables
23
Click here to read more about the impact of the pandemic in our Coronavirus ReportLoneliness Definition
Tackling loneliness is a key Supporting children and young people to have meaningful social
government objective. relationships is not just crucial to their physical and mental health. It
also affects their engagement in their school and wider community
In October 2018, the cohesion.
Department for Digital, Culture,
Media and Sport published We’ve focused on those who are often/always lonely, as policy is
‘A Connected Society’, its first centred around this group.
strategy for tackling loneliness
How often do you feel lonely?
in England.
This chapter sets out the role
sport and physical activity –
and volunteering to support it
– has in this.
Note this question is only asked
of children and young people
in Years 7-11 (ages 11-16).
24Loneliness
Young people who engage in sport and physical activity Loneliness is particularly prevalent amongst certain
are less likely to feel lonely groups
• Those who are fairly active are less likely to feel lonely than Loneliness is highest for:
those who are less active. • Teenagers (Years 9-11, ages 13-16, 12%)
• Those who volunteered are less likely to feel lonely than • Girls 12% (vs boys 7%)
those who didn’t volunteer. • Those with a disability or long-term health condition (24%)
• Those from the least affluent families (13%).
Often/always feel lonely (Years 7-11, ages 11-16)
Often/always feel lonely (all activity levels)
This association holds across demographic groups for both
participation and volunteering, with the exception that for
girls there’s no difference in loneliness by activity level.
Link to data tables
25
Click here to read more about the impact of the pandemic in our Coronavirus ReportPositive attitudes Definition
When talking about individual attitude statements, we report where a child strongly agrees1 with
The International Physical a statement as evidence of positive feelings towards it. For example, when a child strongly
agrees that they enjoy taking part in sport, we describe that child as enjoying sport and physical
Literacy Association’s definition
activity. These statements were developed by an expert advisory group commissioned by the
of physical literacy has four Department for Digital, Culture, Media and Sport and Sport England.
elements: motivation,
confidence, competence and
knowledge and understanding.
The organisation says these help
an individual “value and take
responsibility for engagement in
physical activities for life”.
Source: The International Physical
Literacy Association
We used this definition to
develop statements covering
each of the five attitudes that we
added to the survey.
1Bylooking specifically at those who “strongly agree”, we both mitigate the tendency of
children and young people to “agree” to socially desirable statements, and focus on
Link to data tables how the firmest attitudes relate to activity and health and social outcomes. 26Positive attitudes
Attitudes remain unchanged over the last two years
Just over half of all children and young people strongly agree that they enjoy taking part, but this means 49% aren’t likely to receive the full
benefits of doing so.
More than two-thirds of children and young people feel they understand why exercise and sport is good for them, whilst levels of feeling
confident when taking part or finding sport easy (competence) are lower.
There have been no changes compared to 12 months ago across any of the attitudes, although changes were observed during the
summer term. Given the unprecedented scale of these changes they’re summarised on the next page, as well as being explored in more
detail in our Coronavirus Report.
Attitudes towards sport and physical activity
(proportion who strongly agree)
Years 1-2 (ages 5-7) children
The majority of children found sport easy whilst
nearly two-thirds loved being active and 58%
loved playing sport. None of these have
changed compared to 12 months ago.
Link to data tables
27
Click here to read more about the impact of the pandemic in our Coronavirus ReportPositive attitudes
Summary of summer term (mid-May to late-July) changes
There are important inequalities that must be
1 Positive attitudes towards sport and physical 3 tackled
activity have decreased compared to the
same period 12 months earlier, with fewer Those from the least affluent families are less
children and young people strongly agreeing likely to report positive attitudes to sport and
that they felt confident when taking part and exercise. Furthermore, they saw notable
that they found it easy (competence). decreases in enjoyment, confidence and
competence widening the gap to those from
the most affluent families who only saw a
small drop in competence alongside a small
2 Physical literacy changes with age
increase in understanding.
As children and young people grow older, they
report lower levels of enjoyment, confidence,
competence and understanding. However, in
the summer term younger children,
specifically those in Years 5-6 (ages 9-11),
reported lower levels of both enjoying taking
part and understanding why it’s good for them.
28
Click here to read more about the impact of the pandemic in our Coronavirus ReportPositive attitudes
The presence of positive attitudes
The number of positive attitudes (proportion who strongly agree)
We can also look at the data by the number
of positive attitudes a child reports.
There has been an increase of children in
Years 3-6 (ages 7-11) reporting zero positive
attitudes and a decrease in those reporting
two.
There’s a fairly even spread across the
numbers of positive attitudes with children
slightly more likely to report one, two or three
positive attitudes than zero or four.
On the other hand, young people in Years 7-
11 (ages 11-16) have seen a small decrease in
those reporting zero positive attitudes and a
small increase in those reporting two.
Young people in Years 7-11 are still most likely
to report zero or one positive attitude.
Link to data tables
29
Click here to read more about the impact of the pandemic in our Coronavirus ReportPositive attitudes Activity levels across the week
and activity levels
Years 3-6 (ages 7-11)
Physically literate children
and young people are
more likely to be active
There’s a strong positive association
between activity levels and the
number of positive attitudes children
and young people report:
• 55% of children in Years 3-6 (ages
7-11) are active when they report
four positive attitudes, compared
to just 28% when they report no
positive attitudes.
• 67% of young people in Years 7-11 Years 7-11 (ages 11-16)
(ages 11-16) are active when they
report five positive attitudes,
compared to just 34% when they
report no positive attitudes.
Link to data tables
30
Click here to read more about the impact of the pandemic in our Coronavirus ReportPositive attitudes
and happiness
How happy did you feel yesterday
(mean score out of 10)
Physically literate children and
young people are happier Years 3-6 (ages 7-11)
Children in Years 3-6 (ages 7-11) who report
four positive attitudes score on average 8.0
out of 10 on happiness. This falls to 7.2 for
those who report no positive attitudes.
There’s a clearer positive association
between the number of positive attitudes
reported and high levels of happiness for
young people in Years 7-11 (ages 11-16).
Those who report five positive attitudes score
on average 7.5 out of 10 on happiness. This
falls to 5.6 for those who report no positive
attitudes.
Years 7-11 (ages 11-16)
Link to data tables
31
Click here to read more about the impact of the pandemic in our Coronavirus ReportPositive attitudes
and individual
development
If I find something difficult, I keep trying until I can do it
(proportion who strongly agreed)
Physically literate children and
young people have higher levels Years 3-6 (ages 7-11)
of individual development
Of children in Years 3-6 (ages 7-11) who report
four positive attitudes, 69% strongly agree to
the statement ‘if I find something difficult I
keep trying until I can do it’. This falls to 18% for
those who report no positive attitudes.
Of young people in Years 7-11 (ages 11-16) who
report five positive attitudes, 53% strongly
agree to the statement ‘if I find something
difficult I keep trying until I can do it’. This falls
to 10% for those who report no positive
attitudes.
Years 7-11 (ages 11-16)
Link to data tables
32
Click here to read more about the impact of the pandemic in our Coronavirus ReportPositive attitudes
and community
development
How much do you feel you can trust people of a similar
Physically literate children and age to you? (proportion who said ‘a lot’)
young people have higher levels
Years 3-6 (ages 7-11)
of community development
Of children in Years 3-6 (ages 7-11) who have a
positive attitude to all four statements, 41%
strongly agree that they can trust people of a
similar age to themselves. This falls to 27% for
those who report no positive attitudes.
There’s a clearer positive association between
the number of positive attitudes reported and
high levels of community development for
young people in Years 7-11 (ages 11-16).
Of those who report five positive attitudes, 35%
strongly agree that they can trust people of a
similar age to themselves compared to 16% of
Years 7-11 (ages 11-16)
those who report no positive attitudes.
Link to data tables
33
Click here to read more about the impact of the pandemic in our Coronavirus ReportLocal level data
Data for local areas The picture across England
(regions and Active
Partnerships) are available
for the following measures:
• Levels of activity
• Volunteering at
least twice in the
last 12 months.
Link to data tables
34Definitions
Moderate activity is defined as activity where Positive attitudes
you raise your heart rate and feel a little out of This refers to strongly agreeing to the
The Chief Medical Officer breath (in 2018/19 this was updated to ask statements on enjoyment, confidence,
recommends that children and whether the activity made them breathe faster competence, understanding and
young people do an average of than sitting down reading). knowledge. If a child or young person
strongly agrees, they’re reported as
60-plus minutes of at least Vigorous activity is defined as activity which having a positive attitude towards that
moderate activity a day across makes you hot or tired. element.
the week. This effectively means
they need to do 420 moderate Volunteering roles are defined as: Associations
minutes or more a week to meet • Been a ‘sports leader’ or ‘sports Where associations between wellbeing,
ambassador’ individual and community development
the guidelines, which you can • Helped with setting up or clearing away and engagement in sport and physical
read here. (Years 5-6 only) activity are referenced, this doesn’t tell
• Helped with refreshments: food or drink us about causality. We don’t know the
(Years 5-6 only) direction of the association or whether
• Coached or instructed an individual or we’re seeing a direct or indirect link.
team(s) in a sport, dance or fitness activity:
other than solely for family members (Years
7-11 only)
• Refereed or umpired at a sports match,
competition or event (Years 7-11 only)
• Acted as a steward or marshal at a sports or
dance activity or event (Years 7-11 only)
Link to more information on • Given any other help (Years 5-6 only)
measures and demographics • Provided any other help for a sport, dance or
fitness activity, e.g. helping with
refreshments, setting up sports kit or
equipment, scoring matches, first aid (Years
7-11 only).
35Definitions
Age Disability
The survey is undertaken in schools, Disability or long-term health conditions
therefore we’ve used school year as the refer to children and young people who
main age variable. This is split into three report they have a disability, special need
Standard demographic groups: or illness which has a big effect on their life
questions are not always • Infant, Years 1-2 (ages 5-7) (is limiting) and expected to last for a year
applicable for children of all • Junior, Years 3-6 (ages 7-11) or more (is long term). Children then select
ages, therefore simpler • Secondary, Years 7-11 (ages 11-16). from a list of impairments which we use to
questions were often used. create the number of impairments metric.
Gender The data presented refers to long-term
Children and young people were given the limiting impairments.
option to select ‘boy’, ‘girl’, ‘other’ or ‘prefer
not to say’. Responses to ‘other’ are The question used is designed to align as
included in the data tables but not closely as possible to the Office for
presented in this report due to low sample National Statistics (ONS) harmonised
sizes. As a result, the volunteering profile of disability question with the language
responses by gender does not sum to 100%. adapted to be more appropriate to
children. This is an updated question for
Family affluence scale 2019/20 and unlike previous years, the
The Family Affluence Scale gives an same question is asked to all age groups.
indication of the social status of children As such, data is not comparable with
and young people’s families. The scale is previous years and only the latest data is
derived from a series of questions about presented in this report.
their home and family such as car
ownership, computers, and foreign Ethnicity
Link to more information on holidays. Care should be taken when Children and young people in Years 3-11
looking across year groups as the age of were asked a simplified question about
measures and demographics
the child is likely to impact on certain ethnicity, while parents of Years 1-2
elements of the scale (e.g. families with children were asked the full ONS standard
older children may be more likely to own question. For the purposes of analysis,
digital devices and travel abroad). Chinese has been grouped with ‘Other’
from the parent responses.
36Notes
The achieved sample Given the limited availability of
Behavioural responses: demographic population data by school
The Active Lives Children and • Pupils in Years 3-11 and parents of pupils year, the weighted profile of the survey has
Young People Survey is an online in Years 1-2: 109,503 in 2017/18 and 113,728 in been used to generate these proportions
2018/19 and 89,303 in 2019/20 as the survey is weighted to be nationally
survey. Carried out by Ipsos MORI,
representative.
it involves online questionnaires Attitudinal responses:
being completed in school • Pupils in Years 3-11: 104,263 in 2017/18 and Confidence intervals can be found in the
during lesson time (at home 109,248 in 2018/19 and 86,222 in 2019/20 linked tables. These indicate that if
during the summer term). • Pupils in Years 1-2: 25,927 in 2017/18, 23,587 repeated samples were taken and
Parents of Years 1-2 children are in 2018/19 and 14,576 in 2019/20 confidence intervals computed for each
sample, 95% of the intervals would contain
asked to complete a separate Data have been weighted to Department the true value. Only significant differences
online questionnaire providing for Education (DfE) pupil population are reported within the commentary.
behavioural data for these estimates from ‘Get Information about Where results are reported as being the
children – the children Schools’ (2016/17, 2017/18 and 2018/19) for same for two groups, any differences fall
themselves answer basic geography and key demographics. within the margin of error.
questions about their attitudes Population totals are estimated values and Significance tests can be found in the
only. have been calculated using 2017/18, 2018/19 linked tables. The tests indicate that if
and 2019/20 DfE pupil population estimates. repeated samples were taken, 95% of the
More information on the survey Confidence intervals also apply to these. time we would get similar findings, i.e. we
More detail can be found here. can be confident that the differences seen
can be found here.
in our sampled respondents are reflective
Link to more information on Population profile of the population. When sample sizes are
measures and demographics Throughout the volunteering section, to smaller, confidence intervals are larger,
show the representativeness of volunteers, meaning differences between estimates
the demographic profile of volunteers has need to be greater to be considered
been compared to the population profile. statistically significant.
37Notes
How we measure change Data collection during the coronavirus
Figures reported are based on the pandemic
Sport spectating responses of the children and young Fieldwork ended two weeks early in the
While not covered in this report, people (and parents of Years 1-2) spring term 2020 when the coronavirus
sampled, which we then scale up to pandemic hit and started slightly later
data tables showing the number
provide an England-wide picture. That (mid-May) in the summer term.
of people attending live sports means there will naturally be small
events form part of this release. fluctuations when we compare the During the summer term, most pupils
figures we have now with 12 months ago. completed the survey at home rather
than at school as is usually the case. As
In accordance with Government a result, at and outside school
Statistical Service good practice breakdowns are not presented in this
guidance, we highlight changes within report.
the report where we’re confident that
they’re genuine differences. If the data is Small questionnaire changes were
showing only small differences which are made to ensure the survey remained
within the margin of error, they’re noted relevant in the summer term. More
as “no change”. details of these can be found in the
technical note.
All changes reported are percentage
point changes. We’ve used ‘%’ as
shorthand to represent this throughout.
Link to data tables Link to more information on
measures and demographics
38You can also read