Activity-based modeling and simulation of epi-demics - TRANSP-OR, EPFL Cloe Cortes Balcells Rico Krueger Michel Bierlaire September 2021 - Swiss ...
←
→
Page content transcription
If your browser does not render page correctly, please read the page content below
Activity-based modeling and simulation of epi-
demics

Cloe Cortes Balcells
Rico Krueger
Michel Bierlaire

TRANSP-OR, EPFL                                            September 2021

 STRC                  21st Swiss Transport Research Conference
                   Monte Verità / Ascona, September 12 – 14, 2021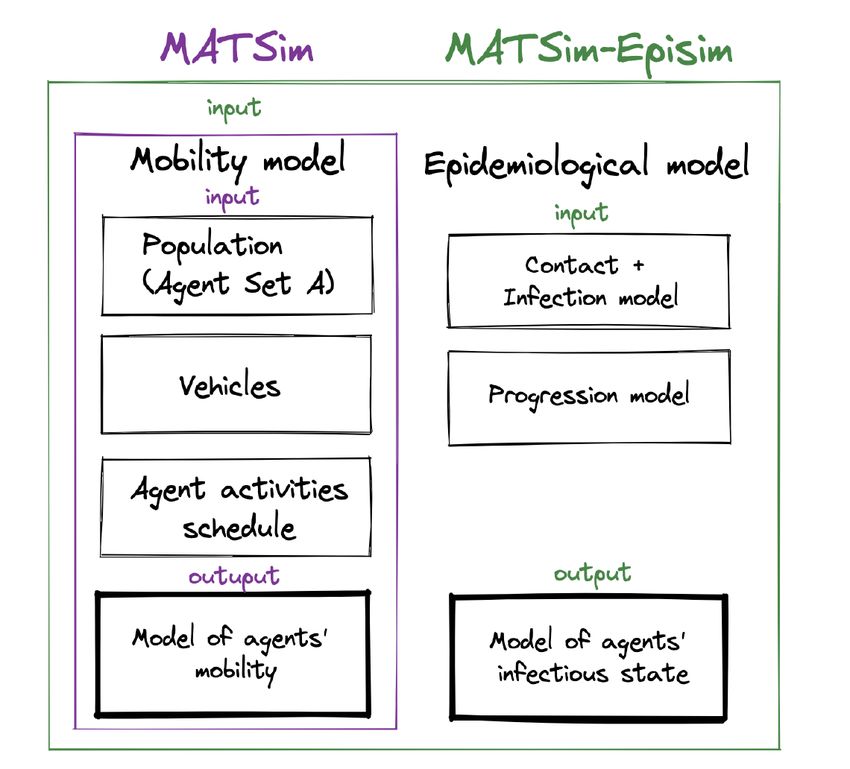
Transport and Mobility Laboratory (TRANSP-OR), EPFL

Activity-based modeling and simulation of epidemics

Cloe Cortes Balcells, Rico Krueger, Michel
Bierlaire
Transport and Mobility Laboratory
Ecole Polytechnique Fédérale de Lausanne
Station 18
1015 Lausanne
{cloe.cortes, rico.krueger ,michel.bierlaire}@epfl.ch
September 2021

Abstract

The SARS-CoV-2 outburst in March 2020 has led to the lockdown of several countries across
the world. Mobility restrictions have been constantly put into action and reversed to find the
trade-off between minimizing the number of infections and death and mitigating the inevitable
damage to the economy and the societal systems. These emergency measures lead to collateral
effects that prove the need for robust and dynamic models for policymakers to make efficient
and targeted decisions in short amounts of time. We desire to predict the impact that trips have
on the spreading and provide insight into the motivation behind the observed trips to generate
a suitable and unbiased response. For this reason, we aim at building a disaggregate model
using the agent-based approach to provide insights and forecasts on transport demand and its
epidemiological consequences. We will couple people’s daily activity schedules and infectious
disease spreading. This addition is especially appealing since it includes the different behaviors,
contact patterns, and population heterogeneity linked to the activities and their consequence of
spatial movement, especially during travel. Consequently, we believe that this method will help
to guide authorities to ultimately assess the effectiveness of different policy approaches based
on socio-economic variables.

Keywords

Agent-based model; SIR model; Policy decision making; SARS-CoV-2.
1 Introduction
There have been many contributions focused on epidemiological models so that disease spread
can be better understood, applied to the various viruses that humanity has faced in the last
two centuries (see Lemaitre et al., 2020). The SARS-CoV-2 situation has contributed to the
publishing of many papers in this direction. However, models that couple mobility of people
together with the spreading of a certain disease is a more recent research field. Specifically, there
is a gap when coupling public transportation planning and epidemiological disciplines. It seems
obvious that it is important to combine these fields if we need to plan for public transportation
logistics during and after a pandemic. Public transport is strongly affected by the SARS-CoV-2
situation; their services are either restricted, forced to apply social-distancing and capacity
measures, or even temporarily not working, (see Tirachini and Cats, 2020, Douglas et al., 2020,
Zheng et al., 2020, Lee and You, 2020). The level of public transport usage, the culture of
travelers, or the attributes of the country can influence how the service restrains mitigate the
pandemic. However, there is an impact on the ridership since travelers fear infection so they use
less public transport and switch to taxis and private cars ((Gerhold, 2020, De Vos, 2020, Baker
et al., 2020, Bansal et al., 2021)).
We propose to address this issue at a disaggregate level. The long-term goal is to provide insights
that transportation planners and public health authorities can exploit to deal with epidemic
situations. For instance, the C2Smart group from NYU ((Wang et al., 2020a)) uses MATSim
software ((MATSim, 2021)) together with deep learning to update travel trends and study the
impact of proposed phased reopening strategies. Also, in Section 2, we expose the state of the
art of this topic. Xinwu Qian ((Qian and Ukkusuri, 2021)) point out the two main challenges
facing this kind of model. Firstly, the ability to model different land use and activity patterns.
Secondly, while mobility brings people to their activity locations, it also brings massive contact
and contagion during travel. Lastly, we need to consider additional assumptions to be able
to account for spatial heterogeneity, see (see Qian and Ukkusuri, 2021). Based on the gaps
identified in the literature, we attempt to answer these two main research questions:
1. How can we capture the spread of a disease through transportation systems at a disaggre-
gate level?
2. What are the policy implications in terms of epidemic crisis management?
We propose an agent-based model coupled to a compartmental model based on disaggregate
contact probability dependent on multiple socio-economic and virological variables. The idea
is to define the probability of infection accounting for socio-economic variables, such as age,Figure 1: Schematic diagram gaps income, gender, home address, general state of health, etc., together with variables like the loca- tion where the infection is taking place, the surface in m2 of the activity, number of people, etc. We present a simulation procedure that will allow drawing the most likely infection probability for each agent of the network together as their mobility, the spreading associated with it, their recovery process and how their daily activity choice depends on the level of infection associated with this activity. The approach that we present in this paper has several advantages over existing epidemiological models in the field. First, all infection probability dimensions (socio-economic and virological) are modeled simultaneously. Second, the model produces an empirical distribution of individual activities vs infection that can be investigated with simulation. Last, the framework is built on first behavioral principles which means that we are able to understand what drives people to act in a certain manner. Also, it can be generalized to complex epidemiological situations, including immunity or vaccination. 2 Background Mathematical modeling for infectious disease spreading has emerged in the 18th century to study morbidity and mortality of smallpox, see (Gani, 2001). Daniel Bernouilli provided a model describing the spread of smallpox, which was prevalent at the time and argued the advantages of variolation (method of inoculation used to immunize individuals against smallpox). Thenceforth, multiple models have been developed for explaining the spread of a virus in a population.
From simple approaches, like (W. H. Hamer, 1906) who studies the evidence of variability and
persistency of type, to early compartmental models like (Kermack and Mckendrick, ????) or
recent and more advanced compartmental models like (Lemaitre et al., 2020). The latest and
more complex approaches are the well-known individual or agent-based models, (Eubank et al.,
2004a, Mancastroppa et al., 2020).

Specifically, deterministic compartmental models rely on differential equations that define the
dynamics of the flow between the different compartments. These deterministic models depend
on the mass action assumption, see Equation 12, to express the mixing between the various
groups of individuals. Network models are able to capture partially the failure of compartmental
models to represent the social structure relevant for the disease spreading. This methodology is
based on the graph theory, which means that it consists of nodes and links that stand for hosts
and their contacts respectively. However, it neglects the quality of the contacts and it is difficult
to manage the dynamic approaches for the network. The last category, agent-based models, will
be our main focus on the state of the art. They overcome all the disadvantages mentioned for the
other two model types. Particularly, we will study how to couple agent-based epidemiological
models together with activity-based models to link epidemics and mobility.

2.1 Activity-based models

Activity-based models have started to gain popularity in the last 50 years to advance trip-based
models, (see Castiglione et al., 2014, Elston, 2013, Bradley and Bowman, 2004), which do
not account for individuals’ complex behaviors. The main assumption of these models is that
people’s mobility is due to their need to perform their daily activities. For that reason, if we can
understand the reason and how individuals schedule their week, we can predict their mobility
choices and behavior. Therefore, we can state that these models establish that the need to do
activities drives travel demand in space and time, (Hägerstrand, 2005, Chapin, 1976). The
main roots of ABM are in modeling human social and organizational behavior and individual
decision-making. Agents are programmed to react to other agents and the computational environ-
ment around them. However, they are engaged in certain behavior rules that go from primitive
reactions to complex adaptive AI. All in all, ABM aims to be as behaviorally realistic as possible.

Two different approaches are used to develop ABM, see (Pougala, 2020) . Utility-based models
that rely on the assumption that the goal of agents in each step is to manage their schedule at
an optimized level so that their satisfaction is maximized, see (Wang and Timmermans, 2000,
Adler and Ben-Akiva, 1979a, Bowman and Ben-Akiva, 2001). The mobility behavior of the
agents is represented as the result of discrete choices, usually treated sequentially, and solved
with econometric methods like advanced discrete choice models (Bowman and Ben-Akiva,
2001, Wang and Timmermans, 2000), or with micro-simulations,(Recker et al., 1986, Pendyala
et al., 2005). The second activity-based model is the computational process model. It refutes
the assumption that decision-makers seek the optimal solutions, and argue that they consider
context-dependent heuristics (see Arentze and Timmermans, 2004, Golledge et al., 2005).

There exist many in-depth reviews of existing modeling concepts for activity-travel forecasting
(e.g. Bradley and Bowman, 2004, Kitamura, 1988, Rasouli and Timmermans, 2013, Axhausen
and Gärling, 1992).

2.1.1 Utility-based models

The first utility-based models are based on a disaggregate travel demand model system (c.f. Bow-
man and Ben-Akiva, 2001) and a multinomial logit model for household daily travel patterns (c.f.
Adler and Ben-Akiva, 1979b). The model by Adler and Ben-Akiva (1979b) considers that people
pick their mobility choices based on their household, the level of service of the transportation
system, and the set of economic and social activities. It assumes that the households plan their
schedule by optimizing the utility they gain from it, under budget and time constraints. The
second model, developed by (Bowman and Ben-Akiva, 2001), uses multinomial logit to compute
the choices of the individuals for every mode. These two models consider that the choice set of
the activities available and the scheduling decision process follow rules that decrease the number
of choices. Because of that, the trade-offs between the activities chosen cannot be accounted
for correctly. Habib Nurul (Nurul Habib and Miller, 2009), finds an activity-agenda approach
which stands for the set of different activities that pursue a schedule within a specific time frame.
This agenda maximizes the utility under the constraints of budget and time. The objective is to
capture the trade-off between scheduled and unscheduled activities. Habib Nurul (Nurul Habib,
2011) uses the agenda as an input in a discrete-continuous model that estimates activity choice.

The main challenge of these models is their computational complexity. That is the reason why
micro-simulators started gaining popularity in this field. The difference is that micro-simulators
compute a unique schedule for the individual, instead of choices probabilities for the different
alternatives. The first activity-based micro simulator that was completely operational was the
STARCHILD, (Recker et al., 1986). The main issue is that this model was fully deterministic,
and it does not represent a real decision process (for further literature review on this topic, see
Pougala (2020)).

Another example for a micro simulator is the TRANSIMS (Smith et al., 1995) which adopts
an activity-based approach to generate individual’s activities instead of O-D matrices. It has a
module that builds synthetic population based on census and survey data to estimate activities
for individuals and households and be able to plan multimodal trips ((Nagel et al., 2002)). The
approach used by (Smith et al., 1995, Pendyala et al., 2005), use sequential estimations of
the different dimensions of the daily mobility choices. Therefore, the interrelations that arise
between choices are difficult to include. To address that, we can cite (Charypar and Nagel, 2005)
who generate activity schedules through genetic algorithms. GA can consider activity type,
transportation mode, and the location at the same time. The utility fitness function is the sum of
the utility of all performed activities and the travel penalties, see equations 14 11 and 3, found in
(Charypar and Nagel, 2005):

           N−1
           X                  N−1
                              X
S plan =         S act ,q +         S trav,mode (q)                                              (1)
           q=0                q=0

The utility of an activity q is defined by:

S act ,q = S dur ,q + S wait ,q + S late.ar, q + S early.dp ,q + S short.dur ,q ,                (2)

and the travel disutility for a leg q is given as

S trav ,q =Cmode (q) + βtrav, mode (q) · ttrav ,q + βm · ∆mq
                                                                                               (3)
           + βd, mode (q) + βm · γd, mode (q) · dtrav ,q + βtransfer · xtransfer ,q

This utility function is notably used in the agent-based micro simulator MATSim (Horni et al.,
2016). We will focus on this tool in Section 3.4, called agent-based models that belong to the
epidemiological model section. MATSim allows to add modules straightforwardly, see (mat,
2016).
To conclude, representing decision processes employing utility functions is an important research
field. However, there is a potential contribution towards developing a simultaneous estimation
approach.
2.1.2 Computational process models
2.2 Epidemiological models
An introduction to the most well known model types used for simulating an infection spreading
is in the following subsections together with a description of their advantages and shortcomings.
To be specific, we discuss deterministic compartmental models, network models, and individual-
based models.
2.2.1 Compartmental models
The SIR model has three compartments: susceptible (S), infected (I), and recovered (R), and the
SEIR model has an additional compartment of exposed (E). Each compartment is represented by
several variables xi . The dynamics between these compartments are driven by flows, described
by differential equations, see (Kelman, 1985). These flows can go from compartment to
compartment or from compartment to environment, and they can be expressed as ( c.f (Sandberg,
1978):
n n
∂xi X X
= fi0 + fi j − f ji − f0i (4)
∂t j=1 j=1
t≥0 (5)
xi (0) = x0 (i) (6)
i = 1, 2, ..., n (7)
where xi is the number of individuals from compartment i; x0i is the initial value of i; f0i is the
flow from i to the environment, and fi0 is the inverse flow; finally, fi j and f ji stands for the flowfrom compartment i to j and j to i, respectively.
The SIR epidemic model can be written in the following way(c.f (Kiss et al., 2017)):
∂S S (t)
(t) = −βI(t) (8)
∂t N
∂I S (t)
(t) = βI(t) − γI(t) (9)
∂t N
∂R
(t) = γI(t), (10)
∂t
where S (t), I(t), S R(t), denotes the size of the susceptible, infected, and recovered compartment,
respectively. We can eliminate one equation by recognizing that S + I + R = N. We can see
that if R0 = β/γ < 1, the number of infected people decreases, while if R0 > 1 it will increase
if the initial value of susceptible people is close to the total number of the population. We can
define R0 as the average number of new infections caused by individuals that are infected in its
early stage inside a completely susceptible population, see (Diekmann and Heesterbeek, 2000,
Anderson and Mary, 1992). Note that the system tends to be disease-free when t → ∞, reaching
the steady-state since S and R are bounded between [0, N] and they are monotonic. Therefore,
since Ṙ → 0 and I → 0. If we assume that R(0) = 0 and that S (∞) + R(∞) = N, we have
equation 11 that we can solve by iteration to an arbitrary accuracy:
β
!
N − R∞ = S (0) exp − R∞ (11)
Nγ
Compartmental models applied to the epidemiological field rely on the idea of mass action
coming from chemical kinetics. The mass action principle defines the reaction rate v of a
chemical reaction:
v = k · [A] · [B] (12)
If reactants A and B are well-mixed, then k is a constant rate. In "The law of mass-action in epi-
demiology: A historical perspective" (Heesterbeek, 2005) we can find the origin of the analogy
between chemical collisions leading to chemical reactions and people’s collisions leading to
infection.
The main advantage of these models is their mathematical simplicity. Due to this characteristic,
compartmental models can be examined analytically which means that they are easy to manage
as well as interesting for scientific theorizing. However, this oversimplicity of considering thatevery compartment is fully mixed, neglects, as Soper (Soper, 1929) said in 1929, the ’imperfect mixture’. This can be defined as a difficulty to express heterogeneity, complex behavior, and contact patterns between individuals. Many authors (see (Smieszek, 2009), (Edmunds et al., 2006), (Edmunds et al., 1997) and (Liljeros et al., 2007)) have stated the importance of taking into consideration characteristics of the contacts, such as transient contacts, long-term relations, variability between the contacts that people have, etc. Not considering this might lead to erro- neous conclusions from simulation results. In addition to the simplicity in the social aspect, there are also a few in the biological one. For instance, pre-existing immunity or different levels of virus shedding (Smieszek, 2009). Also, the infectious period 1/γ is exponentially distributed which does not show its central tendency for most diseases. 2.2.2 Network models Network models overcome the weakness of compartmental models to simulate social hetero- geneity. We can find these complex representations in many different research fields, like the cell, predator-prey relations, the Internet, a network of routers and computers connected by physical links or language, among others. Authors (see Albert and Barabasi, 2001, Zverovich, 2021, MORRIS, 1993) present a careful analysis of structured mixing in network models to study the spread of AIDS. Real-world networks rely on graph theory (Bondy and Murty, 2008). Their components are nodes that represent the individuals, or also known as hosts, and the links that define the contact structure between the two hosts. Depending on the system that we need to simulate, these graphs can be undirected, directed, weighted, time-dependent, or combinations of these types. Also, in "Spread of the epidemic disease on networks" (Newman, 2002) introduces an example of a bipartite population in which he assumes a heterosexual population, and therefore, the only possibility is to link two nodes of different sex. If we want to define mathematically a graph G by a pair (V, E), where V is the set of nodes in the network, and E ⊂ V × V is the set of pairs of nodes, that are computed in the adjacency matrix whose entry gi j is 1, if (i, j) ∈ E, and zero otherwise. One of the most studied random graph models is the Erdos-Renyi model, see Gilbert (1959)
and Renyi
(1959). The graph G is defined by n vertices, and m edges: {G1 , G2 , . . . , Gn }, where
M
n = with M = N(N − 1)/2, and the probability of picking each graph is the same,
m
namely 1/n. The traditional Erdos Renyi models are essentially static graphs, which means
that the random graph is drawn just once, and does not change over time. However, in Mand-
jes et al. (2019) we can find two varieties of dynamic versions of the classical Erdos-Renyi graph.
Characterizing the network is extremely useful when studying the disease evolution in a par-
ticular scenario. Essentially, it is complex to find the correct adjacency matrix. Two cities
can have similarities in the spreading of disease but complete different adjacency matrices.
Therefore, it is convenient to have a few measures to quantify networks, for example, the de-
gree of distribution, assortative and disassortative mixing, clustering and higher-order structure,
shortest path length, and strong connectedness and cycles and tree graphs (see (Kiss et al., 2017)).
There are advantages that network models can provide, like for instance the addition of hetero-
geneity. However, there are a few challenges that are not solvable. The first one is that it is
difficult to use them in densely populated areas since it becomes a computationally intractable
environment. Except if we can find symmetries in the network and then lumping techniques
(see Nicola, 2021) can be applied. Moreover, if we want to ameliorate this aspect and be able to
understand the interaction of two individuals, we could use a mean-field approach (see Matsuda
and Sato, 1992, Keeling et al., 1997, Rand, 1999). The second disadvantage is the quality of
the contacts between two individuals. The adjacency matrices are binary. Therefore, they do
not consider the characteristics of the contact action between two people, like its duration or
the intensity. Generally, we can fix this by weighing the links by their transmission probability.
However, as aforementioned, the intensity variable and the duration depend on the time, so a
dynamic representation is required. The third weakness involves the static character of network
models. While compartmental models assume that the contacts change constantly, network
models assume a completely stable structure. Both have an unrealistic approach since stable,
long-term relationships tend to have high frequencies of contagion, whilst transient encounters
will likely never be repeated.
To conclude, network models work well for calculating disease outbreaks, understanding
the disease dynamics, and understanding the interaction between two individuals given a
distribution.Therefore, these models are more suitable for the analysis of diseases that spread in
relatively small populations such as sexually transmitted diseases. However, we can not study
what triggers people to go from one node to another, which characteristics in the populationdrive people to perform an activity, or the impact of getting infected to using a bus link instead of a car link. We would need a very complicated and computational expensive model to study a few socio-economics parameters. 2.3 Individual-centric models Individual-centric or agent-based models applied to the field of epidemiology are widely used to study the spread of infectious disease, see (Boots and Sasaki, 1999, Carpenter and Sattenspiel, 2009, Cauchemez et al., 2008, Atti et al., 2008, Das et al., 2007, Eubank et al., 2004b, Ferguson et al., 2005, 2006). These models provide flexibility for epidemiological modelers and they overcome the challenges mentioned in the previous two models. The model works by following people over time at an individual level through the different stages of the disease. The agent is the unit of analysis in these types of models; they perform on their own and interact with the environment, (Weiss, 2000, Quesada, 2007). Their interactions lead to outcomes that we define using probability distributions. Agents are the ones that pick up the pathogens with their behavior, carry them, and spread disease by releasing them. That is why one of the main advantages of these models is that they are intuitive to understand, which makes communication with decision-makers efficient. Contrary to compartmental model and network models, there is no easy boundary to define individual-based models. This is because there are similar kinds of approaches that take the individual as the main unit of analysis. However, we can find two main characteristics specific for individual-based models, see (Holland, 2006). The first one is parallelism, which means that the dynamics of the model are based on the interactions of the individual. They have a role towards the environment and at the same time, the environment affects them. The second one is that actions are conditional to the signals that the individual receives from the environment. These reactions can be fully deterministic or include an error term to make it stochastic. However, they follow a rule-based process: if an individual is susceptible and it has contact with an infected agent, it becomes infected with a probability p. In short, individual-based models are flexible and easy to interpret intuitively. Moreover, we can deal with the aggregation error. We can define the aggregation error as the intuitive idea that if we aggregate multiple individual behaviors, collectives will start acting accordingly. Also, it is straightforward to include considerations of activities, location choice, complex mechanisms,
etc. On the other hand, it is difficult to parametrize these models because of the lack of data.
For that reason, sensitivity analyses are more laborious than for other models. Besides the fact
that the level of detail is higher, also because of their stochasticity they can not be dealt with
analytically. It means high computing time and storage capacity.

As we have seen, there exist many in-depth reviews of existing modeling concepts for infectious
disease spreading. We will focus on the most advanced level of agent-based models, as well as
possible model expansions to include social interactions and methodologies to estimate or infer
policies optimization. Note that the difference between individual- and agent-based models lies
in the learning process. The latest has the capability of learning, evolving, and adapting to the
environment. (Johnson, 2001) defines it as the ability of low-level components of a population
to self-organize into a higher-level system of sophistication and awareness, and he presents
five fundamental principles to his hypothesis: more is different, ignorance is useful, encourage
random encounters, look for patterns and pay attention to your neighbors.

2.3.1 Synthesis

Agent-based models are the most advanced models for studying the spreading of infectious
diseases. The agent-based approach is well suited for implementing realistic and accurate
modeling of contact tracing and policies put into place. These models provide a more realistic
interaction between agents, by taking into account their daily activities, such as workplace,
education, their travel mode as well as socio-economic characteristics as gender, age or income.

Multiple authors, (like Hackl and Dubernet, 2019, Müller et al., 2020, Aleta et al., 2020,
Tuomisto et al., 2020), have shown that the most accurate results for obtaining policies are
obtained by simulating the spread of the epidemic coupled to a human mobility model. We
model how individuals move to know where they are at every timestep of the simulation.
On the other hand, we diffuse the virus and track the specifics of people’s interaction to as-
sess how the virus is spreading, to whom and where. As a result, this gives us a high level of
disaggregation that allows us to change specific aspects of the population or the virus effortlessly.

One of the most known activity-based models to forecast human mobility models is MATSim
(Horni et al., 2016). This simulation model has been used to study the impact of the COVID-19
on the New York City (NYC) transportation system (Wang et al., 2020b) or on the metropolitan
area of Berlin, Germany (Müller et al., 2020), among others. Using an agent-based mobility
simulation allows following population over time at an individual level while delivering the
network of co-presence for one day at their different activities over the whole agent population.
Agent-based modeling can capture complex behavior patterns and provide valuable information
about the dynamics of the real-world system that it imitates. Each agent has its parameters and
makes decisions based on a set of rules of their everyday dynamics (Bonabeau, 2002). Using
agent-based simulations for studying the mobility of a population allows overcoming problems
as not having data of a certain population.
For example in the POLYMOD study (Prem et al., 2017), the objective is to provide estimates
of age-specific contact rates for countries where data are not yet available. This is done by
combining data from 8 European countries used to project over 144 other countries, using
Bayesian hierarchical model to estimate the proclivity to provide projections of age-specific
contact patterns for all the other ones. These estimations are limited by the fact that using
data from European countries to represent non-European societies is not suited. Implementing
an agent-based model to deliver the contact rates is much more appropriate than estimating
mobility data from contact surveys. Based on this model, an epidemiological model can be
added and implemented on top of the mobility simulation. For instance, in the Berlin study
(Müller et al., 2020), the disease progression model is described by the division of the population
into six categories: namely Exposed, Infectious, Showing Symptoms, Seriously Sick, Critical
and Recovered. The probability for person n to become infected by this interaction in a time
step t is 13 (c.f Smieszek, 2009):
I
X
= 1 − exp −Θ · qm,t · cinm,t · inn,t · τnm,t ,
Pn,t (13)
m=1
where the parameters are I that is the total number of infectors (i.e. sum of all other persons);
h i
qm,t s−1 the shedding rate (microbial load) of infector m at simulation time step t;cinm,t the
contact intensity between the infector and the susceptible individual; in,t the intake (reduced
for example by a mask); τnm,t [s] the duration of interaction between the individuals n and m
during time stet t and Θ the calibration parameters that account for all relevant factors that are
not explicitly represented (for example the survival probability of the infectious agent).
Several other parameters can then be added to build a more detailed disease model being able to
add any number of interventions on the model timeline (e.g., physical isolation, testing, tracing,
and controlling the number of cases entering the area), see REINA model (Tuomisto et al., 2020).The Berlin study appears to be the most complete, as it implements a detailed agent-based model combined with an individual-based compartmental model for the dynamics of the virus simulated over the metropolitan area of Berlin. The study was conducted for determining changes in the reinfection rate depending on the interventions put in place, such as reduction in activity participation, wearing of masks, contact tracing, or quarantine-at-home. In "An agent-based epidemic model reina for covid-19" (Tuomisto et al., 2020) we can see that the contact intensities differ for each activity and location as well as per age group. Also, (see Lemaitre et al., 2020), we can observe the difference between each canton in Switzerland and each hospital’s proce- dures and protocols have been shown to cause differences between modeled and observed results. Mathematical models and computer simulations often assume a constant, generic transmission probability (c.f. Müller et al., 2020) while ignoring the fact that, for example, a short interaction between two people in a public bus is less likely to transmit the virus than an interaction that lasted several hours in a more enclosed space. Considering all contacts as having the same contact intensity may lead to a misrepresentation of the results and changing the predictions of the interventions. In T. Smieszek’s paper (Smieszek, 2009) there is evidence for the need of differentiating contact intensities and proposes an approach to differentiate the potential contagious contacts. It shows why the duration and the intensity of different contacts should be included in the epidemiological model. In the agent-based epidemic model REINA (Tuomisto et al., 2020), the agent has a list of individual properties as well as an age-specific probability distribution of the number of contacts per day. In real life, contacts are clustered for example by family relations, school, and work environments. The contact intensity differs for each location and each age group, so each set has a different contact pattern and therefore a particular probability of getting infected. In their paper, Tuomisto et al. (Tuomisto et al., 2020) consider the different probabilities of transitioning from each category of the SEIR epidemic model differentiated by age group. These probabilities are shown in Table 1 of (Tuomisto et al., 2020) paper. Another variable of interest is studied by Dattner et al. (Dattner et al., 2020). They show that children are less susceptible to infection than adults and that they display fewer symptoms than adults when infected with the SARS-CoV-2 virus. In summary, using epidemiological models to represent the spreading of an infectious disease is widely used. However, there is still a significant potential for contribution, especially implement- ing a methodology to consider the fitting variables and including them in the infection probability as explanatory variables that can be interpreted. This disaggregate level will allow us to assess
the choices of the population of their transportation mode, what socio-economic characteristics
incentives their trips, how can we plan the transportation of a city in a post-pandemic world,
etc.

3 Methodology

In this paper, we seek to extend a basic SIR model with its heterogeneity variation to develop
a realistic disease tool. We expect to understand disease dynamics in specific groups of the
population. In this Section we will present the characteristics of the dataset, the activity model
and the epidemiological model.

3.0.1 Context of the dataset

We will analyze surveillance data reported to the Federal Office of Public Health. FOPH is the
swiss goverment’s federal entity for public health. Their main activity is to develop national
health policy. However, they also represent Switzerland interests within international health
organizations (for example, OECD or the World Health Organization). We anticipate to have
access to their data.

3.1 Dataset

3.1.1 Variables and descriptive statistics

We expect to receive individual data that reads for each individual, its age, gender, home address
(to calculate the average income of the person), if it is infected and when it was tested positive,
the vaccine and when this vaccine was provided. Descriptions of the available variables are
reported in Table 1.

3.2 Notation

For each individual i we define the notation in Table 2:
Variable Description
Individual Id of the individual.
Age Age of the individual.
Gender Gender of the individual.
Home Coordinates of the individual home
Infected If the SARS-CoV-2 test was positive or not
Vaccinated If the individual was vaccinated
Vaccinationdate When was the individual vaccinated
Table 1: Description of respondent specific variables
Notation Description Variables
S Susceptible population.
I Infected population.
R The population who recovered from the disease and got immunity.
∆t The time-step of the simulation.
Xm Explanatory variables from the dataset.
H Total number of individuals in the population.
limet Number of individuals crossed by individual i.
Himet Number of total crossings between two individuals.
i Error term explanatory variables of βi .
µi Error term explanatory variables of γi .
αm Parameters of the explanatory variables.
θm Parameters of the explanatory variables.
βi Contagion rate between S and I.
1/γi Length of the infectious period for population I.
Table 2: Table of notation
3.3 Activity model: event file
In agent-based modeling (ABM), a system is modeled as a collection of autonomous decision-
making entities called agents. Each agent individually assesses their situation and makes
decisions based on a set of rules. Agents may execute various behaviors appropriate for the
system they represent. For example, producing, consuming, moving, and most importantly
interacting with other agents. Agent-based models work in a disaggregate way (probability
of infections are computed between individual agents), whereas compartmental models work
in an aggregate way. They can be described as extensions of compartmental modeling with a
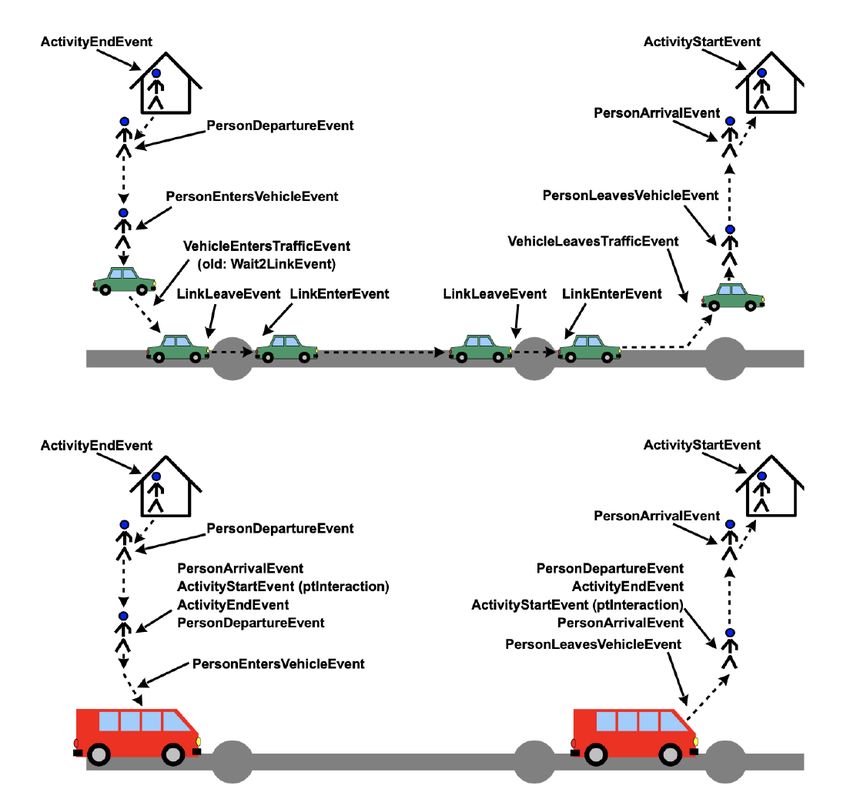
stochastic framework.Figure 2: MATSim events output for travel by individual vehicle (on top) and for travel by public
transport (at the bottom), (MATSim, 2021)
We use an activity model (MATSim, 2021) to produce the event files of each individual of our
simulation. Its agent-based modeling provides a fine-grained modular framework. As we can
see in Figure 2, we have the schedule of each individual for every day. This information is
completed by the definition of the different activities, such as the transportation mode, leisure,
home, errands and work. Also, another file defines the characteristics of the population which
are introduced in Equations 19 and 21 as the explanatory variables Xm . The input data is taken
from the Berlin OpenModel data which are mostly public.
Our goal is to study how the disease impacts the choice of activities. For that reason, we will
modify the utility scoring function from the activity-based model to introduce the epidemiolog-
ical penalty. (Charypar and Nagel, 2005) define the utility of a plan as Equation 14, and the
utility of an activity as Equation 15.
N−1
X N−1
X
S plan = S act ,q + S trav, mode (q) . (14)
q=0 q=0
S act,q = S dur,q + S wait ,q + S late.ar, q + S early.dp ,q + S short.dur ,q . (15)We will add in Equation 15 another term called S level of virus load to define the impact that an
epidemic has on the choice of activities, including travel mode. To estimate the parameters of
the model we are planning to use already-existing methodologies like maximum likelihood or
Bayesian methods.
We intend to keep working with the dataset provided by the OFSP. However, this dataset is
too limited for a few applications (for example, an activity where infection occurs, biological
characteristics of the virus, etc.). We will investigate other data sources. Also, we will validate
this disaggregate model at the aggregate level.
3.4 Epidemiological model overview
Individuals can move through each compartment of the model during the disease following
the distribution of the disease parameters. We characterize each disease by its state transition
parameters. These parameters differ from virus to virus. For instance, we observe that for SARS-
CoV-2, people are infected relatively early through the disease. In later stages, the infection
can become more severe but appears to be less contagious to other people. The contagion
rate controls the speed of spreading. We define it as the probability of contracting the disease
between a susceptible and an infectious individual. When susceptible and infectious individuals
meet, there is a certain probability that the susceptible person becomes infected and transitions
from one state to the other. During the simulation, every susceptible individual i, at time t, has a
probability, see Equation 16, of becoming infected.
I
ṖS →I (t) = 1 − exp(−βi dt) (16)
H
Once this person is infected it has a probability of being recovered, see Equation 17. We consider
that the individuals that are not recovered follow the distribution represented in Equation 18 to
death.
1
ṖI→R (t) = 1 − exp(− dt) (17)
γi
ṖNR→D (t) = 1 − exp(−λdt) (18)The β0i , Equation 19 is defined as the sum of the different factors that make an agent recover
(characteristics of the individual and virological attributes. Individual attributes can include age,
gender, income, etc. By virological attributes, we understand parameters like viral load, contact
intensity, ventilation characteristics, etc.
m
X
β0i = α m Xm + i (19)
j=1
lmet
βi = β0i (20)
Hmet
The 1/γi , Equation 21 is defined as the sum of the contagion risks coming from the different
sources of infections (characteristics of the individual and biological attributes).
m
X
γi = θm Xm + µi (21)
j=1
3.4.1 Vaccination
We introduce vaccination in our model by adding the effectiveness of the different vaccines
against SARS-CoV-2, (Roa, 2021).
Vaccine Effectiveness in %
NVX-CoV2373 96.0
Comirnaty 95.0
mRNA-1273 94.1
Sputnik V/Gam-Covid-Vac 91.6
BBIBP-CorV 79.0
AZD1222/Covishield 76.0
Ad26.COV2.S 72.0
Table 3: Effectiveness of vaccines against SARS-CoV-2, (Roa, 2021)
We generate random assignments of the vaccine following the different types of vaccines in each
canton and the total number of doses. In Switzerland, three of the vaccines exposed on Table 3
have been distributed: BioNTech/Pfizer, Moderna and Johnson & Johnson.Figure 3: High-level description of the models’ hierarchy
3.5 Simulation framework
3.5.1 MATSim-Episim
In (Müller et al., 2020) they use the term model to define two different entities. A model
(agent-based) that is a disaggregated algorithmic description of a phenomenon. It includes
a simulation, data-structures and is defined from the bottom-up. On the other side, a model
(SEIR) is an aggregated mathematical description of a phenomenon from a top-down approach.
Moreover, it defines two distinct agent-based models:
1. a mobility model describes the travel and activity behavior of the agent. The used
framework is MATSim.
2. an epidemiological model describes the propagation of a virus in a given population based
on a mobility model, a virus-transmission mathematical model and a compartmental
mathematical model. The used framework is MATSim-Episim.
In Figure 3 we can see a high-level description of this model. They are coupled by means of an
input-output relationship. In other words, MATSim’s output, the event file of the agents is used
as the Episim input, that models the infection spread of the agents.4 Conclusions and future work
The objective of this paper is to provide a literature review for transportation and urban planners
of epidemiological models. Also, a description of the preliminary considerations and presenta-
tion of the model. This model aims to predict the probability of the infection spreading process
for a given population. This probability will be later implemented in a fully functional activity-
based epidemiological model to assess the decision-making process in public transportation
planning during an epidemic. The outcome would be a tool to forecast daily mobility and disease
infection for given populations that share socioeconomic characteristics like age range or income.
Moreover, the activity-based approach will allow us to take into consideration how the epidemic
phenomenon affects mobility behaviors. As already aforementioned, we expect to observe a
reduced amount of trips using PT. The cause can be the subjective level of safety of public
transport and mental comfort of the users. We intent to analyze this effect in different groups of
the population that share socioeconomic attributes.
There are many potential contributions that align with this paper. We have identified several
gaps in the literature that we will try to address at a further stage:
1. There is no consensus on how to best represent the infectiousness of a disease in a given
population. Many assumptions try to explain how and why individuals get infected, some
being difficult to verify with currently available data.
2. Most existing research in epidemiological modeling focuses on an aggregated approach
to estimate the various parameters that define the spread of an infectious disease. It is
important to account for heterogeneity. We argue that diseases do not spread equally to
every individual and in every activity, but might have a more dynamic process that is
flexible towards feedback and trade-offs between each agent and its location.
3. Epidemiological models are a crucial element for public transportation planning and
activity-travel behavior, especially during or after a pandemic. However, there is a lack
of research focused on evaluating public transportation policies for a targeted group that
considers at the same time the disease spreading and the travel mode chosen.5 References (2016) Organization: Development Process, Code Structure and Contributing to MATSim, 289–296, Ubiquity Press, ISBN 9781909188754. Adler, T. and M. Ben-Akiva (1979a) A theoretical and empirical model of trip chaining behavior, 13, 243–257, 09 1979. Adler, T. and M. Ben-Akiva (1979b) A theoretical and empirical model of trip chaining behavior, Transportation Research Part B: Methodological, 13, 243–257, 09 1979. Albert, R. and A.-L. Barabasi (2001) Statistical mechanics of complex networks, Reviews of Modern Physics, 74, 06 2001. Aleta, A., D. MartÃn-Corral, M. Bakker, A. Piontti, M. Ajelli, M. Litvinova, M. Chinazzi, N. Dean, M. Halloran, I. Longini, A. Pentland, A. Vespignani, Y. Moreno and E. Moro (2020) Quantifying the importance and location of sars-cov-2 transmission events in large metropolitan areas, 12 2020. Anderson, R. and R. Mary (1992) Infectious diseases of humans : dynamics and control / roy m. anderson and robert m. may, SERBIULA (sistema Librum 2.0), 01 1992. Arentze, T. and H. Timmermans (2004) Albatross: A learning based transportation oriented simulation system, Transportation Research Part B: Methodological, 38, 613–633, 08 2004. Atti, M., S. Merler, C. Rizzo, M. Ajelli, M. Massari, P. Manfredi, C. Furlanello, G. Tomba and M. Iannelli (2008) Mitigation measures for pandemic influenza in italy: An individual based model considering different scenarios, PloS one, 3, e1790, 02 2008. Axhausen, K. and T. Gärling (1992) Activity-based approaches to travel analysis: Conceptual frameworks, models and research problems, Transport Reviews - TRANSP REV, 12, 323–341, 10 1992. Baker, S. R., R. A. Farrokhnia, S. Meyer, M. Pagel and C. Yannelis (2020) How does household spending respond to an epidemic? consumption during the 2020 covid-19 pandemic, The Review of Asset Pricing Studies, 10 (4) 834–862. Bansal, P., R. Kessels, R. Krueger and D. J. Graham (2021) Face masks, vaccination rates and low crowding drive the demand for the london underground during the covid-19 pandemic. Bonabeau, E. (2002) Agent-based modeling: Methods and techniques for simulating human systems, Proceedings of the National Academy of Sciences of the United States of America, 99 Suppl 3, 7280–7, 06 2002.
Bondy, J. and U. Murty (2008) Graph Theory, vol. 244, 01 2008, ISBN 978-1-84628-969-9.

Boots, M. and A. Sasaki (1999) ’small worlds’ and the evolution of virulence: Infection occurs
  locally and at a distance, Proceedings. Biological sciences / The Royal Society, 266, 1933–8,
 11 1999.

Bowman, J. and M. Ben-Akiva (2001) Activity-based disaggregate travel demand model system
  with activity schedules, Transportation Research Part A: Policy and Practice, 35, 1–28, 01
  2001.

Bradley, M. and J. Bowman (2004) Activity-based travel forecasting models in the united states:
  Progress since 1995 and prospects for the future, Progress in Activity-Based Analysis, 01
  2004.

Carpenter, C. and L. Sattenspiel (2009) The design and use of an agent-based model to simulate
  the 1918 influenza epidemic at norway house, manitoba, American journal of human biology :
  the official journal of the Human Biology Council, 21, 290–300, 05 2009.

Castiglione, J., M. Bradley and J. Gliebe (2014) Activity-based travel demand models: A primer.

Cauchemez, S., A.-J. Valleron, P.-Y. Boelle, A. Flahault and N. Ferguson (2008) Estimating the
  impact of school closure on influenza transmission from sentinel data, Nature, 452, 750–4, 05
  2008.

Chapin, F. (1976) Human activity patterns in the city. things people do in time and in space,
  Population (French Edition), 31, 507, 03 1976.

Charypar, D. and K. Nagel (2005) Generating complete all-day activity plans with genetic
  algorithms, Transportation, 32, 369–397, 07 2005.

Das, T., A. Savachkin and Y. Zhu (2007) A large-scale simulation model of pandemic influenza
  outbreaks for development of dynamic mitigation strategies, Iie Transactions, 40, 09 2007.

Dattner, I., Y. Goldberg, G. Katriel, R. Yaari, N. Gal, Y. Miron, A. Ziv, Y. Hamo and A. Huppert
  (2020) The role of children in the spread of covid-19: Using household data from bnei brak,
  israel, to estimate the relative susceptibility and infectivity of children, 06 2020.

De Vos, J. (2020) The effect of covid-19 and subsequent social distancing on travel behavior,
 Transportation Research Interdisciplinary Perspectives, 5, 100121.

Diekmann, O. and J. Heesterbeek (2000) Mathematical epidemiology of infectious diseases:
  Model building, analysis and interpretation, Wiley Series in Mathematical and Computational
  Biology, Chichester, Wiley, 01 2000.
Douglas, M., S. V. Katikireddi, M. Taulbut, M. McKee and G. McCartney (2020) Mitigating the
 wider health effects of covid-19 pandemic response, BMJ, 369.

Edmunds, W., G. Kafatos, J. Wallinga and J. Mossong (2006) Mixing patterns and the spread of
  close-contact infectious diseases, Emerging themes in epidemiology, 3, 10, 02 2006.

Edmunds, W., C. O’Callaghan and d. Nokes (1997) Who mixes with whom? a method to
  determine the contact patterns of adults that may lead to the spread of airborne infections,
  Proceedings. Biological sciences / The Royal Society, 264, 949–57, 08 1997.

Elston, D. S. (2013) A primer for agent-based simulation and modeling in transportation
  applications.

Eubank, S., H. Guclu, S. Kumar, M. Marathe, A. Srinivasan, Z. Toroczkai and N. Wang (2004a)
  Modeling disease outbreaks in realistic urban social networks, Nature, 429, 180–4, 06 2004.

Eubank, S., H. Guclu, S. Kumar, M. Marathe, A. Srinivasan, Z. Toroczkai and N. Wang (2004b)
  Modeling disease outbreaks in realistic urban social networks, Nature, 429, 180–4, 06 2004.

Ferguson, N., D. Cummings, S. Cauchemez, C. Fraser, S. Riley, A. Meeyai, S. Iamsirithaworn
  and S. Burke (2005) Strategies for containing an emerging influenza pandemic in southeast
  asia, Nature, 437, 209–14, 10 2005.

Ferguson, N., D. Cummings, C. Fraser, J. Cajka, P. Cooley and S. Burke (2006) Strategies for
  mitigating an influenza pandemic, Nature, 442, 448–52, 08 2006.

Gani, J. (2001) Daniel bernoulli,statisticians of the centuries.

Gerhold, L. (2020) Covid-19: risk perception and coping strategies.

Gilbert, E. N. (1959) Random graphs, The Annals of Mathematical Statistics, 30 (4) 1141–1144.

Golledge, R., M.-P. Kwan and T. Gärling (2005) Computational process modeling of household
  travel decisions using a geographical information system, Papers in Regional Science, 73, 99 –
 117, 01 2005.

Hackl, J. and T. Dubernet (2019) Epidemic spreading in urban areas using agent-based trans-
  portation models, Future Internet, 11, 92, 04 2019.

Heesterbeek, J. (2005) The law of mass-action in epidemiology: A historical perspective,
 Ecological Paradigms Lost, 01 2005.

Holland, J. (2006) Complex adaptive systems, Journal of Systems Science and Complexity, 19,
  03 2006.
Horni, A., K. Nagel and K. Axhausen (2016) The Multi-Agent Transport Simulation MATSim,
 04 2016.

Hägerstrand, T. (2005) Reflections on what about people in regional science, Papers in Regional
  Science - PAP REG SCI, 66, 1–6, 01 2005.

Johnson, S. (2001) Emergence - The Connected Lives of Ants, Brains, Cities and Software, 01
  2001.

Keeling, M., D. Rand and A. Morris (1997) Correlation models for childhood diseases, Proceed-
  ings. Biological sciences / The Royal Society, 264, 1149–56, 09 1997.

Kelman, A. (1985) Compartmental models and their application, International Journal of
  Bio-medical Computing - INT J BIO MED COMPUT, 16, 294–295, 05 1985.

Kermack, W. O. and A. Mckendrick (????) A contribution to the mathematical theory of
  epidemics, Proceedings of The Royal Society A: Mathematical, Physical and Engineering
  Sciences, 115, 700–721.

Kiss, I., J. Miller and P. Simon (2017) Mathematics of Epidemics on Networks, vol. 46, 01 2017,
  ISBN 978-3-319-50804-7.

Kitamura, R. (1988) An evaluation of activity-based travel analysis, Transportation, 15, 9–34,
  03 1988.

Lee, M. and M. You (2020) Psychological and behavioral responses in south korea during the
  early stages of coronavirus disease 2019 (covid-19), International Journal of Environmental
  Research and Public Health, 17 (9), ISSN 1660-4601.

Lemaitre, J., J. Perez-Saez, A. Azman, A. Rinaldo and J. Fellay (2020) Assessing the impact of
  non-pharmaceutical interventions on sars-cov-2 transmission in switzerland, Swiss Medical
  Weekly, 150, 05 2020.

Liljeros, F., J. Giesecke and P. Holme (2007) The contact network of inpatients in a regional
  healthcare system. a longitudinal case study, Mathematical Population Studies, 14, 269–284,
  11 2007.

Mancastroppa, M., R. Burioni, V. Colizza and A. Vezzani (2020) Active and inactive quarantine
 in epidemic spreading on adaptive activity-driven networks, Phys. Rev. E, 102, 020301, Aug
 2020.

Mandjes, M., N. Starreveld, R. Bekker and P. Spreij (2019) Dynamic Erdös-Rényi Graphs,
 123–140, 01 2019, ISBN 978-3-319-91907-2.

MATSim (2021) Matsim, https://matsim.org/about-matsim. (Accessed on 02/17/2021).
Matsuda, H. and K. Sato (1992) Statistical mechanics of population: The lattice lotka-volterra
 model, Progress of Theoretical Physics, 88, 0–1049, 12 1992.

MORRIS, M. (1993) Epidemiology and social networks:: Modeling structured diffusion, Socio-
 logical Methods and Research, 22, 99–126, 08 1993.

Müller, S., M. Balmer, B. Charlton, R. Ewert, A. Neumann, C. Rakow, T. Schlenther and
 K. Nagel (2020) Using mobile phone data for epidemiological simulations of lockdowns:
 government interventions, behavioral changes, and resulting changes of reinfections, 07 2020.

Nagel, K., R. Beckman and C. Barrett (2002) Transims for transportation planning, 12 2002.

Newman, M. (2002) Spread of epidemic disease on networks, Physical review. E, Statistical,
  nonlinear, and soft matter physics, 66, 016128, 08 2002.

Nicola, V. (2021) Lumping in Markov Reward Processes, 663–666, 06 2021, ISBN
  9781003210160.

Nurul Habib, K. (2011) A random utility maximization (rum) based dynamic activity scheduling
  model: Application in weekend activity scheduling, Transportation, 38, 123–151, 07 2011.

Nurul Habib, K. and E. Miller (2009) Modelling activity generation: A utility-based model for
  activity-agenda formation, Transportmetrica, 5, 3–23, 01 2009.

Pendyala, R., R. Kitamura, A. Kikuchi, T. Yamamoto and S. Fujii (2005) Florida activity
  mobility simulator: Overview and preliminary validation results, Transportation Research
  Record: Journal of the Transportation Research Board, 1921, 01 2005.

Pougala, B., Hillel (2020) Scheduling of daily activities: An optimization approach., (CONF).

Prem, K., A. Cook and M. Jit (2017) Projecting social contact matrices in 152 countries using
  contact surveys and demographic data, PLOS Computational Biology, 13, e1005697, 09 2017.

Qian, X. and S. V. Ukkusuri (2021) Connecting urban transportation systems with the spread
  of infectious diseases: A trans-seir modeling approach, Transportation Research Part B:
  Methodological, 145, 185–211, ISSN 0191-2615.

Quesada, M. (2007) Gilbert, nigel; troitzsch, klaus. simulation for the social scientist, Papers.
 Revista de sociologia; Num.: 80 Analytical Sociology Theory, 80, 01 2007.

Rand, D. (1999) Correlation equations and pair approximations for spatial ecologies, CWI
  quarterly, 12, 100–142.

Rasouli, S. and H. Timmermans (2013) Activity-based models of travel demand: Promises,
  progress and prospects, International Journal of Urban Sciences, 18, 31–60, 09 2013.
Recker, W., M. McNally and G. Root (1986) A model of complex travel behavior: Part 1
  theoretical development, Transportation Research Part A: General, 20, 307–318, 07 1986.

Renyi, E. (1959) On random graph, Publicationes Mathematicate, 6, 290–297.

Roa, M. M. (2021) Infografia:¿que tan eficaces son las vacunas con-
  tra la covid-19,   May 2021,     https://es.statista.com/grafico/23569/
  eficacia-estimada-de-los-candidatos-a-vacuna-en-la-prevencion-de-la-covid-19/.

Sandberg, I. (1978) On the mathematical foundations of compartmental analysis in biology,
  medicine, and ecology, Circuits and Systems, IEEE Transactions on, CAS-25, 273 – 279, 06
  1978.

Smieszek, T. (2009) A mechanistic model of infection: Why duration and intensity of contacts
  should be included in models of disease spread, Theoretical biology and medical modelling,
  6, 25, 11 2009.

Smith, L., R. Beckman and K. Baggerly (1995) Transims: Transportation analysis and simulation
  system, 07 1995.

Soper, H. (1929) The interpretation of periodicity in disease prevalence, J. R. Statist. Soc, A 92,
  34–73, 01 1929.

Tirachini, A. and O. Cats (2020) Covid-19 and public transportation: Current assessment,
  prospects, and research needs, Journal of Public Transportation, 22, 07 2020.

Tuomisto, J., J. Yrjölä, M. Kolehmainen, J. Bonsdorff, J. Pekkanen and T. Tikkanen (2020) An
  agent-based epidemic model reina for covid-19 to identify destructive policies, 04 2020.

W. H. Hamer, M. C., MA. (1906) The milroy lectures on epidemic disease in england and the
 evidence of variability and of persistency of type., The Lancet, 167 (4305) 569–574, ISSN
 0140-6736. Originally published as Volume 1, Issue 4305.

Wang, D. and H. Timmermans (2000) Conjoint-based model of activity engagement, timing,
 scheduling, and stop pattern formation, Transportation Research Record, 1718, 10–17, 01
 2000.

Wang, D., F. Zuo, J. Gao, B. He, Z. Bian, S. Duran Bernardes, C. na, J. Wang, K. Ozbay, J. Chow,
 S. Iyer, H. Nassif and X. J. Ban (2020a) White paper: Agent-based simulation model and
 deep learning techniques to evaluate and predict transportation trends around covid-19, 06
 2020.

Wang, D., F. Zuo, J. Gao, B. He, Z. Bian, S. Duran Bernardes, C. na, J. Wang, J. Petinos,
 K. Ozbay, J. Chow, S. Iyer, H. Nassif and X. J. Ban (2020b) Agent-based simulation model
You can also read