Activity dynamics of amygdala GABAergic neurons during cataplexy of narcolepsy - eLife
←
→
Page content transcription
If your browser does not render page correctly, please read the page content below
RESEARCH ARTICLE

                                      Activity dynamics of amygdala GABAergic
                                      neurons during cataplexy of narcolepsy
                                      Ying Sun, Carlos Blanco-Centurion, Emmaline Bendell, Aurelio Vidal-Ortiz,
                                      Siwei Luo, Meng Liu*

                                      Department of Psychiatry and Behavioral Sciences, Medical University of South
                                      Carolina, Charleston, United States

                                      Abstract Recent studies showed activation of the GABAergic neurons in the central nucleus of
                                      the amygdala (CeA) triggered cataplexy of sleep disorder narcolepsy. However, there is still no
                                      direct evidence on CeA GABAergic neurons’ real-time dynamic during cataplexy. We used a deep
                                      brain calcium imaging tool to image the intrinsic calcium transient as a marker of neuronal activity
                                      changes in the narcoleptic VGAT-Cre mice by expressing the calcium sensor GCaMP6 into
                                      genetically defined CeA GABAergic neurons. Two distinct GABAergic neuronal groups involved in
                                      cataplexy were identified: spontaneous cataplexy-ON and predator odor-induced cataplexy-ON
                                      neurons. Majority in the latter group were inactive during regular sleep/wake cycles but were
                                      specifically activated by predator odor and continued their intense activities into succeeding
                                      cataplexy bouts. Furthermore, we found that CeA GABAergic neurons became highly synchronized
                                      during predator odor-induced cataplexy. We suggest that the abnormal activation and
                                      synchronization of CeA GABAergic neurons may trigger emotion-induced cataplexy.
                                      DOI: https://doi.org/10.7554/eLife.48311.001

                                      Introduction
                                      Narcolepsy is a chronic sleep disorder characterized by excessive daytime sleepiness, cataplexy,
                                      sleep fragmentation, and hypnogogic/hypnopompic hallucinations. Cataplexy is cardinal among
*For correspondence:
                                      these symptoms and characterized by a sudden loss of skeletal muscle tone during waking.
liumen@musc.edu
                                            Even though it is known that the loss of the neuropeptide orexin (hypocretin, HCRT) system
Competing interests: The              causes narcolepsy with cataplexy (Lin et al., 1999; Nishino et al., 2000a), the entire brain circuitry
authors declare that no               responsible for the presentation of all narcoleptic symptoms is not fully understood. An important
competing interests exist.            clue to unraveling the brain circuit of narcolepsy comes from the fact that cataplexy is usually trig-
Funding: See page 16                  gered by strong emotions (Dauvilliers et al., 2014; Morawska et al., 2011). In fact, there is some
Received: 09 May 2019                 evidence pointing to the involvement of the amygdala as part of the narcolepsy circuit, whereas the
Accepted: 11 August 2019              exact circuitry involved and the specific abnormalities in the amygdala are still unknown. A single
Published: 14 August 2019             unit recording study done in narcoleptic dogs found that, during cataplexy, some amygdala neurons
                                      become activated (Gulyani et al., 2002). However, the intrinsic technical limitations of the single-
Reviewing editor: Yang Dan,
                                      unit recordings prevented the identification of the phenotypes of those neurons activated during
University of California, Berkeley,
United States
                                      cataplexy. To overcome this limitation, in the present study, we took advantage of molecular genetic
                                      tools to both tag and measure the in vivo activity of CeA GABAergic neurons from transgenic narco-
   Copyright Sun et al. This
                                      leptic mice. We first crossed vesicular GABA transporter Cre mice (Slc32a1-ires-Cre, or VGAT-Cre
article is distributed under the
                                      mice) with orexin KO mice (Hcrt -/-), to generate VGAT-Cre narcoleptic mice (Slc32a1-ires-Cre+/-/Hcrt
terms of the Creative Commons         -/-
                                          ). Later, we transfected CeA GABAergic neurons with genetically controlled calcium (Ca2+) sensor
Attribution License, which
permits unrestricted use and          GCaMP6, which could be imaged via a GRIN lens embedded in the amygdala and a miniature micro-
redistribution provided that the      scopic camera. Predator odor coyote urine was used to trigger emotion-induced cataplexy. We
original author and source are        monitored and calculated the intracellular Ca2+ transients because they are reliable readouts of the
credited.                             excitability level of neurons (Chen et al., 2018; Chen et al., 2013). We wanted to know what, in the

Sun et al. eLife 2019;8:e48311. DOI: https://doi.org/10.7554/eLife.48311                                                             1 of 18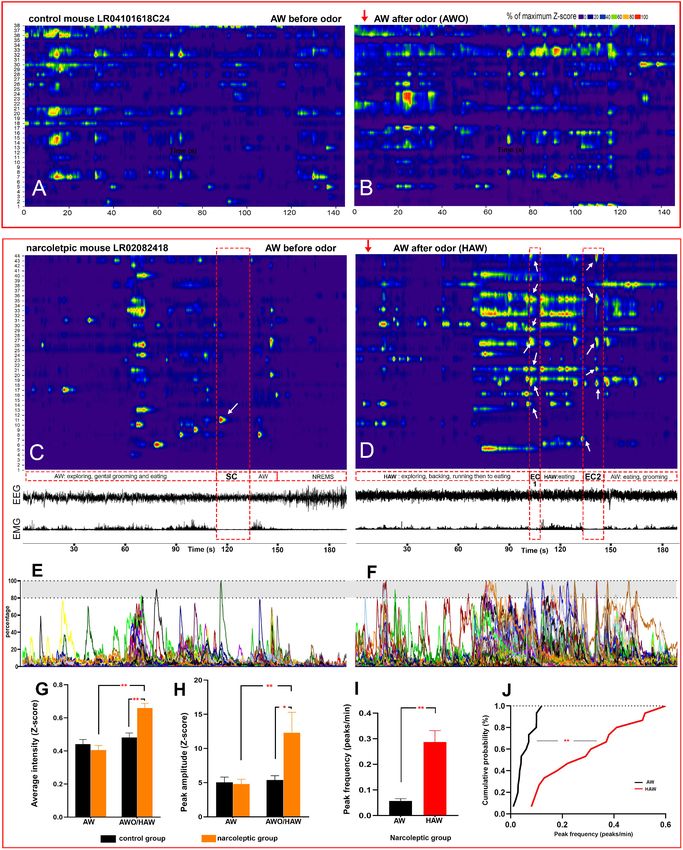
Research article Neuroscience
absence of orexin modulation, could be the abnormality in the CeA GABAergic neurons and how it
is associated with the timing of cataplexy.
Results
Orexin immunostaining
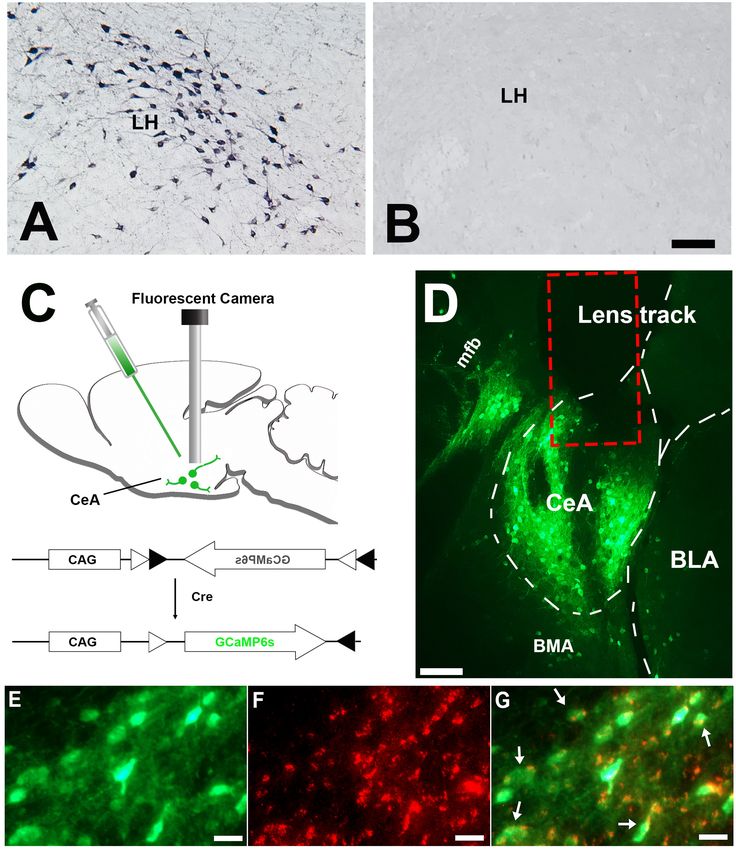
All mice from the control group (Slc32a1-ires-Cre+/-/Hcrt +/-) showed abundant orexin immunoreac-
tive neurons. In contrast, orexin immunoreactive neurons were completely absent in the group of
narcoleptic mice (Slc32a1-ires-Cre+/-/Hcrt -/-) (Figure 1, A and B). These results, together with the
genotyping results and signature cataplexy behaviors observed, validated the animal model of nar-
colepsy used in this study.
Anatomical distribution of GCaMP6 expression
Only mice showing correct vector and GRIN lens targeting were chosen for further data analysis.
This on-target group was made up of 5 narcoleptic mice and five control mice. In these mice,
GCaMP6s predominantly expressed within the CeA area (>80%), but some scattered expression was
also observed within the basolateral amygdala (BLA) and the basomedial amygdala (BMA)
(Figure 1D). VGAT immunostaining results showed that around 95% GCaMP6 expressing neurons in
CeA also contained VGAT in the cytoplasm (Figure 1, E-G, and Figure 1—source data 1).
Amygdala GABAergic neuronal activity during undisturbed recording
and predator odor exposure
Altogether, 186 GABAergic cells from five narcoleptic mice and 207 GABAergic cells from five con-
trol mice were imaged (Figure 2, Video 1, and Table 1 for numbers of recorded cells from each
mouse). GLMM analysis failed to detect a significant fixed (group) effect, that is narcoleptic vs. con-
trol (F (1, 2325)=0.0010, p=0.971). Yet it found a significant effect on the calcium fluorescent intensity
DF/F Z-scores (F (6, 2325)=318.02, p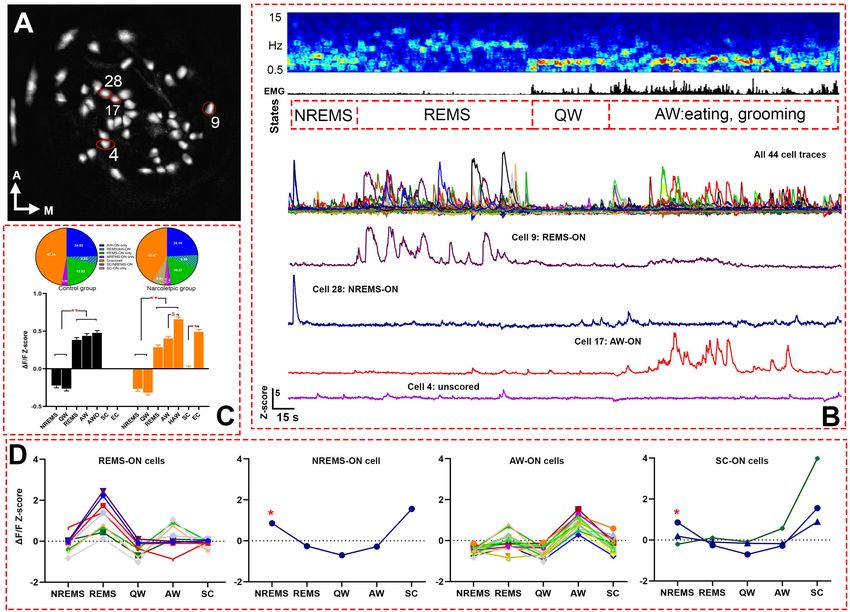
Research article                                                                                                         Neuroscience

Figure 1. Histology results. (A) Immunostaining demonstrating abundant orexin immunoreactive neurons and fibers in the LH of the control mice
(n = 8). (B) orexin immunoreactive somata and fibers were utterly absent in LH of the narcoleptic VGAT-Cre mice, n = 10). (C) Illustration of vector
injection and miniature camera installation. (D) Lens track and abundant GCaMP6 expression in CeA and adjacent areas. (E) GCaMP6 expression in
neuronal somata and axons in CeA. (F) cytoplasm VGAT immunoreactivities in the same area as E. (G) Co-localization of GCaMP6 and VGAT. About
95% GCaMP6 expressing neurons in CeA also contain VGAT immunoreactivities (arrows point to some of the double-labeled neurons). CeA: the central
Figure 1 continued on next page

Sun et al. eLife 2019;8:e48311. DOI: https://doi.org/10.7554/eLife.48311                                                                     3 of 18
Research article Neuroscience
Figure 1 continued
nucleus of the amygdala. BLA: basolateral amygdala. BMA: basomedial amygdala. LH: lateral hypothalamus. mfb: medial forebrain bundle. Scale bars
in A, D = 50 mm. Scale bar in E-G = 10 mm.
DOI: https://doi.org/10.7554/eLife.48311.002
The following source data is available for figure 1:
Source data 1. Cell counts of neurons expressing GCaMP6 and VGAT in the amygdala of one set of coronal sections from the narcoleptic mice used
for calcium data analysis (n = 5).
DOI: https://doi.org/10.7554/eLife.48311.003
defined cataplexy bouts preceded by such HAW episode as emotion-induced cataplexy (EC). Other-
wise, they were defined as spontaneous cataplexy (SC). In other words, EC bouts always came after
HAW episodes, whereas SC bouts were always preceded by an undisturbed AW episode. We
observed that many HAW-ON cells reached their maximal fluorescent intensity level upon odor
exposure and during the following EC bouts (Figure 4, D and F). In the total of 112 HAW-ON cells,
44.64% (50/112) were from those ‘unscored cells,’ and 35.71% (40/112) were from AW-ON cells. The
remainder consisted of portions of cells activated in other states, including REMS, NREMS, and SC
(Table 2).
Amygdala GABAergic neuronal activity during cataplexy
Altogether, we recorded 10 bouts of SC and 14 bouts of EC. Neither SC nor EC was observed in
mice of the control group. Ca2+ signal imaged during SC was significantly lower than that measured
during REMS and AW while Ca2+ signal during EC was at the level of undisturbed AW and markedly
higher than during SC (Figure 2C). Out of the 186 recorded cells, 15 (8.06% of 186) were scored as
SC-ON and 74 (39.78% of 186) were scored as EC-ON (Figure 3,A-C). Based on neuronal activity
during other sleep states, we found that SC-ON and EC-ON neurons are a distinct group of neurons,
and there was no overlap in between. Thus, among the 74 EC-ON neurons, 54.05% (40/74) came
from the ‘unscored cells,’ 22.97% (17/74) from AW-ON cells and 22.97% (17/74) were made up of
REMS-ON or REMS/AW-ON cells (Figure 3, Table 2). ‘Unscored cells’ presented relatively higher
Ca2+ activity during the HAW-EC transition episodes and the following cataplexy bouts, compared
to REMS-ON and AW-ON cells (Figure 3, D-F). Figure 4 demonstrated that many EC-ON neurons
reached their maximal activity level after coyote urine exposure and continued the maximal activity
level into following cataplexy bouts (Video 3 and Video 4: animal behavior during SC and EC bouts
in Figure 4, C and D). The actual calcium intensity DF/F Z-score changes were plotted in the Fig-
ure 4—figure supplement 1, to show the dramatic increase of Z-score upon odor exposure in the
narcoleptic mice.
To further characterize the hyperactivity of HAW episodes in the narcoleptic mice, we calculated
the amplitude and frequency of the prominent calcium transient peaks and found both parameters
were significantly increased after coyote urine exposure. The cumulative probability test indicated
that the peak frequency was dramatically shifted to a higher rate (Figure 4, H-J).
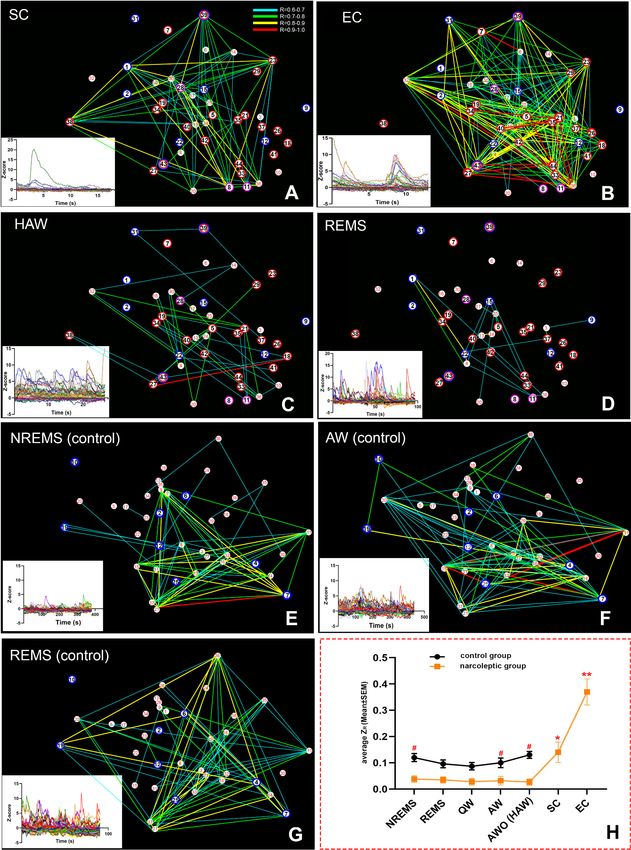
Amygdala GABAergic network activity patterns during cataplexy
To explore the GABAergic network activity patterns during sleep/wake states and cataplexy, we
examined the neuronal activity correlation (represented by the corrected Pearson correlation coeffi-
cient, ZR), then created a spatial connectivity map by combining the cell spatial references and Ca2+
fluorescent intensity (Z-scored DF/F) correlations among cells. In the control group, the average posi-
tive ZR values of recorded cells kept at a relatively stable level among various sleep/wake states
(0.10 ± 0.0068 at AW, 0.087 ± 0.0054 at QW, 0.12 ± 0.017 at NREMS, 0.096 ± 0.012 at REMS). Pred-
ator odor exposure produced only an insignificant increase in ZR (AWO: 0.13 ± 0.017). In contrast,
ZR values in the narcoleptic mice were much lower at normal sleep/wake states (0.032 ± 0.0037 at
AW, 0.028 ± 0.0028 at QW, 0.038 ± 0.0047 at NREMS, 0.035 ± 0.0033 at REMS, 0.027 ± 0.0019 at
HAW). Two-way ANOVA analysis found a significant difference in ZR between the control and narco-
leptic groups (F (1,64)=57.28, p=0.004).
During SC, ZR was brought up to 0.14 ± 0.014, which was already significantly higher than any
other sleep/wake states (p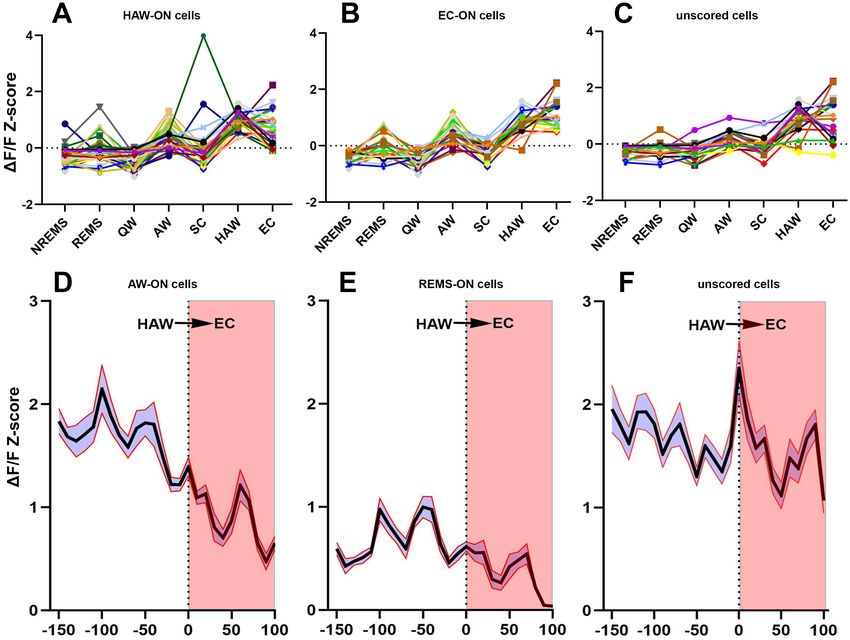
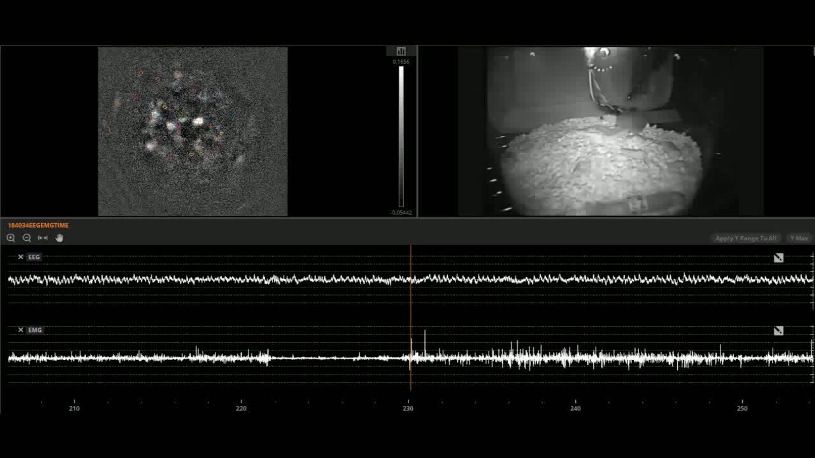
Research article                                                                                                               Neuroscience

Figure 2. Live Ca2+ activity recording and cell classification. (A) Map of 44 recorded cells from narcoleptic mouse LR02082418. (B) A serial figures
showing (top to bottom) EEG spectrogram, EMG, brain states, cell traces of a total of 44 cells, cell traces of four example cells outlined in A. (C) bar
graph (bottom) of Z-scores in each brain state and Bonferroni pairwise comparison results, and pie charts (top) of ON cell percentages in each brain
states. **: p
Research article                                                                                                  Neuroscience

                                                                                       induced cataplexy from amygdala GABAergic
                                                                                       neurons. The following are the five important
                                                                                       implications from this study.

                                                                                       CeA GABAergic neurons are more
                                                                                       active during REMS and AW
                                                                                          Past studies found the amygdala can modulate
                                                                                          sleep states. Early in 1975, researchers
                                                                                          (Smith and Miskiman, 1975) found that electrical
                                                                                          stimulation of the amygdala significantly
                                                                                          increased REMS. Likewise, electrophysiological
                                                                                          recordings showed that amygdala neurons
                                                                                          become very active during waking and REMS,
                                    Video 1. A sample of raw calcium movies played at 64x whereas displayed the lowest activity during
                                    speed.                                                NREMS (Corsi-Cabrera et al., 2016; Muñoz-
                                    DOI: https://doi.org/10.7554/eLife.48311.010          Torres et al., 2018). Our current study using in
                                                                                          vivo imaging of individual Ca2+ transients in
                                                                                          GABAergic neurons corroborates those electro-
                                                                                          physiological recordings.
                                       We found that in both control and narcoleptic mice, CeA GABAergic neurons showed their maxi-
                                    mal activities during AW and REMS. During these two states, these neurons displayed significantly
                                    higher Ca2+ transients and larger percentages of active neurons as compared to QW and NREMS
                                    (Figure 2). We also observed that neurons active during REMS are a distinct group of cells from
                                    those neurons that become active during AW. Less than 7% of all imaged neurons were equally
                                    active during both REMS and AW. The segregation in the activity profile during either state suggests
                                    there might be two distinct neural pathways activating specific groups of CeA GABAergic neurons.
                                    For instance, we observed that GABAergic AW-ON neurons became maximally active during eating.
                                    This observation is consistent with the hypothesis claiming that amygdala GABAergic neurons regu-
                                    late food consumption through a positive-valence circuit (Douglass et al., 2017). In contrast, REMS-
                                    ON GABAergic neurons might be part of the amygdala-related memory processing circuit
                                    (Genzel et al., 2015).
                                       We found that the average Ca2+ signal and the percentages of active neurons in each sleep/wake
                                    state were similar between the control and narcoleptic mice. The normal activity of CeA GABAergic
                                    neurons during sleep/wake states measured in the narcoleptic mice suggests these neurons function
                                    normally outside of conditions leading to emotionally-triggered cataplexy.
                                       On the other hand, we also found, in both groups, a particular group of CeA GABAergic neurons
                                    (unscored cells) with relatively low activity and insignificant activity changes during undisturbed
                                    sleep/wake states. In other words, it is unnecessary for all of the GABAergic neurons to be activated

                                    Table 1. Number of recorded cells in each mouse.
                                    Mouse ID                         Sex                    Group                         Numbers of cells
                                    LR00062218                       Male                   Narcoleptic                   27
                                    LR01062918                       Female                 Narcoleptic                   35
                                    LR02082418                       Male                   Narcoleptic                   44
                                    LR03091618                       Male                   Narcoleptic                   42
                                    LR08012219                       Female                 Narcoleptic                   38
                                    LR04101618                       Male                   Control                       38
                                    LR12011419                       Male                   Control                       28
                                    LR13022419                       Female                 Control                       63
                                    LR14022819                       Female                 Control                       35
                                    LR16031319                       Male                   Control                       43

                                    DOI: https://doi.org/10.7554/eLife.48311.008

Sun et al. eLife 2019;8:e48311. DOI: https://doi.org/10.7554/eLife.48311                                                            6 of 18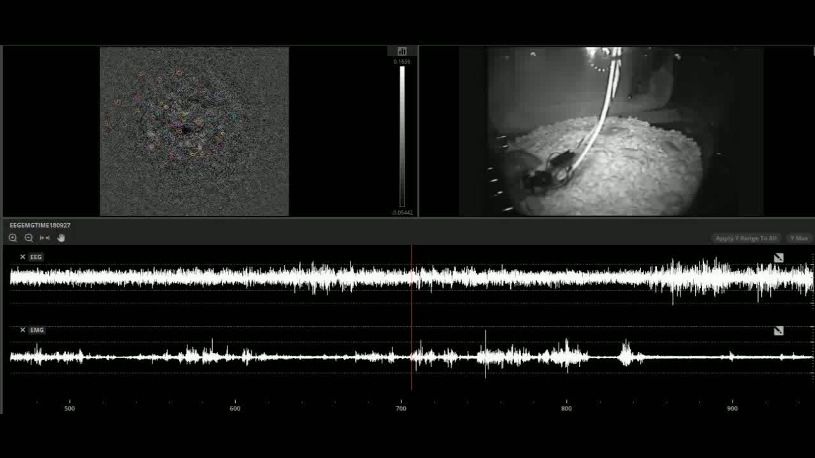
Research article                                                                                                          Neuroscience

Table 2. components of HAW-ON and EC-ON neurons in the narcoleptic group.
                                                                                   NREMS-ON
                   Unscored         AW-ON          REMS-ON REMS/AW-ON              SC-ON            EC-ON                      HAW-ON
HAW-ON (112)       50 (44.64%)      40 (35.71%)    13 (11.61%)                     8 (7.14%)        63 (56.25%)                ——————————
EC-ON (74)         40 (54.05%)      17 (22.97%)    17 (22.97%)                     0                ——————————                 63 (85.14%)

DOI: https://doi.org/10.7554/eLife.48311.009

Figure 3. Activities of sorted neurons during sleep/wake cycle and cataplexy. (A–C) Neuronal activity graphs of 28 HAW-ON cells, 19 EC-ON cells and
17 unscored cells in the narcoleptic mouse LR02082418. Most of the unscored cells displayed significantly elevated activities during HAW and EC (C).
(D–F) average Z-score changes during HAW–EC transition from 112 HAW-ON cells, 44 REMS-ON cells, and 79 unscored cells in the narcoleptic group.
The durations of cataplexy bouts were normalized as a percentage between 0–100. The average activity of HAW-ON cells stayed high upon odor
exposure but gradually decreased during the transition into EC (D). Compared to the low activity of REMS-ON cells (E), unscored cells displayed
stronger activation upon odor exposure and maintained the high activity level during EC (F).
DOI: https://doi.org/10.7554/eLife.48311.006
The following source data is available for figure 3:
Source data 1. Z-score data for transition map.
DOI: https://doi.org/10.7554/eLife.48311.007

Sun et al. eLife 2019;8:e48311. DOI: https://doi.org/10.7554/eLife.48311                                                                      7 of 18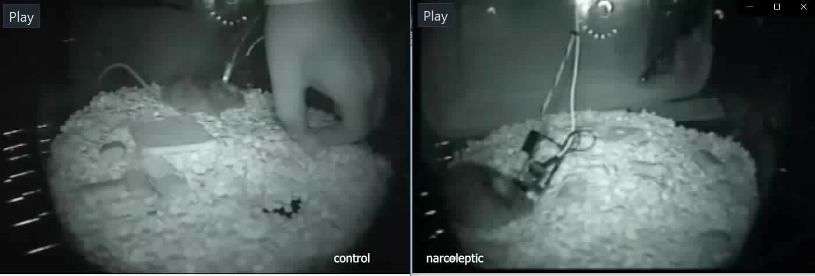
Research article                                                                                                  Neuroscience

                                                                                            during normal sleep/wake states, suggesting
                                                                                            there might be a modulating mechanism pre-
                                                                                            venting the amygdala from being overactive.
                                                                                            Indeed, this modulating mechanism might be
                                                                                            even stronger in wild type mice because expo-
                                                                                            sure to predator odor only awakened a small
                                                                                            portion of these ‘unscored cells’. In contrast,
                                    Video 2. Behaviors upon coyote urine exposure from a    among the narcoleptic group, the majority of
                                    control mouse (Left) and a narcoleptic mouse (right).   these ‘unscored cells’ became highly activated
                                    DOI: https://doi.org/10.7554/eLife.48311.014            upon odor exposure and actively participated in
                                                                                            the subsequent emotion-induced cataplexy. The
                                                                                            absence of orexin might be the main reason for
                                    the failure of this modulation.

                                    Narcoleptic mice CeA GABAergic neurons become hyperactive during
                                    predator odor exposure
                                    Although many studies have demonstrated the importance of the amygdala on narcolepsy and cata-
                                    plexy (Burgess et al., 2013; Liu et al., 2016; Mahoney et al., 2017; Snow et al., 2017), the precise
                                    causal role of the amygdala in narcolepsy is still unknown. Functional imaging studies on human nar-
                                    colepsy have given inconsistent results. Some studies observed reduced activity and volume within
                                    the amygdala while others found increased activity and unchanged volume (Brabec et al., 2011;
                                    Ponz et al., 2010; Vaudano et al., 2019; Wada et al., 2019). The discrepancy may arise from either
                                    the individual disease seriousness among different patients or the limitations of current functional
                                    imaging tools used clinically, which do not have the single-cell resolution or cannot measure directly
                                    neuronal activity. Our study has overcome both technical barriers, and because we used a genetic
                                    animal model of narcolepsy, we also had a consistent level of symptomatology. We are providing
                                    the very first direct evidence that CeA GABAergic neurons of narcoleptic mice become hyperactive
                                    upon presentation of an innate fearful stimulus. Control mice did not become hyperactive, whereas
                                    both narcoleptic and control mice showed avoidance and fear behaviors. CeA GABAergic hyperac-
                                    tivity found in the narcoleptic mice had both increased recruitment (percentage of AW-ON neuron
                                    doubled) and stronger facilitation (higher Ca2+ Z-scores, higher peak amplitude and frequency). In
                                    other words, aside from increasing activity intensity in regular AW-ON neurons, many additional neu-
                                    rons that were otherwise ‘unscored’ or active during REMS, became active in response to predator
                                    odor. ‘Unscored cells’ themselves made up 44.64% (50/112) of all activated neurons upon odor
                                    exposure (Table 2).
                                        In contrast, when orexin modulation is undisturbed, neither the percentage of AW-ON neurons
                                    nor their activity levels change significantly after exposure to the same predator odor. Activities of
                                    most ‘unscored cells’ did not change significantly. Because CeA GABAergic neurons did not display
                                    hyperactivity unless narcoleptic mice had exposure to predator odor, it strongly indicates that orexin
                                    plays a vital modulating role during strong emotional states. When orexin is missing, the functional
                                                                                          compensation effects from other neuropathways
                                                                                          might prevent amygdala GABAergic neurons
                                                                                          from behaving over actively until emotion stimuli
                                                                                          come in.
                                                                                             Prior evidence indicated that orexin inhibits
                                                                                          amygdala neurons by exciting serotoninergic ter-
                                                                                          minals within the CeA to block cataplexy
                                                                                          (Hasegawa et al., 2017). In this way, serotonin
                                                                                          keeps GABAergic neuronal activity in check.
                                                                                          Orexin can also excite inhibitory interneurons in
                                                                                          the     CeA     (Dustrude     et    al.,   2018;
                                                                                          Hasegawa et al., 2017). GABAergic hyperactivity
                                                                                          once triggered, could successively send over-
                                    Video 3. Demonstrating the spontaneous cataplexy      whelming inhibitory inputs into the brainstem
                                    (SC) bout in Figure 4C, 8x speed.                     and cortex. Particularly, when GABAergic inhibi-
                                    DOI: https://doi.org/10.7554/eLife.48311.015          tion occurs in motoneurons, muscle weakness, or

Sun et al. eLife 2019;8:e48311. DOI: https://doi.org/10.7554/eLife.48311                                                             8 of 18
Research article Neuroscience Figure 4. Hyperactivity of amygdala GABAergic neurons before and during emotion-induced cataplexy. (A–D), heat maps of Ca2+ fluorescent intensity changes before and after coyote urine exposure (red arrows show the starting time of exposure) in control mouse LR04101618. (A and B) and narcoleptic mouse LR02082418 (C, D). The control mouse displayed moderate increases on activity (B) upon exposure to coyote urine. In contrast, the narcoleptic mouse showed dramatic activity changes, with significantly more neurons reaching their maximal activities during the first 3 min of exposure Figure 4 continued on next page Sun et al. eLife 2019;8:e48311. DOI: https://doi.org/10.7554/eLife.48311 9 of 18
Research article                                                                                                            Neuroscience

Figure 4 continued
(D and F). A spontaneous cataplexy bout (SC) following a regular AW episode and an SC-ON cell (arrow in C) are shown in (C). Two emotion-induced
cataplexy episodes (EC1 and EC2) closely following hyperactive AW (HAW) bouts induced by coyote urine are shown in (D), in which many EC-ON cells
reached their maximal activities (arrows). (E, F): Graphs of the percentage to its maximal activity Z-score of each cell in (C) and (D), respectively.
Prominent calcium transient peaks (examples are shown in the shadow areas of E and F) were selected for statistical analysis. Odor exposure
significantly increased the average calcium signal intensity (G), peak amplitude (H), and peak frequency (I) in the narcoleptic group (*: p
Research article                                                                                                             Neuroscience

Figure 5. Spatial connectivity maps and graphs. Colored lines represent a strong positive correlation R value between 0.6 (blue) to 1.0 (red). (A–D):
correlation maps of an SC (A), EC (B), HAW (C) and REMS (D) bout from narcoleptic mouse LR02082418. (E–G): correlation maps of an NREMS (E), AW
(before odor exposure, (F) and REMS (G) bout from control mouse LR04101618. Ca2+ signal intensity (DF/F Z-score) plots of corresponding brain states
were placed on the bottom left of each panel. There were discernible dissociations between intensity (Z-score) and correlations R values. For instance,
Figure 5 continued on next page

Sun et al. eLife 2019;8:e48311. DOI: https://doi.org/10.7554/eLife.48311                                                                        11 of 18
Research article                                                                                                              Neuroscience

Figure 5 continued
HAW bout in (C) had the highest Z-scores while had the least correlation lines, leaving many cells unconnected. (H): the summary of the average ZR
(corrected R) trends of both groups during various brain states. Overall, narcoleptic mice had significantly lower ZR than the control group mice during
undisturbed sleep/wake states. However, this low ZR status was abruptly reversed during cataplexy. ZR during SC was back to wild type level while ZR
during EC went far higher than the wild type level. #: p
Research article                                                                                                Neuroscience

                                    cataplexy duration is still unclear. We found that the difference in cataplexy duration between SC
                                    (n = 10) and EC (n = 14) has no statistical significance, though the SC duration seems longer than EC
                                    (Figure 6). Further studies are needed to understand the amygdala role in cataplexy maintaining.

                                    Technical considerations
                                    The deep brain calcium imaging tool provides useful neural network information, but it does not
                                    come without any limitations. The weight of the miniature camera hindered the locomotion of small
                                    animals like mice, causing relatively fewer cataplexy attacks in our study when compared to other
                                    studies using group-housed mice with wheel running apparatus. The calcium sensor GCaMP6 itself
                                    could impose impairment on neurons by affecting L-type calcium channels of neurons (Yang et al.,
                                    2018). Improvement on light-weight camera, wireless recording, and developing harmless calcium
                                    sensors like GaMP-X (Yang et al., 2018) will make the deep-brain calcium imaging a much useful
                                    tool for behavioral studies.

                                    Conclusions
                                    Cataplexy-ON neurons in amygdala were first identified in the dog (Gulyani et al., 2002). Now we
                                    have discovered them in narcoleptic mice and determined that the majority of these neurons are
                                    maximally activated right before and during emotion-induced cataplexy. Both the hyperactivity and
                                    hyper synchronization of CeA GABAergic neurons might contribute to emotion-induced cataplexy.

                                    Materials and methods
Key resources table
Reagent type                                                                                                          Additional
(species) or resource           Designation                    Source or reference         Identifiers                information
Genetic reagent                 VGAT-Cre                       The Jackson laboratory      RRID: MGI:5141285          PMID:21745644
(M. musculus)
Genetic reagent                 Orexin KO                      PMID:10481909               RRID: IMSR_KOMP:           Dr. Masashi
(M. musculus)                                                                              VG11744-1.1-Vlcg           Yanagisawa
                                                                                                                      (University of Texas)
Recombinant                     AAV.Syn.Flex.G                 http://www.add              RRID:                      PMID:23868258
DNA reagent                     CaMP6s.WPRE.SV40               gene.org/100845/            Addgene_100845             Originally purchased
                                                                                                                      from university of
                                                                                                                      Pennsylvania gene
                                                                                                                      therapy core
Antibody                        anti-VGAT                      Synaptic System             Cat# 131011,               PMID:17444497
                                (Mouse monoclonal)                                         RRID:AB_887872             (1:500)
Antibody                        anti-Orexin                    Santa Cruz                  Cat#: SC-8070,             PMID:16100511
                                (Goat polyclonal)              Biotechnology               RRID:AB_653610             (1:5000)
Software,                       SPSS                           IBM                         RRID:SCR_002865
algorithm
Software,                       Matlab                         MathWorks                   RRID:SCR_001622
algorithm

                                    Animals and surgery
                                    All manipulations done to the mice followed the policies established in the National Institutes of
                                    Health Guide for the Care and Use of Laboratory Animals and were approved by the Medical Univer-
                                    sity of South Carolina Institutional Animal Care and Use Committee (protocol # IACUC-2019–00723).
                                        To specifically target GABAergic neurons in narcoleptic mice, orexin KO mice (Hcrt -/-) mice
                                    (derived from founders donated by Dr. Yanagisawa, Southwestern Medical Center, Dallas, TX) were
                                    crossed with VGAT-Cre Knock-In mice (Slc32a1-ires-Cre+/+, www.jax.org, stock #016962, Bar Harbor,
                                    ME). Offspring with the confirmed genotype Slc32a1-ires-Cre+/-/Hcrt -/- were used as the narcoleptic
                                    group (n = 10, both sexes, 6–10 months of age) while littermates with the confirmed genotype
                                    Slc32a1-ires-Cre+/-/Hcrt ±were selected as the control group (n = 8, both sexes, 6–10 months of
                                    age). Genotype validation on mice tail snips was done off-site by Transnetyx (Cordova, TN). The
                                    temperature in the mice housing/recording room was always maintained at 23–25˚C under a 12 hr

Sun et al. eLife 2019;8:e48311. DOI: https://doi.org/10.7554/eLife.48311                                                            13 of 18
Research article Neuroscience
light/dark cycle (lights on at 6:00 A.M.). Mice were given ad libitum access to regular laboratory
food and water.
Under deep anesthesia (isoflurane 1.0–2.0%) and using a stereotaxic frame (Kopf, Tujunga, CA),
AAV vectors with Cre inducible expression of GCaMP6 slow (AAV5-CAG-DIO-GCaMP6s, Titer: 3.48
1013 genomic copies/ml; University of Pennsylvania Preclinical Vector Core) were microinjected
unilaterally into the CeA at the following coordinates: 1.11 mm posterior to Bregma, 2.95 mm lateral
to the sagittal suture, and 4.30 mm ventral to the brain surface (Liu et al., 2011). Viral vectors were
delivered in a volume of 500 nl using a 10.0 mL Hamilton syringe coupled to a 33-gauge stainless
steel injector (Plastics One, Roanoke, VA). Injections were done gradually over 15 min. After microin-
jection, the injector needle was left in place for 15 min and then withdrawn slowly. At this time, and
following the same injection track, a miniature Gradient Refractory INdex lens (GRIN, O.D. diameter:
0.6 mm, length: 7.3 mm; Inscopix Inc, Palo Alto, CA) was driven into the brain just above the CeA
and cemented to the skull. Then, and as described elsewhere (Liu et al., 2011), four small screw-
type electrodes and a pair of plate-type electrodes (Plastics One, CA) were implanted onto the
mouse skull and nuchal muscles for recording the electroencephalogram (EEG) and electromyogram
(EMG) activity respectively (Figure 1). Ten days after GRIN lens placement, mice were deeply anes-
thetized again (1.0–2.0% isofluorane). A baseplate was attached to a single photon miniaturized fluo-
rescence microscope/CCD camera (nVoke from Inscopix, Inc, CA). The miniaturized microscope,
along with the baseplate, were carefully placed atop the GRIN lens. The distance between the minia-
turized microscope and the GRIN lens top was precisely adjusted until fluorescent neurons came
into focus. At this focal point, the baseplate was secured around the GRIN lens cuff with dental
cement, and then the microscope was detached. To protect the GRIN lens from debris and
scratches, a cap was secured onto the baseplate. One week later mice were habituated to the
recording experiment setting for three consecutive days before the sleep and Ca2+ recording
started.
Sleep recording and identification of sleep states or cataplexy
After being amplified and filtered (0.3–100 Hz for EEG; 100–1 K Hz for EMG, MP150 system; Biopac
Systems Inc, CA), the EEG/EMG signals were acquired and synchronized to the imaging of the Ca2+
transients. In parallel, a night-vision camera was used to record mouse behavior. Streaming video of
the mouse behavior was also synchronized with imaging of the Ca2+ transients (Neuroscience Studio
acquisition software, Doric Lenses Inc, QC, Canada). A MATLAB (Mathworks Inc, Natick, MA, USA)
script was used to plot the spectrogram of the EEG activity (1 s window size and 0.5 s overlap).
EEG/EMG data (as CSV files) along with synchronized behavior video files were then transferred
into SleepSign software (KISSEI Comtec Ltd., Nagano, Japan) and scored in 4 s epochs as wakeful-
ness, non-rapid eye movement sleep (NREMS), REMS, and cataplexy. Wakefulness was identified by
the presence of desynchronized EEG coupled with high amplitude EMG activity and further divided
into quiet wakefulness (QW) or active wakefulness (AW) depending on whether the mouse displayed
behaviors such as walking, rearing, grooming, eating, drinking, digging (AW), or was just standing
still but awake (QW). Thus, during QW, the mouse kept an immobile posture often interspersed with
movements of the head (e.g., bobbing) but did not exhibit any further purposeful movement. QW
often occurred in between, in anticipation of, or following sleep states and lasted from a few sec-
onds to several minutes. NREMS was scored when the EEG showed high-amplitude/low-frequency
waves (delta waves) together with a lower EMG activity relative to waking. REMS was identified by
the presence of regular EEG theta activity coupled with very low EMG activity.
To be qualified as a cataplexy attack, an episode had to meet the following criteria: 1) An abrupt
episode of nuchal atonia lasting at least 8 s. 2) Immobility during the episode. 3) Theta activity domi-
nant EEG during the episode. 4) At least 40 s of wakefulness preceding the episode (discrete cata-
plexy) or the first episode when several cataplexy episodes occur sequentially. The above criteria
were slightly modified from the International Working Group on Rodent Models of Narcolepsy
(Scammell et al., 2009).
Miniature microscopy Ca2+ transients imaging
At 10:00 AM, the mouse was gently restrained (swaddled in Terrycloth), while the miniature fluores-
cent microscope/camera was attached to its baseplate. At the same time, a lightweight cable was
Sun et al. eLife 2019;8:e48311. DOI: https://doi.org/10.7554/eLife.48311 14 of 18Research article Neuroscience
plugged to record the EEG/EMG signals. The tethered mouse was then returned to the home cage
and allowed to adapt for 6 hr for three consecutive days. On the fourth day (recording day), the
same adaptation routine was followed, but at 4:00 PM, Ca2+ transients-derived fluorescence began
to be imaged by the nVoke miniaturized microscope/CCD camera (Inscopix, CA) and collected by its
acquisition software. Ca2+ associated fluorescence was continuously generated by a blue LED
(power: 0.2 mW) and imaged at 10 frames per second (fps). To synchronize the timestamps of Ca2+
imaging with the EEG/EMG, a TTL signal was sent from the nVoke interface console into the Doric
console. Mouse was exposed to the predator odor coyote urine between 7:00 PM - 8:00 PM. Briefly,
1.0 ml coyote urine (www.predatorpee.com, Bangor, ME), stored in a 5 ml plastic vial filled with cot-
ton, was placed in the home cage at 7:00 PM for 1 hr (Liu et al., 2016).
Analysis of Ca2+ transients imaging data
The person analyzing data was blind to the mice’s genetic background, which has not been decoded
until all analyses finished. Ca2+ transient data were processed off-line by the Inscopix data process-
ing software (version 1.1.2). Briefly, raw movies were first pre-processed to correct for defective pixi-
lation, row noise and dropped frames. Preprocessed movies were then corrected for motion
artifacts to generate the steadiest Ca2+ fluorescent signals. The motion-corrected movies were sub-
sequently mean filtered. To normalize the Ca2+ signals, a single frame average projection of the fil-
tered movie was generated. The average frame was used as the background fluorescence (F0) to
calculate the instantaneous normalized Ca2+ fluorescent signals (DF/F) according to the formula; (DF/
F)i=Fi-F0/F0 where i represents each movie frame. The normalized movie or ‘DF/F movie’ was then
used for semiautomatic extraction of Ca2+ fluorescent signals associated with individual cell based
on the principal and independent component analysis (PCA-ICA). Regions of interest (ROIs) identi-
fied by PCA-ICA were visually selected as candidate cells based on DF/F and image (cell-morphol-
ogy). To be chosen as bona-fide neurons, Ca2+ traces had to fulfill the canonic Ca2+ spike waveform
featuring fast-rising onset followed by slower decaying signal. Ca2+ trace (DF/F) of each ROI (cell)
was further standardized as Z-score using the mean and standard deviation (SD) of each cell’s DF/F
(Z-score = (DF/F-Mean)/SD). Since the lowest Z-score values were observed during QW, and no cell
reached its maximal activity during QW, we used the average Z-score of QW (Z-QW) as the baseline.
If a cell has an average Z-score during a specific state equal to or greater than (Z-QW +1), it is scored
as an ‘ON’ cell in that state. After cells were completely scored, we ran the ANOVA with Bonferroni
post-hoc test to confirm that the average Z-score of these ‘ON’ cells were statistically higher than
that of those ‘non-ON’ cells. In the meantime, DF/F Z-scores expressed as the percent of its maximal
Z-score value across the whole recordings were plotted on a heat map (Sigmaplot software, Systat
Software Inc, San Jose, CA). We then used the percentage threshold, which was defined as 80% of
the maximum Z-score value during the whole recording period, to detect the prominent neuronal
peak events, and set 2 s as the minimum interval between two adjacent peaks. The cumulative prob-
abilities of peak frequency were compared between AW and AWO in the narcoleptic group with
Kolmogorov-Smirnov test.
Synchronicity and cross-correlations analysis of amygdala GABAergic
neurons
First, the Z-score data were processed with Pearson correlation analysis (two tails) with Prism eight
software (GraphPad Software, San Diego, CA), to obtain the pairwise correlation coefficient R
between every two cells. Coefficient R is the index for correlation ranging from 1 to 1 (0 represents
no correlation, 1.0 represents a negative correlation. 1.0 represents a perfect correlation). Next,
we transferred the R to ZR based on the Fisher’s Z transformation formula (ZR = 0.5[ln(1 + R) – ln(1
R)]) so that the ZR became normally distributed. The average ZR of all positive correlations (R > 0) in
each cell was calculated for statistical comparisons among groups and states. Finally, to show the
correlation results intuitively, we generated the 2D spatial maps of all recorded cells and linked every
two cells with color-coded lines representing the R values (strong positive correlations with R
between 0.6–1.0).
Sun et al. eLife 2019;8:e48311. DOI: https://doi.org/10.7554/eLife.48311 15 of 18Research article Neuroscience
Histology
At the end of the study, the mice were anesthetized with isoflurane (5%) and perfused transcardially
with 0.9% saline (5–10 ml) followed by 10% buffered formalin in 0.1M PBS (50 ml). Mice brains were
harvested and cross-sectioned at 40 mm thickness (four sets) on a compresstome (Precisionary Instru-
ments, Greenville, NC). To visualize the GRIN lens track and the location of the GCaMP6s transgene
expression, coronal sections were scanned on a Leica fluorescent microscope. Mice that had a main
GCaMP6s expression area outside of the amygdala were excluded from further analysis. To verify
that GCaMP6 was expressed exclusively in GABAergic neurons, VGAT immunostaining was per-
formed on one set of brain sections. Briefly, sections were incubated at room temperature for 24 hr
with mouse anti-VGAT monoclonal antibody (1:500 dilutions, Synaptic System, Germany), followed
by 1 hr incubation with Alexa fluor-568 donkey anti-mouse IgG (1:500, Invitrogen, CA). GCaMP6 and
VGAT positive cells were counted on digitized images using MCID image analysis software (St.
Catharines, ON, Canada). To confirm the correctness of the genotyping, orexin immunostaining was
made on a separate set of brain sections. Briefly, sections were incubated at room temperature for
24 hr with goat anti-orexin polyclonal antibody (1:5000 dilutions, Santa Cruz Biotechnology, CA), fol-
lowed by 1 hr incubation with biotinylated donkey anti-goat IgG (1:500, Millipore, Burlington, MA)
secondary antibody and finally labeled using ABC–DAB–nickel staining (Vector Laboratories, Burlin-
game, CA).
Statistical analysis
Generalized linear mixed model (GLMM) analysis (SPSS, version 25) with unconstructed covariance
and Sequential Bonferroni post-hoc tests were used to compare the means of Z-score among each
sleep/wake state inside or between two animal groups. One-way or two-way ANOVA and Bonferroni
post-hoc test was used to compare the ZR values, cataplexy duration, peak amplitude and fre-
quency. Statistical significance was evaluated at the pResearch article Neuroscience
Ethics
Animal experimentation: All manipulations done to the mice followed the policies established in the
National Institutes of Health Guide for the Care and Use of Laboratory Animals and were approved
by the Medical University of South Carolina Institutional Animal Care and Use Committee (protocol
# IACUC-2019-00723). All surgery was performed under isoflurane inhalation, and every effort was
made to minimize suffering.
Decision letter and Author response
Decision letter https://doi.org/10.7554/eLife.48311.023
Author response https://doi.org/10.7554/eLife.48311.024
Additional files
Supplementary files
. Transparent reporting form
DOI: https://doi.org/10.7554/eLife.48311.021
Data availability
All data generated or analysed during this study are included in the manuscript and supporting files.
References
Brabec J, Rulseh A, Horinek D, Pala A, Guerreiro H, Buskova J, Petrovicky P, Nemcova V, Krasensky J, Seidl Z,
Nimsky C, Sonka K. 2011. Volume of the amygdala is reduced in patients with narcolepsy - a structural MRI
study. Neuro Endocrinology Letters 32:652–656. PMID: 22167152
Burgess CR, Oishi Y, Mochizuki T, Peever JH, Scammell TE. 2013. Amygdala lesions reduce cataplexy in orexin
knock-out mice. Journal of Neuroscience 33:9734–9742. DOI: https://doi.org/10.1523/JNEUROSCI.5632-12.
2013, PMID: 23739970
Chen TW, Wardill TJ, Sun Y, Pulver SR, Renninger SL, Baohan A, Schreiter ER, Kerr RA, Orger MB, Jayaraman V,
Looger LL, Svoboda K, Kim DS. 2013. Ultrasensitive fluorescent proteins for imaging neuronal activity. Nature
499:295–300. DOI: https://doi.org/10.1038/nature12354, PMID: 23868258
Chen K-S, Xu M, Zhang Z, Chang W-C, Gaj T, Schaffer DV, Dan Y. 2018. A hypothalamic switch for REM and
Non-REM sleep. Neuron 97:1168–1176. DOI: https://doi.org/10.1016/j.neuron.2018.02.005
Corsi-Cabrera M, Velasco F, Del Rı́o-Portilla Y, Armony JL, Trejo-Martı́nez D, Guevara MA, Velasco AL. 2016.
Human amygdala activation during rapid eye movements of rapid eye movement sleep: an intracranial study.
Journal of Sleep Research 25:576–582. DOI: https://doi.org/10.1111/jsr.12415, PMID: 27146713
Dauvilliers Y, Siegel JM, Lopez R, Torontali ZA, Peever JH. 2014. Cataplexy–clinical aspects, pathophysiology
and management strategy. Nature Reviews Neurology 10:386–395. DOI: https://doi.org/10.1038/nrneurol.
2014.97, PMID: 24890646
Douglass AM, Kucukdereli H, Ponserre M, Markovic M, Gründemann J, Strobel C, Alcala Morales PL,
Conzelmann K-K, Lüthi A, Klein R. 2017. Central amygdala circuits modulate food consumption through a
positive-valence mechanism. Nature Neuroscience 20:1384–1394. DOI: https://doi.org/10.1038/nn.4623
Dustrude ET, Caliman IF, Bernabe CS, Fitz SD, Grafe LA, Bhatnagar S, Bonaventure P, Johnson PL, Molosh AI,
Shekhar A. 2018. Orexin depolarizes central amygdala neurons via orexin receptor 1, phospholipase C and
Sodium-Calcium exchanger and modulates conditioned fear. Frontiers in Neuroscience 12:934. DOI: https://
doi.org/10.3389/fnins.2018.00934
Genzel L, Spoormaker VI, Konrad BN, Dresler M. 2015. The role of rapid eye movement sleep for amygdala-
related memory processing. Neurobiology of Learning and Memory 122:110–121. DOI: https://doi.org/10.
1016/j.nlm.2015.01.008, PMID: 25638277
Gulyani S, Wu MF, Nienhuis R, John J, Siegel JM. 2002. Cataplexy-related neurons in the amygdala of the
narcoleptic dog. Neuroscience 112:355–365. DOI: https://doi.org/10.1016/S0306-4522(02)00089-1,
PMID: 12044453
Hasegawa E, Maejima T, Yoshida T, Masseck OA, Herlitze S, Yoshioka M, Sakurai T, Mieda M. 2017. Serotonin
neurons in the dorsal raphe mediate the anticataplectic action of orexin neurons by reducing amygdala activity.
PNAS 114:E3526–E3535. DOI: https://doi.org/10.1073/pnas.1614552114, PMID: 28396432
Kirk RE. 1968. Experimental Design: Procedures for the Behavioral Sciences. Belmont, CA: Brooks/Cole.
Lin L, Faraco J, Li R, Kadotani H, Rogers W, Lin X, Qiu X, de Jong PJ, Nishino S, Mignot E. 1999. The sleep
disorder canine narcolepsy is caused by a mutation in the hypocretin (orexin) receptor 2 gene. Cell 98:365–376.
DOI: https://doi.org/10.1016/S0092-8674(00)81965-0, PMID: 10458611
Liu M, Blanco-Centurion C, Konadhode R, Begum S, Pelluru D, Gerashchenko D, Sakurai T, Yanagisawa M, van
den Pol AN, Shiromani PJ. 2011. Orexin gene transfer into zona incerta neurons suppresses muscle paralysis in
Sun et al. eLife 2019;8:e48311. DOI: https://doi.org/10.7554/eLife.48311 17 of 18Research article Neuroscience
narcoleptic mice. Journal of Neuroscience 31:6028–6040. DOI: https://doi.org/10.1523/JNEUROSCI.6069-10.
2011, PMID: 21508228
Liu M, Blanco-Centurion C, Konadhode RR, Luan L, Shiromani PJ. 2016. Orexin gene transfer into the amygdala
suppresses both spontaneous and emotion-induced cataplexy in orexin-knockout mice. European Journal of
Neuroscience 43:681–688. DOI: https://doi.org/10.1111/ejn.13158, PMID: 26741960
Mahoney CE, Agostinelli LJ, Brooks JN, Lowell BB, Scammell TE. 2017. GABAergic neurons of the central
amygdala promote cataplexy. The Journal of Neuroscience 37:3995–4006. DOI: https://doi.org/10.1523/
JNEUROSCI.4065-15.2017, PMID: 28235898
Morawska M, Buchi M, Fendt M. 2011. Narcoleptic episodes in orexin-deficient mice are increased by both
attractive and aversive odors. Behavioural Brain Research 222:397–400. DOI: https://doi.org/10.1016/j.bbr.
2011.04.005, PMID: 21510981
Muñoz-Torres Z, Velasco F, Velasco AL, Del Rı́o-Portilla Y, Corsi-Cabrera M. 2018. Electrical activity of the human
amygdala during all-night sleep and wakefulness. Clinical Neurophysiology 129:2118–2126. DOI: https://doi.
org/10.1016/j.clinph.2018.07.010, PMID: 30103160
Nardone R, Bergmann J, Lochner P, Caleri F, Kunz A, Staffen W, Tezzon F, Ladurner G, Trinka E, Golaszewski S.
2010. Modafinil reverses hypoexcitability of the motor cortex in narcoleptic patients: A TMS study. Sleep
Medicine 11:870–875. DOI: https://doi.org/10.1016/j.sleep.2010.05.007
Nishino S, Riehl J, Hong J, Kwan M, Reid M, Mignot E. 2000a. Is narcolepsy a REM sleep disorder? analysis of
sleep abnormalities in narcoleptic dobermans. Neuroscience Research 38:437–446. DOI: https://doi.org/10.
1016/S0168-0102(00)00195-4, PMID: 11164570
Nishino S, Ripley B, Overeem S, Lammers GJ, Mignot E. 2000b. Hypocretin (orexin) deficiency in human
narcolepsy. The Lancet 355:39–40. DOI: https://doi.org/10.1016/S0140-6736(99)05582-8
Ponz A, Khatami R, Poryazova R, Werth E, Boesiger P, Schwartz S, Bassetti CL. 2010. Reduced amygdala activity
during aversive conditioning in human narcolepsy. Annals of Neurology 67:394–398. DOI: https://doi.org/10.
1002/ana.21881, PMID: 20373351
Roth B, Brůhová S, Lehovský M. 1969. REM sleep and NREM sleep in narcolepsy and hypersomnia.
Electroencephalography and Clinical Neurophysiology 26:176–182. DOI: https://doi.org/10.1016/0013-4694
(69)90208-9, PMID: 4183371
Scammell TE, Willie JT, Guilleminault C, Siegel JM, International Working Group on Rodent Models of
Narcolepsy. 2009. A consensus definition of cataplexy in mouse models of narcolepsy. Sleep 32:111–116.
DOI: https://doi.org/10.5665/sleep/32.1.111, PMID: 19189786
Smith CT, Miskiman DE. 1975. Increases in paradoxical sleep as a result of amygdaloid stimulation. Physiology &
Behavior 15:17–19. DOI: https://doi.org/10.1016/0031-9384(75)90272-3, PMID: 172925
Snow MB, Fraigne JJ, Thibault-Messier G, Chuen VL, Thomasian A, Horner RL, Peever J. 2017. GABA cells in the
central nucleus of the amygdala promote cataplexy. The Journal of Neuroscience 37:4007–4022. DOI: https://
doi.org/10.1523/JNEUROSCI.4070-15.2017
Sun Y, Blanco-Centurion C, Zou B, Bendell E, Shiromani PJ, Liu M. 2019. Amygdala GABA neurons project to
vlPAG and mPFC. IBRO Reports 6:132–136. DOI: https://doi.org/10.1016/j.ibror.2019.03.001, PMID: 31193158
Vaudano AE, Pizza F, Talami F, Plazzi G, Meletti S. 2019. The neuronal network of laughing in young patients
with untreated narcolepsy. Neurology:10.1212/WNL.0000000000006853. DOI: https://doi.org/10.1212/WNL.
0000000000006853, PMID: 30635496
Wada M, Mimura M, Noda Y, Takasu S, Plitman E, Honda M, Natsubori A, Ogyu K, Tarumi R, Graff-Guerrero A,
Nakajima S. 2019. Neuroimaging correlates of narcolepsy with cataplexy: a systematic review. Neuroscience
Research 142:16–29. DOI: https://doi.org/10.1016/j.neures.2018.03.005, PMID: 29580887
Weber F, Hoang Do JP, Chung S, Beier KT, Bikov M, Saffari Doost M, Dan Y. 2018. Regulation of REM and Non-
REM sleep by periaqueductal GABAergic neurons. Nature Communications 9:354. DOI: https://doi.org/10.
1038/s41467-017-02765-w, PMID: 29367602
Yang Y, Liu N, He Y, Liu Y, Ge L, Zou L, Song S, Xiong W, Liu X. 2018. Improved calcium sensor GCaMP-X
overcomes the calcium channel perturbations induced by the calmodulin in GCaMP. Nature Communications 9:
1504. DOI: https://doi.org/10.1038/s41467-018-03719-6
Sun et al. eLife 2019;8:e48311. DOI: https://doi.org/10.7554/eLife.48311 18 of 18You can also read